8th World Conference on Experimental Heat Transfer, Fluid Mechanics, and Thermodynamics June 16-20, 2013, Lisbon, Portugal
FLOW VISUALISATION AND WAKE CHARACTERISATION OF A SLIDING
BUBBLE USING PARTICLE IMAGE VELOCIMETRY
Rudi O’Reilly Meehana, Brian Donnellyb, Tim Persoonsa, Darina Murraya
a Department of Mechanical and Manufacturing Engineering, Trinity College, Dublin 2, Ireland
b Thermal Management Research Group, Efficient Energy Transfer (ηET) Department, Bell Labs Research, Alcatel-lucent Ireland,
Blanchardstown Business & Technology Park, Snugborough Rd, Dublin 15, Ireland E-mail: [email protected]
ABSTRACT
Both vapour and gas bubbles are known to increase heat transfer rates from adjacent heated surfaces, a phenomenon attributed to the associated wake behaviour. Although the wake structures of free rising bubbles have been studied extensively, few studies have been performed on the sliding bubble wake, a case that occurs in many practical engineering applications, such as shell and tube heat exchangers.
This study investigates the wake structures present behind a single bubble, sliding on an adiabatic surface, inclined at 30° to the horizontal. Bubble volumes of 0.05, 0.1, 0.2 and 0.4 ml were examined. The velocity and vorticity of the wake structures were measured parallel and perpendicular to the test surface using the Particle Image Velocimetry technique. These two planar flow field measurements were used to infer the three-dimensional wake structure.
Analysis of the vorticity and velocity data suggests the wake structures are hairpin vortices, shed alternately from each side of the bubble rear. This finding is supported by the literature associated with the wakes of freely rising bubbles and bluff bodies, such as spheres. This improved understanding of the wake structures will allow for future optimisation of the heat transfer enhancement effects offered by sliding bubbles.
Keywords: Sliding bubble, PIV, Wake structures, Vortex shedding
1. INTRODUCTION
It is known that vapour and gas bubbles can significantly increase convective heat transfer rates from an adjacent heated surface [1]. One situation in which this is encountered is the impact, and subsequent sliding, of a bubble along a heated inclined surface. This scenario has been observed in many practical applications, such as shell and tube heat exchangers and chemical reactors. Although free rising bubbles have been studied extensively [2], few studies have been performed on sliding bubbles. The understanding of the heat transfer enhancement offered by bubbles also remains incomplete. However, dimensional surface temperature measurements have revealed periodic regions of enhanced heat transfer, coupled with the bubble’s periodic motion [3].
The heat transfer enhancement caused by bubbles can come from the evaporation of the liquid micro-layer, present between the heated surface and the bubble (vapour bubbles only), as well as the interaction of the bubble and its accompanying wake with the thermal boundary layer. There are two mechanisms associated with this interaction. Firstly, the bubble acts as a bluff body, increasing the heat transfer to the fluid by bulk convection, through displacement of the thermal boundary layer. Secondly, vortex shedding from the bubble wake results in a greater amount of mixing of the surrounding fluid, thinning the thermal boundary layer. This vorticity is generated in the shear layer near the bubble interface and is convected downstream.
The literature on sliding bubbles is limited. Work done to date has focused on the heat transfer and motion of sliding
bubbles, rather than an analysis of the wake structures [1], [3], [4]. In order to understand the structures in the wake of a sliding bubble, it is necessary to look to the literature for free rising bubbles. Fan and Tsuchiya [5] have carried out a detailed analysis of the wake behind rising bubbles. They found that the wake is divided into two regions: the primary and secondary wake. The primary wake describes the fluid flow to the immediate rear of the bubble, approximately within 1 diameter, where vortices are formed. The secondary wake is considered to be the remainder of the wake, and consists of the vortices shed from the primary wake.
Bubbles with small Reynolds numbers exhibit a steady wake, with a closed toroidal vortex in the primary wake. As the Reynolds number is increased, this wake becomes unstable, and alternating vortices are shed from the primary wake. The instability may come from a perturbation in the flow, resulting in an asymmetry in the wake. This puts a lateral force on the bubble, resulting in path oscillations. The path oscillations and vortex shedding are usually coupled, however this is not always a 1:1 relationship [6].
hairpin vortices.
The no-stress boundary condition at the bubble interface is different to the no-slip condition associated with a solid bluff body. However, Fan and Tsuchiya [5] discovered that the structures observed in the secondary wake of a rising bubble are analogous to those observed behind solid bluff bodies, such as disks, cylinders and spheres. This would indicate that the wake structures of some bluff bodies can be compared with the results obtained by this study, even when considering the different boundary conditions.
In a study undertaken by Stewart et al. [9], the wake behind a sphere rolling at a wall was investigated, both experimentally and numerically, over a range of Reynolds numbers and sphere rotation rates. The observed flow structures are highly dependent on the Reynolds number and rotation rate. With increasing Reynolds number, the wake undergoes a smooth transition from the steady regime to the unsteady regime. The steady regime describes a compact recirculation zone behind the sphere, which, eventually, develops into two streamwise vortices. This recirculation zone grows in strength as the Reynolds number increases, until the wake transitions to the unsteady regime. For the unsteady wake, two distinct modes are observed. When the sphere is in forward rotation, vorticity rolls up and is shed over the top of the surface, resulting in the formation of hairpin vortices. These vortices are then transported downstream. This is referred to as the symmetric mode. The second, asymmetric mode, occurs when the sphere is in reversed rotation. In this case, the wake takes the form of two distinct streamwise vortices. These form around the sides of the sphere, creating an out of phase spiral pair. It remains unclear which of these modes, if any, corresponds with the case of a sliding bubble. Differences observed may be due to the lower Reynolds numbers, the different boundary conditions and the fact that the sphere is laterally constrained, unlike the bubble.
The aim of the present study is to characterise the wake of a sliding air bubble in quiescent water. PIV is used in order to obtain the spatial and temporal evolution of the flow field behind a sliding bubble. PIV allows for measurements of the velocity and vorticity of the flow. The wake structures obtained are compared with the literature on free rising bubbles, and that available for sliding bubbles. The wake is also compared with that of spheres translating and rolling at a solid wall. This will test the validity of comparisons between bluff bodies and sliding bubble wakes. This study will also quantify the effect of changing the bubble volume on these wake structures.
Although the ultimate goal of the study is to optimise the heat transfer enhancement provided by a sliding bubble, continuing the work performed by Donnelly et al. [1], the current study is performed on an adiabatic surface. This is done in order to decouple the effects of the thermal boundary layer on bubble motion, which can obscure fluid dynamics effects. The study will later include effects of surface heating.
2. EXPERIMENTAL METHODOLOGY
The experimental apparatus consists of a tilting test tank that can be set to a specific angle 𝛽 between 0 and 45 degrees. For
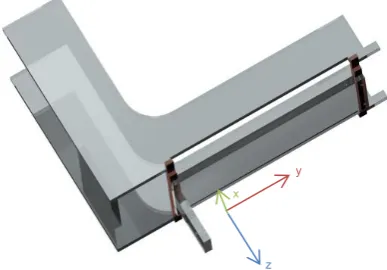
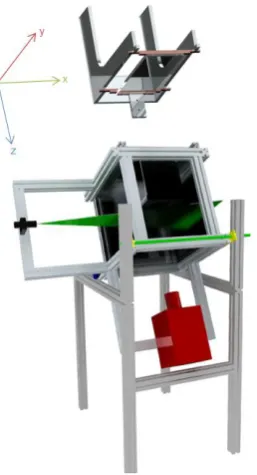
[image:2.595.331.525.233.368.2]the current study, the tank is set to 30° to the horizontal for all tests. The 420 x 420 x 420 mm tank is constructed from 6mm thick plate glass, and is supported by an aluminium structure. This structure includes attachments for the laser and high-speed camera, which remain in the same position relative to the surface, regardless of the inclination angle. The test section for this experiment is a 270 x 110 x 10 mm smooth acrylic sheet, shown in figure 1. This is mounted onto an acrylic frame that sits into the tank in the z-direction, as shown in figure 2. The tank is filled with deoxygenated water.
Figure 1: Close-up of the acrylic test surface. The bubble moves along the surface in the y direction.
Below the sliding surface is the bubble generation mechanism. An infusion pump (kdScientific KDS 200 CZ) supplies air to an inverted cup through silicon tubing, via a syringe. Air bubbles are allowed to coalesce inside the cup to form a single bubble. Pulling a control cable releases the bubble, which impacts, and then slides along the test surface. The bubble release mechanism is at a sufficient distance from the test region as to not adversely affect the fluid flow, and yet, to allow the bubble to reach terminal velocity. This system allows bubbles of a precise volume to be released.
The PIV flow measurement system comprises a high repetition rate, double-pulsed laser (Quantronix Darwin Duo Nd:YLF, 15 mJ per pulse, 527 nm), and a high speed CMOS camera (Photon Fastcam SAI, 1024x1024 pixel, 12 bit). The laser plane is approximately 1.5 mm thick. Polyamide tracer particles, of 50 µm nominal diameter, and a density matching that of the water, are dispersed into the tank. The bulk water temperature is maintained at 23°C throughout testing.
The testing setup has two possible configurations, depending on the orientation of the laser plane, which can be positioned either parallel or perpendicular to the surface.
With the laser positioned in the parallel configuration, the plane of illumination is located 3mm from the surface. The camera is positioned underneath the tank and has a field of view measuring 75 x 75 mm, corresponding to the x-y plane, as indicated in figure 2.
For the perpendicular case, the laser sheet is rotated by 90 degrees, thereby illuminating a plane containing the x-z axis. This plane is positioned 4cm from the upper edge of the surface,
z x
thus, allowing bubbles to reach terminal velocity. The camera is mounted on a tripod, where it looks down into the front of the tank. The camera observes a 60 x 60 mm region of the x-z plane, as the bubble slides towards the camera in the y direction.
[image:3.595.110.239.195.433.2]For this study, a recording rate of 500 Hz is used. This is a compromise between high temporal resolution, and long duration recording, limited by the memory of the camera. The duration of each recording is 10 seconds.
Figure 2: Setup for the parallel measurement plane. The test section sits into the tank in the z direction.
Lavision DaVis 7.2.2 software is used to process and analyse the captured images. This package uses a multi-pass, time series correlation method, to infer the motion of the tracer particles. This correlation algorithm, with adaptive window deformation uses an interrogation window, decreasing in size from 64x64 to 32x32 pixels in 5 passes, which gives high spatial accuracy and high correlation strength. A 75% window overlap, and Whittaker reconstruction, are applied in the final pass. The processed vector fields are post-processed in Matlab, using a purpose written script to display the velocity and vorticity flow fields.
3. RESULTS AND DISCUSSION
In this study, bubble volumes (𝑉𝑏) of 0.05, 0.1, 0.2 and 0.4
ml are investigated, which correspond to spherical equivalent diameters of 4.6, 5.8, 7.3 and 9.1mm, respectively. Three tests are performed at 𝛽 = 30° for each bubble volume, for both the parallel and perpendicular configurations. The Reynolds number range for this study was 990−2130.
3.1 Bubble Dynamics
Analysis of the PIV raw images indicates that the path of the bubble along the surface is unsteady, exhibiting an oscillatory
behaviour. These path oscillations, which are more pronounced at higher bubble volumes, can be explained by considering the work done on the fluid by the bubble as it slides along the surface. Some of the work, equal to the velocity multiplied by the buoyancy force, is dissipated by viscosity, while some is converted into wake structures, which induce secondary motion [5]. The secondary motion refers to path oscillations, such as the zigzagging behaviour observed in this study. For bubbles of this volume, this motion is expected, as the Reynolds number, in all tests, exceeds the critical value for instability (Re> 200).
At all bubble volumes tested, the bubble shape is elliptical, and experiences shape oscillations. The bubble shape fluctuates and changes its orientation (i.e. the angle made with the x-axis) as it slides along the surface. At higher volumes, the bubbles become wider ellipses, and experience greater shape oscillations. The theoretical velocity of the bubble is found by resolving the forces experienced by the bubble, as it slides along the surface. A sliding bubble experiences a buoyancy force, 𝐹𝑏 and a
drag force, 𝐹𝑑. These are given by equations (1) and (2).
𝐹𝑏= (𝜌𝑤− 𝜌𝑎)𝑔𝑉𝑏𝑠𝑖𝑛(𝛽) ≈ 𝜌𝑤𝑔𝑉𝑏𝑠𝑖𝑛(𝛽) (1)
𝐹𝑑= 𝐶𝑑𝐴 𝜌𝑤𝑉∞2
2 (2)
As the bubble slides along the surface, it reaches a nominal terminal velocity prior to reaching the measurement region. At this point, the buoyancy force of the bubble is equal to the drag force opposing motion (however, the bubble does zigzag, so these forces fluctuate about the mean). This means it is possible to solve (1) and (2) for the theoretical velocity 𝑉∞. In this case, a
spherical bubble is assumed, meaning the volume 𝑉𝑏 and area 𝐴
are those of a sphere and circle, respectively. The drag coefficient 𝐶𝑑 for a spherical bubble is given as 0.47 when the
Reynolds number is between 1000 and 105 [10].
In order to take into account the ellipsoid bubble shape, the drag force is scaled by a dimensionless shape factor, defined as the ratio of effective frontal area to that of a sphere of the same volume.
Figure 3: Mean velocity magnitude at each volume for a sliding bubble (○), an ideal sphere and ellipsoids of frontal
[image:3.595.310.544.557.718.2]Figure 3 shows the experimental mean bubble velocity for each volume. Also plotted are the theoretical velocity for a perfect sphere, and for ellipsoids of frontal area ratios 1.5:1 and 2.7:1, respectively. The results show that increasing the bubble volume causes an increase in the velocity of the bubble, for all volumes tested. The measured velocity is lower than that of the perfect sphere. This is due to the greater drag due to the ellipsoidal bubble shape, and the induced drag associated with the shape fluctuations. It is also likely, that in addition to the form drag, the bubbles experience an additional sliding drag force at the surface.
3.2 Wake Structures: Parallel Plane
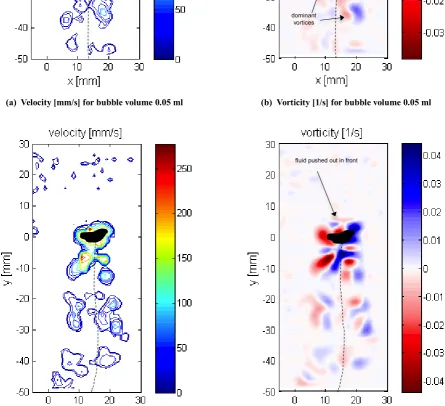
Figure 4 shows the velocity and vorticity measured in the parallel (x-y) plane, for bubble volumes of 0.05 and 0.1 ml. Figure 5 shows the velocity and vorticity images in the x-y plane, for volumes of 0.2 and 0.4 ml. The approximate bubble path, and bubble outline, are also shown. In all cases, the centroid of the bubble is located at y=0.
The PIV results in the parallel plane show that, to the rear of the bubble, there is an alternating shedding of counter-rotating vortices from either side. These vortices are shed periodically, as the bubble transverses the surface. The vortices, left and right of the bubble centroid, are shed with one dominating in strength. The strength of the vortices alternates between each side of the wake; i.e., on the second period of shedding, the opposite side dominates. This is illustrated in figure 4 (a) and (b).
To the rear of the bubble, there is no recirculation zone visible in the results. This is because the Reynolds number, for all volumes, is sufficiently high to allow a transition to the unstable alternate shedding mode. It is also observed, that in all cases, fluid is pushed out ahead of the bubble as it travels along the surface, at a velocity comparable to that of the bubble velocity. This is illustrated in figure 4 (d). In the far wake (i.e. far downstream of the bubble), the vortices are smaller in magnitude, but larger in size.
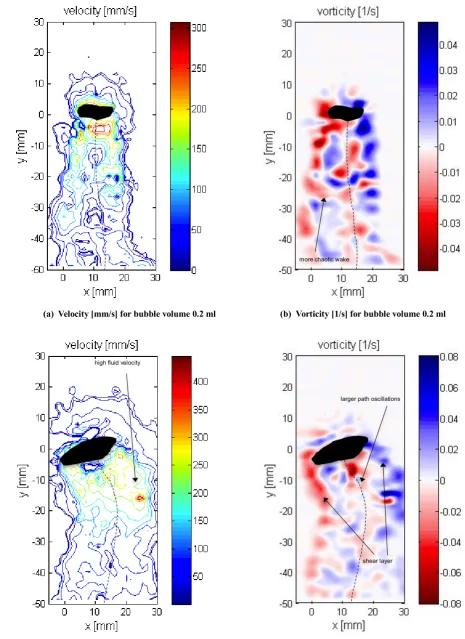
Figures 4 and 5 show that increasing the bubble volume has a strong influence on the wake flow structures, via the process of increased bulk fluid convection. This is coupled with the greater path and shape oscillations, as discussed in section 3.1. The net outcome of this is that the flow structures increase in magnitude but decrease in coherency for larger bubble volumes. In particular, for the 0.4 ml bubble, shown in figure 5 (d), it is difficult to identify the alternating shedding of vortices. However, the wake structures are of the same form for all bubble volumes measured. It is only the clarity of these structures that changes with increasing volume.
This alternating wake structure can be explained by analysing the drag force in the wake, as performed by Stewart et al. for a rolling sphere in the anti-symmetric mode [9]. When a vortex is shed to the left of the bubble, the drag force in the wake reduces. This results in the bubble accelerating in the positive x and y direction. The anti-symmetric wake causes the next vortex developed to have a net drag force component in the negative x direction. This acts to change the direction of the bubble, and
leads to a fluctuation in the drag force about a mean of 0, as illustrated by Stewart et al [9]. These results are also consistent with the anti-symmetric wake mode presented by Donnelly [11]. The shedding of vortices observed in this study is feasibly a set of periodically shed, interconnected loops, cut by the measuring plane parallel to the surface. This is consistent with the x-y projection of a hairpin vortex [5].
3.3 Wake Structures: Perpendicular Plane
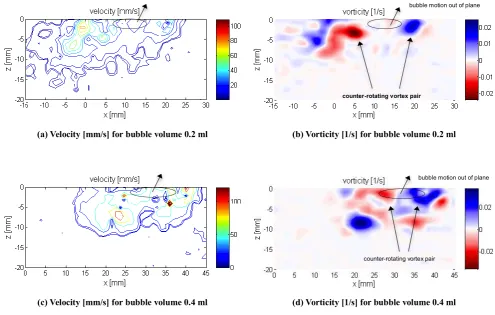
Figure 6 shows the velocity and vorticity in the perpendicular (x-z) plane for bubble volumes of 0.2 and 0.4 ml. In this setup, the bubble slides along the surface, towards the camera. The measurement plane is situated 4cm from the upper end of the sliding surface. The upper edge of the surface corresponds to the plane z=0 in figure 6. Upon passing through the measurement plane, the bubble obscures the view of the tracer particles, for the time taken to transverse one diameter. This means the images are being analysed between 0.02 and 0.025 seconds after the passing of the bubble.
The PIV results, in a plane perpendicular to the surface, indicate that the bubble passing through the measurement plane leads to the formation of two counter-rotating vortices in its immediate wake. For all bubble volumes measured, the vortex on the left of the bubble rotates anticlockwise, the vortex on the right, clockwise. Analysis of the images shows that the strength of these vortices appears to decay rapidly. However, it is more likely that, instead of decaying, the vortex pair is travelling slowly upstream, due to the associated momentum of the bubble. This takes the vortex pair outside of the measurement plane. Incidentally, the shedding of these counter-rotating vortex pairs is observable for all bubble volumes. This study only presents those for the larger volumes, as the higher velocity magnitude makes these flow structures easier to observe.
The counter-rotating vortex pairs, observed in the x-z plane, are likely a cross-section of the two tails of the distorted vortex ring, associated with a hairpin vortex structure. These vortex pairs form a set of interconnected loops [5]. However, as the measurement plane shows only a snapshot of the flow field in a single plane, it is not possible to view multiple vortices, nor is it possible to observe any out of plane motion associated with each vortex pair. In any case, the obtained results are consistent with an instantaneous view of a hairpin vortex.
(a) Velocity [mm/s] for bubble volume 0.05 ml (b) Vorticity [1/s] for bubble volume 0.05 ml
[image:5.595.77.523.294.700.2](c) Velocity [mm/s] for bubble volume 0.1 ml (d) Vorticity [1/s] for bubble volume 0.1 ml Figure 4: Velocity and Vorticity in a plane parallel to surface (x-y plane) for bubble volumes 0.05 and 0.1 ml.
dominant vortices alternate
shedding
(a) Velocity [mm/s] for bubble volume 0.2 ml (b) Vorticity [1/s] for bubble volume 0.2 ml
[image:6.595.60.526.82.722.2](c) Velocity [mm/s] for bubble volume 0.4 ml (d) Vorticity [1/s] for bubble volume 0.4 ml Figure 5: Velocity and vorticity in a plane parallel to surface (x-y plane) for bubble volumes 0.2 and 0.4 ml.
larger path oscillations high fluid velocity
more chaotic wake
(a) Velocity [mm/s] for bubble volume 0.2 ml (b) Vorticity [1/s] for bubble volume 0.2 ml
[image:7.595.49.545.96.411.2](c) Velocity [mm/s] for bubble volume 0.4 ml (d) Vorticity [1/s] for bubble volume 0.4 ml
Figure 6: Velocity and Vorticity in a plane perpendicular to surface (x-z plane) for bubble volumes 0.2 and 0.4 ml.
4. CONCLUSION
An experimental study has been conducted on the flow structures created by a sliding bubble on an inclined surface. PIV data has been obtained and processed, to provide results for the vorticity and velocity of the bubble wake for a bubble sliding along a 30° inclined surface, for four different bubble volumes. The flow structures were measured parallel and perpendicular to the surface.
The PIV results obtained in the parallel plane show the periodic alternating and shedding of counter-rotating vortices at the rear of the bubble. In the perpendicular plane, the results show the formation of two counter-rotating vortices in the immediate wake of the sliding bubble. Both of these two-planar configurations are consistent with those of an alternating hairpin vortex structure, which forms a set of interconnected distorted rings behind the bubble.
Hairpin vortices have previously been observed behind freely rising bubbles [5] and bluff objects, such as spheres [9]. However, the presence of the wall in these experiments does affect the shedding direction of these vortices. The wake structures found behind a sliding bubble most closely match those observed at a non-rolling sphere on a wall. For that case, the wake structures behind the sphere are simultaneous, while the results here show the alternate shedding of vortices. This is
caused by the influence of the oscillating drag force on the bubble path and wake structures. The bubble motion matches the anti-symmetric, oscillating mode, identified by Donnelly [11].
Further work will reinforce this study, by examining the effects of changing the surface inclination angle on the associated wake structures. This will provide a thorough understanding of the wake structures behind a sliding bubble. This knowledge of the wake structures can be utilised by future work to optimise the heat transfer enhancement offered by bubbles sliding along a heated surface.
5. ACKNOWLEDGEMENTS
This research is supported by the Irish Research Council under its Enterprise Partnership scheme, grant number EPSPG/2012/323, in association with Bell Labs Ireland. Bell Labs Ireland would like to thank the Industrial Development Agency (IDA) Ireland for their financial support.
6. REFERENCES
1. B. Donnelly, T. S. O’Donovan, D. B. Murray, Surface heat transfer due to sliding bubble motion, Applied Thermal Engineering, vol. 29, pp. 1319-1326, 2009.
counter-rotating vortex pair
counter-rotating vortex pair
bubble motion out of plane
2. D. Bhaga and M. E. Weber, Bubbles in viscous liquids: Shapes, wakes and velocities, Journal of Fluid Mechanics, vol. 105, pp. 61-85, 1981.
3. D. Li and V. K. Dhir, Numerical study of a single bubble sliding on a downward facing heated surface, Journal of Heat Transfer, vol. 129, pp. 877-883, 2007.
4. B. Bayazit, D. Hollingsworth, L. Witte, Heat transfer enhancement caused by sliding bubbles, Journal of Heat transfer, vol. 125, pp. 503-509.
5. L. S. Fan and K. Tsuchiya, Bubble Wake Dynamics in Liquids and Liquid-Solid Suspensions. Butterworth-Heinemann Series in Chemical Engineering, 1990. 6. T. Sanada, M. Shirota, M. Watanebe, Bubble wake
visualisation by using photochromic dye, Chemical Engineering Science, vol. 62, no. 24, pp. 7264-7273,
2007.
7. C. Brücker, Structure and dynamics of the wake of bubbles and its relevance for bubble interaction, Physics of Fluids, vol. 11, pp. 1781-1796, 1999. 8. K. Lunde and R. J. Perkins, Shape oscillations of
rising bubbles, Applied Scientific Research, vol. 58, no. 1, pp. 387-408, 1997.
9. B. E. Stewart, M. C. Thompson, T. Leweke, K. Hourigan, Numerical and experimental studies of the rolling sphere wake, Journal of Fluid Mechanics, vol. 643, pp. 137-162, 2010.
10. H. Schlichting, “Boundary-Layer Theory,” 7th Ed., McGraw-Hill, New York, 1979.