Munich Personal RePEc Archive
Beginning an African Stock Markets
Integration? A Wavelet Analysis
Gourène, Grakolet Arnold Zamereith and Mendy, Pierre and
Elegbe, Aguin Franck Yvon
2017
Online at
https://mpra.ub.uni-muenchen.de/79697/
Beginning an African Stock Markets Integration? A Wavelet Analysis
Grakolet Arnold Z. Gour`
ene
∗Laboratory of Mathematics of the Decision and Numerical Analysis
Cheikh Anta Diop University
B.P. 5005 Dakar-Fann, S´
en´
egal
Pierre Mendy
†Laboratory of Mathematics of the Decision and Numerical Analysis
Cheikh Anta Diop University
B.P. 5005 Dakar-Fann, S´
en´
egal
Aguin Franck Yvon Elegbe
‡Ph.D Student in Economics, Cheikh Anta Diop University
B.P. 5005 Dakar-Fann, S´
en´
egal
June 13, 2017
Abstract
This paper examines the integration of the six largest African stock markets at different timescales. We
want to see whether the numerous measures and reforms put in place to integrate the African stock markets
are effective. First, we used the Wavelet Multiple Correlation and the Wavelet Multiple Cross-Correlation
proposed by Fern´andez-Macho(2012). Then, we combine the spillovers index based on generalized vector
autoregressive proposed byDiebold and Yilmaz(2012) with the Maximal Overlap Discrete Wavelet
Trans-form. We find that after all the reforms, African stock markets integration remains weak and tends to decline
despite some small progress in the flow of financial information. We also find that the integration of African
stock exchanges varies according to timescales. More efficient measures are therefore needed for the effective
integration of African financial markets, but also for policies that better promote exchanges between these
stock markets.
JEL Classification: C4, F3, G1.
Keywords: Stock Markets Integration, Wavelet Multiple Correlation, Wavelet Multiple Cross-Correlation, Generalized VAR.
∗Corresponding Author. Tel: +221774475366. Email: grakolet88@gmail.com †Email: pierre.mendy@ucad.edu.sn
‡Email: israelelegbe7@gmail.com
1
Introduction
Over the last decades, the stock markets in Africa have experienced a certain growth. Many stock markets
have emerged in various countries and some have even attracted attention because of their performance (see
PwC, 2015, 2016; ASEA,2012, 2015). The number of stock markets has increased from 12 to 25 today. The
capitalization of the 10 largest African stock markets recorded exceptional growth of 390.77% from 2000 to
2010. Between the years 2007 and 2009, more than $10bn1 of capital were identified in 18 stock exchanges of
200 new companies IPO2and more recently we had 125 IPOs from 2011 to 2016 (raising $6.1bn).
This sudden development of financial markets bodes well for African economies. Indeed, Bagehot(1873),
Hicks(1969) andSchumpeter(1912) affirmed that good financial institutions positively impact productivity of
capital and promoted technical innovation. Levine(1997) said that the financial market played a prominent role
in growth, capital accumulation and economic development. However, this rapid growth in financial markets
does not appear to be sufficient. Indeed, by 2015, African financial markets accounted for only 1.4% of the
world’s market capitalization3. These results show that African financial markets, despite their notable advances,
remains lagging behind global finance.
Some authors have shown that a more integrated African financial market would be more efficient and
therefore more internationally competitive. Fish and Biekpe (2002) argued that an African regional stock
exchange may improve liquidity while reducing cost of operations. Irving (2005) said that an integration
between African financial markets from different African economic zones allow a better depth and a wider choice
of financial products. According to ARIA III(2008), market integration will lead to increase the liquidity in
African financial markets. Several countries will be able to pool their resources for regional cooperation and
stock markets development. ForLugangwa(2012), the cooperation and integration of African markets will make
them more visible to global investors. Given their small sizes, UNCTAD(2014) suggest that African financial
markets should unite on a continental or regional scale for their development.
Many reforms and measures have been taken to integrate the African stock markets between them but also
with the outside. The creation of African Securities Exchanges Association (ASEA)4to improve the visibility of
African Securities in the world, provide a better knowledge of African stock market and promote trade between
African financial markets. The establishment of two regional stock exchanges, the Bourse R´egionale des Valeurs
Mobili‘eres (BRVM) from the WAEMU5and the Bourse des Valeurs Mobilires de l’Afrique Centrale (BVMAC)
from the CEMAC6. The implementation of closer cooperation and harmonization between stock markets in the
same region (ECOWAS7, AMU8. . . ) In order to improve liquidity and market depth. In 2014 East African
stock markets9have taken steps towards a harmonized capital market (seeUNCTAD, 2014;PwC,2015). The
1
Billion
2
Initial Public Offering
3
With 77 % came only from the South African stock market
4
URL:http://www.african-exchanges.org/
5
West African Economic and Monetary Union
6
Central African Economic and Monetary Community
7
Economic Community of West African States
8
Arab Maghreb Union
9
Kenya, Uganda, Tanzania, Rwanda, Burundi
stock exchanges of WAEMU10, Nigeria and Morocco respectively signed partnerships with Paris EUROPLACE,
London Stock Exchange Group (LSEG) and FTSE Group. Since 2011, The ASEA, in partnership with the
Financial Times Stock Exchange (FTSE) created two indices: the FTSE ASEA pan African Index Series and
the FTSE ASEA pan Africa Index ex South Africa. One of the role of the indices is to highlight the performance
of African stock markets(ASEA,2015).
Several authors have therefore been interested in the integration of these African financial markets. Collins
and Biekpe (2003a,b); Wang et al. (2003) were interested in the integration of African stock markets during
and after the Asian crisis of 1997. Adjasi and Biekpe (2006);Agyei-Ampomah(2008);Boamah(2013) studied
the link between African stock exchanges. Using the Diebold and Yilmaz(2012) spillovers index, Sugimoto et
al.(2014);Fowowe and Shuaibu(2016) analyzed the relationship between the African stock markets during the
U.S financial crisis and the European debt crisis. All these works agreed that African financial markets are
poorly integrated.
However, these works have limitations in their analysis of the relationship between financial markets. The
only temporal aspect is not very realistic given the nature of the financial markets. Stock markets are a complex
system composed of different agents with different trading horizons that form the dynamics of the markets. The
trading scale11is therefore a very important aspect. Consider decisions at different timescales (seeCandel´on et
al.,2009) gives more details on the co-movement between stock markets. Methods such as co-integration and
error correction model (seeEngle and Granger,1987) are then limited because they take into account only two
scales (short and long run) on several. In the world markets co-movement, these methods are illustrated by
works such as Fern´andez-Macho(2012) in Europe,Tiwari et al. (2013) in Asia, Loh(2013) between Asia and
the outside,Graham and Nikkinen(2011),Graham et al.(2012,2013),Madaleno and Pinho(2012) in emerging
and developed stock markets ,Aloui and Hkiri (2014) in Gulf Cooperation Council, Gallegati(2005) between
MENA12 and outside andRua and Nunes(2009) between global financial markets.
Here we combine wavelet methods and traditional methods. Wavelets methods analyze the relationship
between stock markets at several timescales (horizon or frequency). This approach provides more details and a
better understanding of the relationship between financial markets that is crucial for financial institutions.
In our work, we want to see whether all the measures taken by the financial authorities tend to integrate
African stock markets. This could be the cause of this financial market which continues to grow despite the
various global crises. First, we use the Maximal Overlap Discrete Wavelet Transform (MODWT) on the different
stock markets returns. These methods allow to data from financial markets to be available at different time
scales. Then, we employ the Wavelet multiple correlation and the Wavelet multiple cross correlation proposed
byFern´andez-Macho(2012), to study the relationship between the African stock markets. After, we apply the
Diebold and Yilmaz(2012) spillovers index to data to determine the spillovers from the African financial markets
towards the African financial markets themselves at different scales. Our study period is very interesting for
the analysis of the relations between financial markets. It covers the last two financial crises, U.S financial crisis
10
West Africa Economic and Monetary Union
11
Trading horizon
12
Middle East and North Africa
and the European debt crisis.
The rest of the study is structured as follows. Section 2gives a overview of the literature on stock markets
integration. Section 3details the econometric methodology used. Section 4examines the data and the empirical
results andSection 5concludes.
2
Literature Review
Some authors have been interested in the integration of African stock markets. Collins and Biekpe (2003a)
showed that the most developed African stock markets (Egypt and South Africa) suffered from contagion
during the Hong Kong crisis of 1997. Collins and Biekpe (2003b) argued that the co-movement of African
financial markets has declined in regional blocs. Using co-integration and error correction model Wang et al.
(2003) demonstrated that integration between African stock markets varied over time and appeared to decline
after the Asian crisis of 1997. Adjasi and Biekpe(2006) has found a unique long-term relationship between
African stock markets and a short-term dynamic of African stock markets returns that affect the South African
and Ghanaian stock exchanges. Using the measurement’s method of the score market integration proposed
byBarari (2004),Agyei-Ampomah(2008) found a low level of correlation between the African stock markets.
RecentlyBoamah(2013) through a multi-factor pricing model, showed that the integration of the African stock
markets evolved over time. Using the Diebold and Yilmaz spillovers index,Sugimoto et al.(2014);Fowowe and
Shuaibu(2016) concluded that the spillovers between African financial markets are very weak. Regarding the
wavelet literature on the integration of financial markets, it is relatively recent at the world level. At the African
level, the literature is practically non-existent. We can cite works such asGallegati(2005) which showed that the
MENA stock markets are neither regionally nor internationally integrated. Rua and Nunes(2009) found that
the Japanese stock market was poorly integrated with the other developed financial markets13. The relationship
between these stock markets varied with timescales. Graham and Nikkinen(2011) demonstrated that the
co-movement between Finland and the emerging stock markets was reduced to long-term fluctuations. With regard
to the co-movement with the stock markets of the developed regions15, it was present in all frequencies, with
strong co-movements at high frequencies. Graham et al. (2012) found a strong co-movement between stock
markets that differs from one country to another. According to the authors, the U.S stock market is highly
correlated to the stock markets of Brazil, Mexico and Korea, but has a weak co-movement with the Egyptian
and Moroccan stock markets. During the U.S financial crisis, the movement between stock markets increased at
smaller scales. Graham et al.(2013) found a low co-movement at small scales but strong at large scales between
the MENA and U.S stock markets. On the other hand, Fern´andez-Macho(2012) proposed two new wavelet
methods: the Wavelet Multiple Correlation and the Wavelet Multiple Cross-Correlation. He applied these
methods to the analysis of the co-movement of the European stock markets. The Wavelet multiple correlation
emphasized a strong correlation between eurozone stock markets that is almost perfect in the long run. The
author also showed small inconsistencies between the euro stock markets in the short and medium term which 13
Germany, U.K14
and U.S
15
Europe, Pacific and North America
must be the result of the interaction of different agents with different decision-making horizons on the stock
markets. The wavelet multiple cross-correlation method revealed that the CAC40 tends to statistically lead the
rest of the euro’s financial markets in the short and medium term (from one week to one month). Madaleno and
Pinho(2012) demonstrated that the strength or weakness of co-movement between financial markets depends on
timescales. Recently, using the methods proposed byFern´andez-Macho(2012),Tiwari et al.(2013) have shown
that Asian stock markets are strongly integrated at low frequencies but less integrated at high frequencies. Loh
(2013) found the presence of a correlation between the Asia-Pacific stock markets and European and American
stock markets. The author noted that the co-movement between the financial markets had increased during
U.S financial crisis. Aloui and Hkiri (2014) showed frequent changes in the co-movement of the GCC16 stock
markets especially after the beginning U.S financial crisis at relatively high frequencies. The authors have found
increased dependency between the GCC stock markets in times of financial crisis.
3
Econometric Methodology
In this section, we present the econometric methodology used to study the relationship between stock markets.
First, we provide an overview of Maximum Overlap Discrete Wavelet Transform. Then, we present the Wavelet
multiple correlation and the Multiple correlation Wavelet proposed by Fern´andez-Macho(2012). Finally, we
describe the Diebold-Yilmaz spillovers index method proposed byDiebold and Yilmaz(2012).
3.1
Maximum Overlap Discrete Wavelet Transform (MODWT)
We use the MODWT to implement the stock market returns at different time scales (seePercival and Walden,
2000). The MODWT localizes variations in the signal or time series in time and frequency simultaneously. The
variability and the evolution over time can be captured by decomposing the time series at many timescales.
Let Xt, the stock markets returns. The time series can be decomposed by a sequence of projections onto
wavelet basis:
sJ,k=
Z
XtΦJ,k(t)dt (1)
dj,k=
Z
Xtψj,k(t)dt (2)
where j = 1,2. . . J, the level of multiresolution and J = log2(T); Φ, the father wavelet and Ψ, the mother
wavelet. sJ,k, the smooth wavelet coefficient (long run movements) provides a smooth or overall pattern of the
original signal and dj,k, the detailed wavelet coefficients (short run movements) capture local fluctuations in
each scale over the entire period of time series. ΦJ,k and Ψj,k are the scaling and translation obtained from Φ
and Ψ and are defined as following.
ΦJ,k(t) = 2−j/2Φ(2−jt−k) = 2−j/2Φ(
t−2jk
2j ) (3)
16
Gulf Cooperation Council
ΨJ,k(t) = 2−j/2Ψ(2−jt−k) = 2−j/2Ψ(
t−2jk
2j ) (4)
For the decomposition, we use Daubechies Least Asymmetric (LA) wavelet filter of length 8 because it is
one of the best and most used in wavelets theory (seePercival and Walden,2000).
The decomposition of the series by the MODWT is usually implemented by the Pyramidal Algorithm (see
Mallat,1999). The multiresolution analysis of the stock markets returnsXtusing the MODWT can be written
as follows.
Xt= J
X
j=1
dj,k+sJ,k, (5)
3.2
Wavelet Multiple Correlation (WMC) and Wavelet Multiple Cross-Correlation
(WMCC)
Let Xt, a multivariate stochastic process with Xt = (x1t, x2t, . . . , xnt) and Wjt = (w1jt, w2jt, . . . , wnjt) their
respective wavelet coefficients calculated by MODWT at each scaleλjfor eachxitprocess. The Wavelet Multiple
Correlation (WMC)ϕX(λj) can be described like one single set of multiscales correlations and can be calculated
from Xt as follows. The square root of the regression coefficient of determination corresponding at each scale
λj, is calculated in the linear combination of variables {wijt, i= 1. . . , n}, whose coefficient of determination
is a maximum. The coefficient of determination corresponding to the regression of a variable zi on a set of
regressors (Zk, k6=i), can be obtained byR2= 1p−ii1 where pii is theith diagonal element of the inverse of the
correlation matrix P.
The Wavelet Multiple Correlation (WMC)ϕX(λj) is calculated as follows.
ϕX(λj) =
s
1− 1
maxdiagP−1
j
, (6)
wherePj correspond to then×ncorrelation matrix ofWjt and the maxdiag (.) operator permits to select the
largest element in the diagonal of the argument. In the regression ofzi on the rest of variables in the system,
the R2
i coefficient can be equal to the square of correlation between the observed values of zi and the fitted
values ˆzi obtained from this regression.
The (WMC)ϕX(λj) is also described as follows.
ϕX(λj) =Corr(wijt,wˆijt) = p Cov(wijt,wˆijt)
V ar(wijt)V ar( ˆwijt)
, (7)
where the wavelet variances and covariance are given by
Cov(wijt,wˆijt) = ¯γj=
1 Tj
T−1
X
t=L−1 j
wijtwˆijt, (8)
V ar(wijt) = ¯δj2=
1 Tj
T−1
X
t=:j−1
wijt2 , (9)
V ar( ˆwijt) = ¯ξj2=
1 Tj
T−1
X
t=:j−1
ˆ
wijt2 . (10)
Here, wij on the set of regressors{wkj, k 6=i} leads to maximize the coefficient of determinationϕX(λj), ˆwij
is the fitted values of regression. The number of wavelet coefficients affected by the boundary associated with
a wavelet filter of lengthLand scaleλj is determined byLj = (2j−1)(L−1) + 1, then ˜T =T−Lj+ 1 is the
number of coefficients unaffected by the boundary conditions.
Lastly, allowing a lagτ between observed and fitted values of the variable selected as the criterion variable
at each scaleλj, we may also define the Wavelet Multiple Cross-Correlation (WMCC).
ϕX,τ(λj) =Corr(wijt,wˆijt+τ) =√ Cov(wijt,wˆijt+τ) V ar(wijt)V ar( ˆwijt+τ)
.
The construction of confidence intervals supposes that X = (X1. . . XT) is a realization of multivariate
Gaussian stochastic process of (6) and ˜Wj = ˜Wj0. . .W˜j,T−1 = {( ˜w1j0. . .w˜njo), . . . ,( ˜w1j,T /2j−1)}, j = 1. . . J,
vectors of the wavelet coefficients obtained by MODWT atJ order to each univariate time series (xi1. . . xiT)
fori= 1. . . n.
If ˆϕX,τ(λj) is the sample wavelet correlation obtained from (6) then
˜
Zj∼aF N(zj,(2Tj −3)−
1).
Here ˜Zj= arctanh( ˆϕX,τ(λj)) andF N stands for folded normal distribution.
The confidence interval (CI) for the sample of wavelet correlation coefficient is given as follows.
CI1−α(ϕX,τ(λj)) = tanh[˜zj±φ−1−1α/2/
p
T /2j−3] (11)
3.3
Diebold-Yilmaz spillover index method
We apply the method proposed byDiebold and Yilmaz(2012) to the wavelets coefficients obtained at different
timescales. This method analyzes the spillovers from African stock markets toward African stock markets over
many timescales.
The Diebold and Yilmaz (2012) spillover index method is an update of the previous method proposed by
Diebold and Yielmaz(2009). Here, the directional spillovers is measured in a generalized VAR framework that
eliminates the possible dependence of the results to the order of variables.
Assume a covariance stationary of N-variable VAR(p).
Xt= p
X
i=1
ΦiXt−i+ǫt, (12)
whereǫ∼(0,Σ) andǫis an i.i.d disturbances vector.
The moving average representation can be written as follows, Xt = P∞i=0Aiǫt−i, where Ai is an N ×N
coefficients matrix defines as follows, Ai = Φ1Ai−1+ Φ2Ai−2+. . .+ ΦpAi−p with Ai, an identity matrix and
Ai= 0 fori <0.
The moving average coefficient allows a better understanding of the method. It is based on the decomposition
of the variance for analyzing forecast error variance of each variable over the entire period of the study. The
variance decomposition gives access to the fraction of the H-step ahead error variance in forecasting xi that is
due to shocks toxj,i6=j for eachi.
Usually VAR innovations are simultaneously correlated while the calculation of the variance decompositions
requires orthogonal innovations. TheDiebold and Yielmaz (2009) method based on the Cholesky factorization
depended on the order of variables. The new method use the generalized VAR framework ofKoop et al.(1996)
andPesaran and Shin(1998), which are invariant to the order of the variables. The H-step ahead forecast error
variance decomposition forH = 1,2, . . . ,that uses the generalized impulse responses is defined as follows.
Θgij(H) =σ
−1
jj
PH−1
h=0(e
′
iAhΣej)2
PH−1
h=0 e
′
iAhΣA
′
hΣei
, (13)
wherei=j, for own variance shares,i6=jfor cross variance shares or spillovers withxiandxj,i, j= 1,2, . . . N.
Σ is the variance matrix for the error vectorǫ, Θij the standard deviation of the error run for thejth equation,
andei the selection vector with one as theith element and zeros elsewhere.
To normalize the sum of the elements in each row equal to 1 to have the information available in the variance
decomposition matrix in the spillover index calculation, own variance and cross-variance shares or spillovers are
defined as follows.
˜
Θgij(H) =
Θgij(H)
PN
j=1Θ
g ij(H)
. (14)
We can calculate the spillovers index using the variances obtained.
Sg(H) =
PN i=1
PN j=1,i6=jΘ˜
g ij(H) PN
i=1 PN
j=1Θ˜ g ij(H) ×
100 =
PN i=1
PN j=1,i6=jΘ˜
g ij(H)
N ×100. (15)
The problem of variance decompositions invariant to the variables order being set, we use standardized
elements of the generalized decomposition variance matrix to calculate the directional spillovers from one market
(i) to others and from all other markets to one market (j).
Sgi(H) =
PN
j=1,i6=jΘ˜ g ij(H)
N ×100 (16)
Sjg(H) =
PN
i=1,i6=jΘ˜ g ij(H)
N ×100. (17)
4
Data and Empirical Results
The data are composed of the main indices of the six largest African stock markets in terms of capitalization,
South Africa (TOP40), Egypt (EGX30), Morocco (MADEX), Nigeria (NGSE), Kenya (NSE20) and West Africa
Economic and Monetary Union17 (BRVM10). We use daily data. The data sample covers the period from 6
January 2003 to 17 August 2016 (2579 observations). We note the presence of missing data due to the lack of
data available at certain times and the difference in working days between the different stock exchanges. The
data were obtained from the Bloomberg database. The stock market returns were calculated as follows.
Rt=LN(Pt/Pt−1),
whereR are the returns andP the closing prices.
Tab. 1: Descriptive Statistics of stock markets returns.
TOP40 EGX30 MADEX NGSE NSE20 BRVM10
Mean 0.0002797 0.0004736 0.0002013 1.347e-04 1.480e-04 0.0001821 Median 0.0005191 0.0008415 0.0001117 -2.100e-07 2.787e-05 0.0000000 Maximum 0.0502502 0.1174578 0.0255168 5.107e-02 5.328e-02 0.0473816 Minimum -0.0481226 -0.0873046 -0.0358855 -4.752e-02 -6.675e-02 -0.0479173 Standard Deviation 0.006733664 0.009567575 0.004355427 0.006130683 0.005325683 0.005125892
Skewness -0.1392378 -0.148027 -0.1447196 0.2234594 0.4868636 0.4788665 Kurtosis 8.408323 20.19298 11.41094 13.91333 32.35976 17.28368 Jarque-Bera 3151.5 31774 7611 12820 92730 22023
(2.2e-16) (2.2e-16) (2.2e-16) (2.2e-16) (2.2e-16) (2.2e-16)
Several summary statistics of returns are reported in Tab. 1. All stock returns have a positive mean. The
African financial markets are profitable and generate profits. The largest standard deviation of EGX30 (Egypt)
means that is the most volatile stock market of the panel. The MADEX (Morocco) which has the lowest
standard deviation is the least volatile stock market. The analysis of skewness show a negative value18 for
the half of all stock returns. These results indicate that there is more negative returns in these series than
positive returns. The high coefficient of kurtosis reveals that the returns distributions have thicker than normal
Gaussian distribution tails. The Jarque-Bera normality test confirms the skewness and kurtosis results with a
pvalue <0.05 for all the returns.
We compute the wavelet coefficients using the MODWT19. For the decomposition, we use Daubechies Least
Asymmetric (LA) wavelet filter of length 820 (Percival and Walden, 2000). The maximum scales number of
decomposition allowed islog2(N)21 where N is the number of observations. However, the wavelet coefficients
become too small for large scales, then we decided to stop to 7 decompositions22 or scales (Tab. 2) with 7
wavelet details23and 1 smooth wavelet coefficient24(long run dynamic). Finally we apply the Wavelet Multiple
Correlation and the Wavelet Multiple Cross-Correlation to data.
17
WAEMU.
18
The thickest portion of their distributions is to the left
19
Maximum Overlap Discrete Wavelet Transform.
20
One of the best and most used in wavelets theory
21
log2(2579) = 11.3 22
J= 7
23
D1,. . . ,D7 24
S7
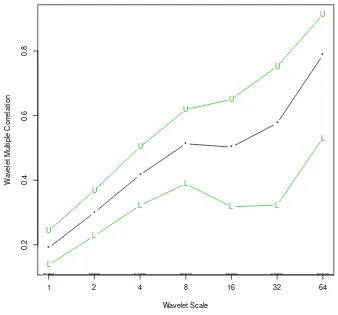
Tab. 2: Wavelet Multiple Correlation analysis.
Wavelet Scales Time Interpretation Correlation Time period
[image:11.595.168.422.79.170.2]D1 2-4 days 0.1908947 intra-week D2 4-8 days 0.2999170 Week D3 8-16 days 0.4167256 Fortnightly D4 16-32 days 0.5126099 Monthly D5 32-64 days 0.5024404 Monthly to Quarterly D6 64-128 days 0.5764255 Quarterly to bi-annual D7 128-256 days 0.7877481 Bi-annual
Fig. 1: Wavelet Multiple Correlation of the six major African stock markets returns.
*
*
*
* *
*
*
0.2
0.4
0.6
0.8
Wavelet Scale
W
a
velet Multiple Correlation
L
L
L
L
L L
L
U
U
U
U
U
U
U
1 2 4 8 16 32 64
TOP40 EGX30 EGX30 EGX30 EGX30 EGX30 EGX30
The lines correspond to the Upper (U) and Lower (L) bounds of the 95% confidence interval.
Fig. 1 andTab. 2 show the wavelet multiple correlation results. We remark that the correlations are very
weak at small scales and tend to grow at larges scales. For the intra-week scale, the correlation is 0.19, for
weekly, it is 0.29, for fortnightly, it is 0.41 and reaches until 0.78 at bi-annual scale. At the bi-annual scale (scale
7), the returns obtained in any stock markets can not be totally determined by overall performance in other
markets, but are quite close.We can assume that at very large scales, African financial markets are integrated.
The discrepancies between the African stock markets are very high but tend to dissipate in horizons close to
one year. We note a temporary decrease in the dynamic of correlation growth at one month to one quarter
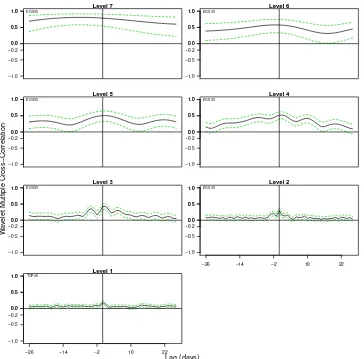
scales. Fig. 2shows the wavelet multiple cross-correlations for the different timescales with leads and lags up (26
[image:11.595.124.462.256.571.2]trading days). The name of the country whose stock market maximizes the multiple correlation against a linear
combination of the rest of variables is in upper-left. This stock exchange can be a potential leader or follower
for the others stock markets. In our case, across all scales, the EGX30 (Egypt) is a potential leader or follower
except at scale 1 where it is the TOP40 (South Africa). The results from the wavelet multiple correlation are
confirmed by the wavelet multiple cross-correlation. For scale 7, we note an asymmetry (negative-skewness)
which means that on this scale, the EGX30 lags the others indices. Compared to other studies of stock markets
integration using the same methods in Europe and Asia (Tiwari et al.,2013;Fern´andez-Macho,2012), African
stock markets are far from integrated. For the construction of the confidence intervals, we used the estimators
[image:12.595.117.481.259.618.2]proposed byWhitcher et al.(2000). They are robust to the non-normality distribution.
Fig. 2: Wavelet Multiple Cross-Correlation of the six major African stock markets returns.
−1.0 −0.5 0.0 0.5 1.0 Level 7 −0.2 0.0 0.5 1.0 EGX30 −1.0 −0.5 0.0 0.5 1.0 Level 6 −0.2 0.0 0.5 1.0 EGX30 −1.0 −0.5 0.0 0.5 1.0 Level 5 −0.2 0.0 0.5 1.0 EGX30 −1.0 −0.5 0.0 0.5 1.0 Level 4 −0.2 0.0 0.5 1.0 EGX30 −1.0 −0.5 0.0 0.5 1.0 Level 3 −0.2 0.0 0.5 1.0 EGX30 −1.0 −0.5 0.0 0.5 1.0 Level 2
−26 −14 −2 10 22 −0.2 0.0 0.5 1.0 EGX30 −1.0 −0.5 0.0 0.5 1.0 Level 1
−26 −14 −2 10 22 −0.2 0.0 0.5 1.0 TOP40 W a
velet Multiple Cross−Correlation
Lag (days)
In the top left the potential lead/lag market. The dotted lines correspond to the Upper (U) and Lower (L) bounds of the 95% confidence interval.
Tab. 3: Lag order selection of the VAR model.
Lag Order
1 2 3 4 5
AIC(n) -6.175581e+012* -6.175484e+01 -6.175995e+01 -6.175811e+01 -6.176096e+01 BIC(n) -6.171620e+01* -6.168552e+01 -6.166093e+01 -6.162939e+01 -6.160253e+01
To go further, we apply the Diebold and Yilmaz (2012) method to the data at different timescales. The
analysis ofTab. 4 shows that for the scalesD1 toD7, the normality hypothesis is not rejected while for the S7
scale it is rejected. We can not therefore use the scale S7 in view of the stationarity hypothesis of the VAR
models. To determine the optimum VAR lag, we use the AIC and the BIC on the original returns data (see
Tab. 3). Based on the different criteria, we have chosen one lag.
Tab. 4: Stationarity test results from scale 1 to scale 7.
Variables ADF(pvalue) KPSS(pvalue) PP (pvalue) Scale1 (D1 )
TOP40 0.01 0.1 0.01 EGX30 0.01 0.1 0.01 MADEX 0.01 0.1 0.01 NGSE 0.01 0.1 0.01 NSE20 0.01 0.1 0.01 BRVM10 0.01 0.1 0.01 Scale2 (D2 )
TOP40 0.01 0.1 0.01 EGX30 0.01 0.1 0.01 MADEX 0.01 0.1 0.01 NGSE 0.01 0.1 0.01 NSE20 0.01 0.1 0.01 BRVM10 0.01 0.1 0.01 Scale3 (D3 )
TOP40 0.01 0.1 0.01 EGX30 0.1 0.1 0.01 MADEX 0.01 0.1 0.01 NGSE 0.01 0.1 0.01 NSE20 0.01 0.1 0.01 BRVM10 0.01 0.1 0.01 Scale4 (D4 )
TOP40 0.01 0.1 0.01 EGX30 0.01 0.1 0.01 MADEX 0.01 0.1 0.01 NGSE 0.01 0.1 0.01 NSE20 0.01 0.1 0.01 BRVM10 0.01 0.1 0.01 Scale5 (D5 )
TOP40 0.01 0.1 0.01 EGX30 0.01 0.1 0.01 MADEX 0.01 0.1 0.01 NGSE 0.01 0.1 0.01 NSE20 0.01 0.1 0.01 BRVM10 0.01 0.1 0.01 Scale6 (D6 )
TOP40 0.01 0.1 0.01 EGX30 0.01 0.1 0.01 MADEX 0.01 0.1 0.01 NGSE 0.01 0.1 0.01 NSE20 0.01 0.1 0.01 BRVM10 0.01 0.1 0.01 Scale7 (D7 )
TOP40 0.01 0.1 0.01 EGX30 0.01 0.1 0.01 MADEX 0.01 0.1 0.01 NGSE 0.01 0.1 0.01 NSE20 0.01 0.1 0.01 BRVM10 0.01 0.1 0.01 Scale7 (S7 )
TOP40 0.33 0.01 0.92 EGX30 0.53 0.01 0.99 MADEX 0.38 0.01 0.99 NGSE 0.26 0.01 0.99 NSE20 0.16 0.01 0.99 BRVM10 0.01 0.01 0.99
The analysis ofTab. 525results shows that integration varies according to the scales. The spillovers between
stock markets are weak and increase as scales increase. Note that the spillovers are down to scale 5. The results
confirm those obtained by the WMC. The WMCC showed that at scale 1, the South Africa stock market was
a potential leader or follower of other African financial markets. The scale 1 (intra-week) of the spillovers table
shows that the Egyptian market is the one that shares most of the spillovers. However, it should be noted that
the majority of the Egyptian spillovers are mainly directed towards South Africa stock exchange.
The spillovers from South Africa to other markets are higher than those of Egypt. The South African
financial market thus influences the overall African financial market more than the Egyptian financial market.
At the other scales, the Egyptian financial market is the most influential market26 at the African level but is
25
Spillovers table covering the full sample
26
The stock market that shares most of the spillovers
Tab. 5: Spillovers table of stock markets returns at different scales: January 2, 2003 - August 17, 2016
Scale 1 South Africa Egypt Morocco Nigeria Kenya WAEMU From others South Africa 93.26 5.66 0.13 0.20 0.62 0.13 6.74 Egypt 1.91 97.51 0.28 0.08 0.17 0.06 2.49 Morocco 1.35 1.09 95.62 1.13 0.45 0.36 4.38 Nigeria 0.14 0.21 0.28 98.84 0.33 0.21 1.16 Kenya 0.65 0.07 0.15 0.11 98.60 0.43 1.40 WAEMU 0.42 0.57 0.62 0.36 1.17 96.86 3.14 To others 4.46 7.59 1.45 1.88 2.75 1.19 Total Spillovers= 19.32 Scale 2 South Africa Egypt Morocco Nigeria Kenya WAEMU From others South Africa 93.40 4.77 1.08 0.64 0.10 0.01 6.60 Egypt 3.36 93.97 0.51 0.57 1.45 0.13 6.03 Morocco 2.23 2.59 93.69 0.43 0.52 0.54 6.31 Nigeria 1.31 3.15 0.70 92.84 1.31 0.70 7.16 Kenya 0.38 4.30 0.30 1.56 92.26 1.20 7.74 WAEMU 0.21 0.32 0.86 1.77 0.53 96.32 3.68 To others 7.49 15.13 3.45 4.96 3.90 2.58 Total Spillovers= 37.51 Scale 3 South Africa Egypt Morocco Nigeria Kenya WAEMU From others South Africa 78.91 16.34 2.46 1.33 0.44 0.52 21.09 Egypt 22.08 72.22 1.95 2.24 1.36 0.15 27.78 Morocco 5.22 6.87 84.31 1.85 1.17 0.59 15.69 Nigeria 5.25 6.06 1.57 82.30 0.25 4.57 17.70 Kenya 2.56 4.77 3.35 0.25 86.20 2.88 13.80 WAEMU 0.71 0.02 1.64 4.12 4.73 88.78 11.22 To others 35.82 34.05 10.96 9.79 7.95 8.71 Total Spillovers= 107.28 Scale 4 South Africa Egypt Morocco Nigeria Kenya WAEMU From others South Africa 62.98 18.92 12.37 0.56 4.76 0.41 37.02 Egypt 17.56 74.15 1.43 1.11 3.19 2.56 25.85 Morocco 3.13 5.56 74.30 4.55 2.95 9.51 25.70 Nigeria 6.87 2.28 0.31 88.80 1.73 0.00 11.20 Kenya 21.41 14.51 1.75 2.25 57.66 2.42 42.34 WAEMU 0.09 1.42 1.87 0.13 4.03 92.45 7.55 To others 49.06 42.70 17.74 8.59 16.67 14.90 Total Spillovers= 149.66 Scale 5 South Africa Egypt Morocco Nigeria Kenya WAEMU From others South Africa 78.30 13.98 2.38 1.60 3.69 0.05 21.70 Egypt 10.03 83.68 0.61 4.04 1.53 0.11 16.32 Morocco 5.42 3.49 77.35 3.31 0.02 10.40 22.65 Nigeria 7.20 12.03 0.51 78.52 1.67 0.07 21.48 Kenya 8.58 14.45 0.08 2.73 73.92 0.24 26.08 WAEMU 0.64 1.22 3.08 0.04 2.55 92.47 7.53 To others 31.87 45.17 6.66 11.72 9.46 10.87 Total Spillovers= 115.75 Scale 6 South Africa Egypt Morocco Nigeria Kenya WAEMU From others South Africa 70.70 20.41 0.44 1.01 7.16 0.27 29.30 Egypt 11.28 75.61 1.60 1.21 10.09 0.21 24.39 Morocco 1.25 9.93 81.99 0.03 1.10 5.70 18.01 Nigeria 2.67 11.38 0.00 81.14 3.81 1.00 18.86 Kenya 5.02 22.63 0.10 7.33 64.86 0.06 35.14 WAEMU 3.01 4.44 0.83 4.32 1.29 86.11 13.89 To others 23.22 68.79 2.98 13.91 23.46 7.24 Total Spillovers= 139.59 Scale 7 South Africa Egypt Morocco Nigeria Kenya WAEMU From others South Africa 68.69 16.41 1.22 0.22 9.31 4.15 31.31 Egypt 4.93 71.14 4.89 3.60 13.95 1.49 28.86 Morocco 2.17 34.63 50.21 0.33 11.67 0.99 49.79 Nigeria 0.76 8.54 0.74 84.21 5.10 0.66 15.79 Kenya 4.59 31.76 3.85 3.05 56.73 0.02 43.27 WAEMU 7.73 13.72 1.40 3.22 0.01 73.92 26.08 To others 20.18 105.06 12.10 10.41 40.03 7.31 Total Spillovers= 195.10
not the most open27. At almost all scales, the Kenyan market is the most open financial market. The WAEMU
has the least open and least influential financial market of the sample.
For a more focused analysis of the stock market integration, we will subdivide our study period into 4
sub-periods. The first (2003-2007) takes into account the period before the U.S financial crisis (seeTab. 6)
The second (2007-2010) covers the period of the American financial crisis (seeTab. 7). The third (2010-2012)
covers the period of European debt crisis (seeTab. 8). Finally, the fourth (2012-2016) and last period covers a
period of strong growth in African financial markets, but also a period of increasing measures to integrate these
markets (seeTab. 9). The period before the U.S financial crisis will serve as a basis for comparison. It will show
whether spillovers at different scales between financial markets have increased over time.
The analysis ofTab. 6,Tab. 7,Tab. 8andTab. 9showed that spillovers between stock markets are generally
high in times of financial crisis.
During the U.S financial crisis, the spillovers between African stock markets peaked. The U.S financial crisis
27
The stock market that receives most of the spillovers
Tab. 6: Spillovers table of stock markets returns at different scales: January 6, 2003 - April 26, 2007
Scale 1 South Africa Egypt Morocco Nigeria Kenya WAEMU From others South Africa 92.87 3.21 0.85 2.46 0.01 0.60 7.13 Egypt 0.83 96.57 1.31 0.22 0.41 0.66 3.43 Morocco 2.25 3.68 90.30 1.19 1.32 1.26 9.70 Nigeria 0.92 1.75 2.67 94.39 0.07 0.20 5.61 Kenya 0.10 0.59 0.61 0.09 97.05 1.55 2.95 WAEMU 2.19 7.73 2.54 1.13 0.32 86.09 13.91 To others 6.29 16.97 7.99 5.08 2.12 4.28 Total Spillovers= 42.73 Scale 2 South Africa Egypt Morocco Nigeria Kenya WAEMU From others South Africa 93.39 3.43 1.69 0.19 0.62 0.69 6.61 Egypt 0.96 95.07 0.86 1.29 0.17 1.64 4.93 Morocco 3.93 5.75 85.13 1.20 0.87 3.13 14.87 Nigeria 0.27 9.42 0.46 81.73 4.47 3.64 18.27 Kenya 0.82 0.80 0.10 2.59 92.42 3.27 7.58 WAEMU 1.04 2.95 4.61 3.83 0.94 86.64 13.36 To others 7.02 22.36 7.72 9.09 7.06 12.37 Total Spillovers= 65.63 Scale 3 South Africa Egypt Morocco Nigeria Kenya WAEMU From others South Africa 78.47 3.99 3.95 5.33 7.91 0.35 21.53 Egypt 12.18 81.33 2.20 1.88 2.09 0.33 18.67 Morocco 13.51 3.71 77.67 1.03 2.57 1.51 22.33 Nigeria 0.82 16.85 0.09 81.63 0.49 0.12 18.37 Kenya 0.84 1.75 10.08 0.24 85.03 2.07 14.97 WAEMU 0.41 1.76 2.30 0.42 5.98 89.13 10.87 To others 27.75 28.06 18.61 8.90 19.04 4.39 Total Spillovers= 106.74 Scale 4 South Africa Egypt Morocco Nigeria Kenya WAEMU From others South Africa 60.98 26.44 10.92 0.12 0.87 0.67 39.02 Egypt 11.03 72.32 3.64 0.00 12.08 0.93 27.68 Morocco 20.64 7.91 48.69 0.97 4.33 17.47 51.31 Nigeria 10.43 0.30 4.21 69.46 8.25 7.35 30.54 Kenya 4.87 10.35 10.47 6.04 64.78 3.49 35.22 WAEMU 1.39 1.38 3.67 9.42 14.69 69.45 30.55 To others 48.36 46.38 32.91 16.54 40.22 29.91 Total Spillovers= 214.32 Scale 5 South Africa Egypt Morocco Nigeria Kenya WAEMU From others South Africa 54.82 18.53 12.14 0.67 9.39 4.45 45.18 Egypt 3.35 75.69 1.44 2.27 3.64 13.62 24.31 Morocco 17.68 12.03 52.63 1.63 0.73 15.30 47.37 Nigeria 1.93 12.63 3.62 78.95 1.58 1.30 21.05 Kenya 1.44 14.76 0.69 2.44 79.64 1.03 20.36 WAEMU 0.95 11.56 3.16 1.09 0.36 82.88 17.12 To others 25.34 69.50 21.05 8.10 15.71 35.70 Total Spillovers= 175.40 Scale 6 South Africa Egypt Morocco Nigeria Kenya WAEMU From others South Africa 74.60 13.22 6.67 3.33 0.85 1.34 25.40 Egypt 6.50 52.43 12.48 10.98 8.89 8.71 47.57 Morocco 4.40 36.20 43.72 8.04 1.04 6.60 56.28 Nigeria 0.46 12.60 3.13 66.05 10.76 7.01 33.95 Kenya 0.05 5.21 0.45 25.50 67.86 0.92 32.14 WAEMU 0.03 8.22 0.89 5.34 0.29 85.23 14.77 To others 11.44 75.45 23.63 53.18 21.83 24.59 Total Spillovers= 210.12 Scale 7 South Africa Egypt Morocco Nigeria Kenya WAEMU From others South Africa 32.54 45.29 1.16 1.41 18.05 1.56 67.46 Egypt 28.08 49.48 0.29 3.86 14.61 3.68 50.52 Morocco 1.24 0.95 28.81 44.15 1.85 23.01 71.19 Nigeria 4.09 9.12 11.51 45.97 0.18 29.13 54.03 Kenya 25.76 35.18 1.25 0.73 34.93 2.16 65.07 WAEMU 4.44 11.29 6.47 36.17 0.32 41.31 58.69 To others 63.61 101.83 20.68 86.31 35.00 59.54 Total Spillovers= 366.97
is characterized by a general increase in relations between the African financial markets. Indeed, the African
financial markets having been weakly affected by the crisis have surely increased exchanges between them.
The most influential markets are the South African (intra-week to week and monthly) and Kenyan (quarterly
to bi-annual scales) stock markets. Concerning the most open markets, Morroco has is the most open stock
market at large scales (monthly to bi-annual). At small and medium scales, the most open financial markets
vary according to them (seeTab. 7) . However, it should be noted, that the WAEMU market is the most open
at scale 2.
The period of the European debt crisis is also characterized by an increase in the spillovers between the
stock markets. However, it is not as strong as those of the U.S financial crisis. Across all scales, we are seeing
that the Kenyan stock market is the most open market of our panel on monthly and bi-annual scales. The
opening of the stock markets differs according to the scale (see Tab. 8). From the intra-week to the monthly
scale, Morocco has the least influential stock market. During this crisis, we note that the South African stock
Tab. 7: Spillovers table of stock markets returns at different scales: May 2, 2007 - January 4, 2010
Scale 1 South Africa Egypt Morocco Nigeria Kenya WAEMU From others South Africa 87.29 8.92 0.79 0.89 1.70 0.42 12.71 Egypt 6.29 92.74 0.16 0.26 0.51 0.04 7.26 MADEX 6.39 1.54 89.65 0.67 0.23 1.52 10.35 Nigeria 1.45 1.52 0.98 94.28 0.43 1.35 5.72 Kenya 3.58 0.57 0.76 1.09 92.01 1.98 7.99 WAEMU 0.19 1.34 1.70 0.06 6.60 90.11 9.89 To others 17.90 13.89 4.38 2.97 9.47 5.32 Total Spillovers= 52.93 Scale 2 South Africa Egypt Morocco Nigeria Kenya WAEMU From others South Africa 86.98 4.72 4.07 2.43 1.20 0.60 13.02 Egypt 4.77 86.44 1.29 2.32 4.41 0.76 13.56 MADEX 5.85 4.22 87.13 0.98 1.18 0.63 12.87 Nigeria 2.57 1.93 0.54 92.22 0.94 1.80 7.78 Kenya 2.50 9.86 1.01 0.08 86.15 0.39 13.85 WAEMU 11.61 6.41 1.37 0.47 3.36 76.78 23.22 To others 27.30 27.14 8.28 6.29 11.09 4.18 Total Spillovers= 84.29 Scale 3 South Africa Egypt Morocco Nigeria Kenya WAEMU From others South Africa 58.95 21.59 5.33 9.06 1.95 3.12 41.05 Egypt 31.16 56.09 4.27 3.90 2.70 1.88 43.91 MADEX 7.41 12.82 65.86 7.97 2.33 3.61 34.14 Nigeria 2.64 1.50 5.11 74.89 5.58 10.28 25.11 Kenya 2.57 6.33 2.43 12.47 69.18 7.03 30.82 WAEMU 5.50 7.62 2.41 10.90 14.41 59.17 40.83 To others 49.28 49.85 19.54 44.29 26.97 25.92 Total Spillovers= 215.85 Scale 4 South Africa Egypt Morocco Nigeria Kenya WAEMU From others South Africa 47.54 16.84 18.16 1.99 2.21 13.25 52.46 Egypt 21.77 58.84 8.48 3.63 7.14 0.13 41.16 MADEX 12.53 2.34 59.39 5.29 10.94 9.52 40.61 Nigeria 15.38 9.78 0.26 66.52 5.74 2.31 33.48 Kenya 23.42 9.66 1.37 29.86 34.19 1.49 65.81 WAEMU 24.77 5.35 6.33 7.33 0.80 55.42 44.58 To others 97.87 43.98 34.61 48.10 26.83 26.71 Total Spillovers= 278.09 Scale 5 South Africa Egypt Morocco Nigeria Kenya WAEMU From others South Africa 56.53 5.20 17.88 1.29 10.22 8.88 43.47 Egypt 29.08 44.06 3.61 7.25 1.72 14.28 55.94 MADEX 23.48 9.85 37.90 1.06 17.81 9.90 62.10 Nigeria 1.20 3.88 0.31 68.32 14.67 11.63 31.68 Kenya 16.82 9.02 5.34 5.74 59.72 3.36 40.28 WAEMU 11.09 19.65 10.60 9.85 0.84 47.97 52.03 To others 81.68 47.59 37.74 25.19 45.26 48.04 Total Spillovers= 285.50 Scale 6 South Africa Egypt Morocco Nigeria Kenya WAEMU From others South Africa 69.18 1.95 2.49 0.54 20.93 4.91 30.82 Egypt 1.96 55.90 6.09 10.29 22.33 3.44 44.10 MADEX 13.23 0.43 47.83 23.85 7.10 7.56 52.17 Nigeria 2.67 1.16 28.87 57.20 9.06 1.03 42.80 Kenya 10.74 7.11 11.54 7.67 61.54 1.39 38.46 WAEMU 11.38 11.59 2.56 3.03 22.59 48.85 51.15 To others 39.98 22.24 51.54 45.39 82.01 18.33 Total Spillovers= 259.5 Scale 7 South Africa Egypt Morocco Nigeria Kenya WAEMU From others South Africa 53.77 4.32 2.01 35.18 1.89 2.83 46.23 Egypt 4.81 41.88 19.14 11.62 22.50 0.04 58.12 MADEX 3.63 36.59 21.75 14.24 23.71 0.07 78.25 Nigeria 2.30 21.15 11.91 41.37 22.98 0.30 58.63 Kenya 0.84 21.96 12.11 20.44 38.44 6.21 61.56 WAEMU 0.48 0.42 0.09 6.35 42.74 49.93 50.07 To others 12.06 84.43 45.26 87.84 113.83 9.44 Total Spillovers= 352.86
market becomes one of the least open markets and is even the least influential at scale 7 (bi-annual). According
to Sugimoto et al.(2014) the spillovers from European stock markets to Africa stock markets increased. This
could explain the lack of spillovers between the South African market and the other African stock markets.
Indeed the South African stock exchange being attractive, it could have been a solid opportunity to diversify
capital for European stock markets.
Concerning the latter period28(see Tab. 9), across all scales the spillovers are smaller than those in times
of crisis. In comparison with the pre-crisis period, we find that at allmost all scales, the spillovers are falling
excepted at scales 3 and 5 (respectively fortnightly and monthly to quarterly). Nigeria and Egypt have the least
open stock markets. However, we found that the influence of the Nigerian stock market relative to the pre-crisis
period (see Tab. 6) increased significantly at scales 3 to 5. Across almost all scales, the Egypt’s stock market
remains the most influential. In addition, at scale 7, the WAEMU stock market becomes the most influential,
28
strong stock markets development and increased openness measures
Tab. 8: Spillovers table of stock markets returns at different scales: January 5, 2010 - December 31, 2012
Scale 1 South Africa Egypt Morocco Nigeria Kenya WAEMU From others South Africa 92.04 4.24 1.00 0.95 0.96 0.80 7.96 Egypt 3.36 95.32 0.03 0.94 0.34 0.01 4.68 MADEX 1.25 0.52 88.48 5.14 4.39 0.22 11.52 Nigeria 1.74 1.48 0.35 89.73 4.07 2.63 10.27 Kenya 0.55 1.15 2.15 7.20 85.80 3.15 14.20 WAEMU 0.97 0.24 0.03 0.79 0.94 97.03 2.97 To others 7.87 7.64 3.56 15.02 10.70 6.82 Total Spillovers= 51.60 Scale 2 South Africa Egypt Morocco Nigeria Kenya WAEMU From others South Africa 90.46 5.67 0.10 2.61 0.59 0.57 9.54 Egypt 4.94 86.51 1.06 2.02 5.14 0.32 13.49 MADEX 0.47 2.17 94.91 1.97 0.16 0.32 5.09 Nigeria 4.81 2.41 2.36 85.40 4.92 0.11 14.60 Kenya 1.68 10.76 0.02 9.79 74.34 3.40 25.66 WAEMU 0.28 0.71 0.28 0.13 4.19 94.41 5.59 To others 12.18 21.72 3.81 16.52 15.01 4.72 Total Spillovers= 73.95 Scale 3 South Africa Egypt Morocco Nigeria Kenya WAEMU From others South Africa 65.22 17.33 1.12 1.91 12.82 1.60 34.78 Egypt 8.91 80.81 1.26 2.49 4.31 2.22 19.19 MADEX 3.47 13.30 73.16 3.13 0.16 6.77 26.84 Nigeria 0.76 7.99 3.59 75.37 8.48 3.81 24.63 Kenya 16.38 17.44 0.27 14.58 51.00 0.33 49.00 WAEMU 1.66 7.08 4.34 8.94 0.39 77.59 22.41 To others 31.18 63.14 10.58 31.05 26.16 14.74 Total Spillovers= 176.84 Scale 4 South Africa Egypt Morocco Nigeria Kenya WAEMU From others South Africa 61.50 12.28 2.34 11.72 3.96 8.20 38.50 Egypt 12.57 70.87 1.08 3.47 4.58 7.43 29.13 MADEX 0.98 34.65 55.66 3.53 4.43 0.76 44.34 Nigeria 3.28 26.08 0.83 63.24 5.45 1.12 36.76 Kenya 16.57 36.30 0.83 4.55 34.65 7.10 65.35 WAEMU 7.62 12.05 1.67 1.06 4.94 72.66 27.34 To others 41.01 121.36 6.76 24.33 23.36 24.61 Total Spillovers= 241.42 Scale 5 South Africa Egypt Morocco Nigeria Kenya WAEMU From others South Africa 81.46 4.17 0.90 8.88 3.66 0.93 18.54 Egypt 7.97 72.08 2.17 8.97 4.93 3.88 27.92 MADEX 6.28 27.56 48.30 9.54 2.91 5.41 51.70 Nigeria 4.09 19.89 2.30 41.10 30.30 2.32 58.90 Kenya 9.09 16.96 1.10 11.85 57.70 3.29 42.30 WAEMU 5.27 1.85 13.56 3.06 16.25 60.00 40.00 To others 32.70 70.44 20.03 42.30 58.05 15.82 Total Spillovers= 239.35 Scale 6 South Africa Egypt Morocco Nigeria Kenya WAEMU From others South Africa 78.67 0.50 11.74 8.09 0.43 0.57 21.33 Egypt 2.38 73.14 0.53 14.93 7.22 1.80 26.86 MADEX 1.45 2.01 70.23 14.44 1.18 10.70 29.77 Nigeria 8.19 18.49 15.32 46.68 4.28 7.03 53.32 Kenya 2.00 37.01 0.23 18.97 39.33 2.47 60.67 WAEMU 3.23 1.24 23.53 22.45 0.50 49.06 50.94 To others 17.26 59.24 51.35 78.88 13.60 22.57 Total Spillovers= 242.90 Scale 7 South Africa Egypt Morocco Nigeria Kenya WAEMU From others South Africa 30.33 62.21 2.72 0.75 1.25 2.75 69.67 Egypt 2.94 90.36 1.25 4.38 0.13 0.93 9.64 MADEX 0.54 0.14 55.43 40.12 2.18 1.59 44.57 Nigeria 0.34 12.36 12.76 57.20 9.99 7.35 42.80 Kenya 0.02 0.15 8.36 3.65 60.94 26.88 39.06 WAEMU 0.62 1.37 0.23 4.57 42.10 51.12 48.88 To others 4.46 76.22 25.31 53.46 55.65 39.50 Total Spillovers= 254.62
confirming the recent growth of the BRVM29.
Finally, we note that the spillovers at different scales between the financial markets vary according to the
economic and financial environment. The relationship between African financial markets increases in times of
crisis, thus confirming a contagion phenomenon during these periods of instability (see Forbes and Rigobon,
2002;McAleer and Nam,2005). The comparison of the sub-periods from 2003-2007 and from 2012-2016 showed
that the spillovers between African financial markets at almost all scales have declined in recent years. This
implies that despite the reforms, the African stock markets integration tends to decline confirming the results
of Collins and Biekpe (2003b) (see Section 2. These low spillovers are understandable. In recent years, the
African stock markets have increased the openness measures both among themselves and with the outside (see
ASEA,2015). These low spillovers could result from an increase in trade with the outside30rather than between
them. However, we are seeing some progress. At the 3rd and 5th scales (respectively fortnightly and monthly
29
www.african-markets.com
30
world financial markets are more attractive and politically stable
Tab. 9: Spillovers table of stock markets returns at different scales: January 2, 2012 - August 17, 2016
Scale 1 South Africa Egypt Morocco Nigeria Kenya WAEMU From others South Africa 87.40 8.32 0.94 2.26 0.41 0.66 12.60 Egypt 2.28 92.49 0.17 4.69 0.08 0.29 7.51 MADEX 1.07 4.07 93.92 0.18 0.66 0.11 6.08 Nigeria 0.62 2.14 0.06 95.77 0.24 1.16 4.23 Kenya 0.92 0.16 0.57 0.41 93.99 3.95 6.01 WAEMU 1.09 2.04 0.05 1.57 0.97 94.29 5.71 To others 5.98 16.73 1.79 9.11 2.37 6.17 Total Spillovers= 42.15 Scale 2 South Africa Egypt Morocco Nigeria Kenya WAEMU From others South Africa 86.49 8.33 0.92 3.50 0.61 0.16 13.51 Egypt 5.59 89.83 0.47 3.48 0.14 0.50 10.17 MADEX 2.39 1.10 93.57 1.26 0.82 0.86 6.43 Nigeria 5.51 4.95 0.35 87.25 0.64 1.31 12.75 Kenya 2.77 2.84 1.51 2.53 90.31 0.03 9.69 WAEMU 1.64 0.67 0.60 3.44 0.05 93.60 6.40 To others 17.90 17.89 3.84 14.22 2.26 2.85 Total Spillovers= 58.96 Scale 3 South Africa Egypt Morocco Nigeria Kenya WAEMU From others South Africa 68.98 18.25 2.61 4.28 4.84 1.05 31.02 Egypt 11.71 68.26 0.03 8.00 10.99 1.01 31.74 MADEX 1.48 9.26 77.63 10.32 0.55 0.76 22.37 Nigeria 6.61 10.77 0.32 74.73 2.47 5.09 25.27 Kenya 21.65 24.68 0.60 9.62 43.38 0.07 56.62 WAEMU 1.95 4.75 0.39 7.50 0.79 84.62 15.38 To others 43.40 67.72 3.94 39.73 19.63 7.99 Total Spillovers= 182.40 Scale 4 South Africa Egypt Morocco Nigeria Kenya WAEMU From others South Africa 73.40 6.26 9.80 6.74 1.52 2.28 26.60 Egypt 8.10 80.05 0.46 0.60 9.50 1.29 19.95 MADEX 2.17 2.55 80.44 6.62 0.16 8.06 19.56 Nigeria 4.96 4.20 4.90 84.68 0.33 0.94 15.32 Kenya 28.40 2.11 0.11 11.03 57.27 1.07 42.73 WAEMU 1.62 5.52 0.95 4.28 10.94 76.70 23.30 To others 45.25 20.64 16.22 29.27 22.46 13.64 Total Spillovers= 147.47 Scale 5 South Africa Egypt Morocco Nigeria Kenya WAEMU From others South Africa 72.94 16.86 0.08 4.98 2.88 2.26 27.06 Egypt 2.21 84.69 5.77 0.06 2.14 5.13 15.31 MADEX 0.54 12.48 75.19 5.13 0.79 5.87 24.81 Nigeria 5.73 1.04 4.09 75.32 12.02 1.80 24.68 Kenya 6.09 0.35 3.19 22.73 64.95 2.68 35.05 WAEMU 16.56 15.91 0.29 12.10 7.99 47.15 52.85 To others 31.13 46.64 13.42 45.00 25.82 17.74 Total Spillovers= 179.76 Scale 6 South Africa Egypt Morocco Nigeria Kenya WAEMU From others South Africa 79.36 6.92 0.01 9.01 3.75 0.95 20.64 Egypt 5.77 87.41 0.44 0.17 3.82 2.39 12.59 MADEX 0.90 6.02 56.59 25.76 6.66 4.07 43.41 Nigeria 5.70 0.20 4.84 81.14 0.00 8.11 18.86 Kenya 0.82 42.55 9.26 0.30 45.54 1.52 54.46 WAEMU 5.14 2.74 6.04 21.38 2.27 62.43 37.57 To others 18.32 58.42 20.59 56.63 16.51 17.04 Total Spillovers= 187.52 Scale 7 South Africa Egypt Morocco Nigeria Kenya WAEMU From others South Africa 57.20 1.70 10.17 3.87 23.99 3.06 42.80 Egypt 0.39 43.58 4.07 13.35 5.30 33.31 56.42 MADEX 18.98 11.74 24.15 0.23 19.92 24.97 75.85 Nigeria 9.47 10.95 0.66 72.00 2.08 4.84 28.00 Kenya 27.24 4.55 7.80 5.68 41.99 12.73 58.01 WAEMU 1.75 24.92 7.77 7.56 8.55 49.44 50.56 To others 57.84 53.87 30.48 30.71 59.83 78.92 Total Spillovers=311.64
to quarterly) of the last period, spillovers between African stock markets have increased compared to those of
the pre-crisis period (seeTab. 9). This means that integration between African financial markets although weak
is rising on fortnightly and quarterly to monthly scales. The financial information is faster than before between
African financial markets. This implies an improvement in the transmission channels (development of financial
institutions) between African financial markets.
5
Conclusion
This paper examines the relationships between the 6 largest African stock markets (South Africa, Egypt,
Morocco, Nigeria, Kenya, and WAEMU) at different timescales. In particular, we want to see whether the
numerous measures and reforms put in place for a better integration of these financial markets have been
effective.First, we used the Wavelet Multiple Correlation (WMC) and the Wavelet Multiple Cross-Correlation
(WMCC) proposed by Fern´andez-Macho(2012) to measure the level of integration between the six African
stock markets at seven timescales. Then, we used the Diebold and Yilmaz (2012) spillovers index on the 7
timescales to more precisely determine the relationships between these financial markets.
The results show that African stock markets are weakly integrated. However, this low integration almost
located at small timescales (intra-week to monthly) tends to grow at large (bi-annual) time scales. Across
all scales, with the exception of the intra-week scale or it is the South African stock market, the Egyptian
stock market is the potential leader or follower of other African markets. At the bi-annual scale, the Egyptian
market is indeed a follower of other markets, which lags the others stock markets. The crisis periods (the US
financial crisis and the European debt crisis) are characterized by an increase of spillovers between African
financial markets. The highest spillovers are localized during the U.S financial crisis confirming the contagion
between financial markets in times of financial crisis (seeForbes and Rigobon,2002;McAleer and Nam,2005).
In contrast, the spillovers between African financial markets have been declining in recent years at almost all
scales except at scales 3 and 5 (fortnightly and monthly to quarterly) where they increase.
We can conclude that despite all the reforms of recent years for better integration, African stock markets
are far from being integrated. We are seeing a decline in relationships between African stock markets in recent
years. However, it should be noted that increased spillovers at medium scales (fortnightly and monthly to
quarterly) could mean a slight improvement in the transmission of financial information and hence of African
financial institutions.
However, this decline in integration despite a slightly faster financial flow seems logical. This can be explained
by the fact that African stock markets have become viable ways of diversifying capital for world financial
markets (see Raleigh, 2014). Financial exchanges with the outside world may have been increased to the
detriment of regional exchanges. This very weak integration of African stock markets offers great opportunities
for diversification mostly at small scales.
Findings from this paper are relevant for diversification strategies and policy makers. The competent
au-thorities should, therefore, make further efforts in the stock markets integration, but also better promote trade
between African stock exchanges.
References
Adjasi, C.K.D., Biekpe, N.B. (2006) Co integration and Dynamic Causal Links amongst African Stock Markets,
Investment Management and Financial Innovations, 4: 102-119.
Agyei-Ampomah, S. (2008) An Empirical Examination of the Inter-Linkages between African Stock Markets.
Aloui, C., Hkiri, B. (2014) Co-movements of GCC emerging stock markets: New evidence from wavelet coherence
analysis, Economic Modelling, 36: 421-431.
Economic Commission for Africa (2008) Vers l’int´egration montaire et financi`ere en Afrique, Assessing Regional
Integration in Africa ARIA III.
Economic Commission for Africa (2012) Towards an African Continental Free Trade Area, Assessing Regional
Integration in Africa ARIA V,.
African Securities Exchanges Association YearBook (2012).
African Securities Exchanges Association (2015) Annual Report & Statistics.
Bagehot, W. (1873) Lombard Street, Homewood, IL, Richard D. Irwin, 1962 Edition.
Barari, M (2004) Equity market integration in Latin America: A time-varying integration score analysis,
Inter-national Review of Financial Analysis, 13(5): 649-668.
Boamah, N.A. (2013) Global Integration of African Stock Markets, Available at SSRN 2313538.
Candelon, B., Hecq, A., Verschoor, W. (2005) Measuring common cyclical features during financial turmoil:
evidence of interdependence not contagion”, Journal of International Money and Finance, 24: 1317-1334.
Collins, D., Biekpe, N. (2003). Contagion and interdependence in African stock markets. South African Journal
of Economics, 71: 181-194.
Collins, D., Biekpe, N. (2003) Contagion: a fear for African equity markets?, Journal of Economics and Business,
55: 285-297.
Diebold, F. X., Yilmaz, K. (2009) Measuring financial asset return and volatility spillovers, with application to
global equity markets, The Economic Journal , 119: 158-171.
Diebold, F.X., Yilmaz, K. (2012) Better to give than to receive: Predictive directional measurement of volatility
spillovers, International Journal of Forecasting, 28: 57-66.
Engle, R.F., Granger, C.W.J. (1987) Co-integration and error correction: representation, estimation, and
test-ing, Econometrica: journal of the Econometric Society, 251-276.
Fern´andez-Macho, J. (2012) Wavelet multiple correlation and cross-correlation: A multiscale analysis of
Euro-zone stock markets, Physica A: Statistical Mechanics and its Applications, 391: 1097-1104.
Fish, T., Biekpe, N. (2002) Regional African stock markets indices, S. Afr. J. Bus. Manage, 33(1).
Forbes, K.J., Rigobon, R. (2002) No contagion, only interdependence: measuring stock market co-movements,
The Journal of Finance, 57: 2223-2261.
Fowowe, B., Shuaibu, M. (2016) Dynamic spillovers between Nigerian, South African and international equity
markets, International Economics, 148: 59-80
Gallegati, M. (2005) A wavelet analysis of MENA stock markets, Department of economics.
Graham, M., Kiviaho, J., Nikkinen, J. (2012) Integration of 22 emerging stock markets: a three-dimensional
analysis, Global Finance Journal, 23: 34-47
Graham, M., Kiviaho, J., Nikkinen, J., Omran, M. (2013) Global and regional co-movement of the MENA stock
markets, Journal of Economics and Business, 65: 86-100.
Graham, M., Nikkinen, J. (2011) Co-movement of the Finnish and international stock markets: a wavelet
analysis, The European Journal of Finance, 17: 409-425.
Hicks, J.R. (1969) A theory of economic history. OUP Catalogue.
Irving, M. J. (2005) Regional Integration of Stock Exchanges in Eastern and Southern Africa: Progress and
Prospects (EPub), No. 5-122. International Monetary Fund
Koop, G., Pesaran, M.H., Potter, S.M. (1996) Impulse response analysis in nonlinear multivariate models,
Journal of Econometrics, 74: 119-147.
Levine, R. (1997) Financial development and economic growth: views and agenda, Journal of economic
litera-ture, 688-726.
Loh, L. (2013) Co-movement of Asia-Pacific with European and US stock market returns: A cross-time-frequency
analysis, Research in International Business and Finance, 29: 1-13.
Lugangwa, E. (2012) Regional African Stock Exchanges on Agenda.
Madaleno, M., Pinho, C. (2012) International stock market indices comovements: a new look, International
Journal of Finance & Economics, 17: 89-102.
Mallat, S., (1999) A Wavelet Tour of Signal Processing, Academic press.
McAleer, M., Nam, J.C.W. (2005) Testing for contagion in ASEAN exchange rates, Mathematics and Computers
in Simulation, 68:517-525.
Percival, D.B., Walden, A.T. (2000) Wavelet Methods for Time Series Analysis, Cambridge University Press,
Cambridge, England.
Pesaran, H.H., Shin, Y. (1998) Generalized impulse response analysis in linear multivariate models, Economics
letters, 58: 17-29.
PricewaterhouseCoopers (PwC) (2015) Africa Capital Markets Watch.
Raleigh, P. (2014) L’Afrique note : le rˆole de la notation dans le d´eveloppement des march´es financiers africains,
Revue d’Economie Financire: 116.
Rua, A., Nunes, L.C. (2009) International comovement of stock market returns: A wavelet analysis, Journal of
Empirical Finance, 16: 632-639.
Schumpeter, J. (1912) The Economic Theory of Development.
Sugimoto, K., Matsuki, T., Yoshida, Y. (2014) The global financial crisis: An analysis of the spillover effects
on African stock markets, Emerging Markets Review, 21: 201-233.
Tiwari, A.K., Dar, A.B., Bhanja, N., Shah, A. (2013) Stock market integration in Asian countries: Evidence
from wavelet multiple correlations, Journal of Economic Integration, 28: 441-456.
Economic Development in Africa Report (2014) CATALYSING INVESTMENT FOR TRANSFORMATIVE
GROWTH IN AFRICA, United Nations publication, UNCTAD/ALDC/AFRICA/2014, New York and
Geneva.
Wang, Z., Yang, J., Bessler, D.A. (2003) Financial crisis and African stock market integration, Applied
Eco-nomics Letters, 10: 527-533.
Whitcher B.J., Guttorp P., Percival D.B. (2000) Wavelet Analysis of Covariance with Application to
Atmo-spheric Time Series, Journal of Geophysical Research, 105 (D11): 941962.