J.
Range Manage.
55: 80-87 January 2002
Salinity affects development, growth, and photosynthesis in cheatg rass
KAYLIE E. RASMUSON AND JAY E. ANDERSON
Authors are Plant Ecologist, Bechtel SAIC Comapny, LLC, Las Vegas, Nev. 89144, and Professor, Department
of
Biological Sciences, Idaho State University, Pocatello, Ida. 83209-8007. At the time of the research, the senior author was a Ph.D. student, Department of Biological Sciences, Idaho State University, Pocatello, Ida.Abstract
The effects of salt stress on growth and development of cheat- grass (Bromus tectorum L.) were investigated in
2greenhouse studies. The first study assessed developmental and physiological responses of this grass to
4salinity levels. Salinity stunted growth through reduced leaf initiation and expansion, and reduced pho- tosynthetic rates. Reduction of photosynthetic rates appeared to be primarily due to stomatal limitation. Salinity also reduced carbon isotope discrimination, indicating long-term effects on conductance and carbon gain. Root growth was severely inhibit- ed by high salinity, resulting in a shift in the root to shoot alloca- tion pattern. The second study investigated growth patterns of cheatgrass in relation to intraspecific variation in salt tolerance using plants grown from seeds collected at non-saline and saline sites. Salinity reduced growth of plants from both environments.
However, plants from the saline site accumulated leaf and root area at nearly twice the rate as those from the non-saline site, even in the control group. Because plants were grown in a com- mon environment, growth differences between populations were genetically based. Thus, the potential for rapid growth may enable plants from the saline site to rely on shallow, less saline moisture reserves available early in the growing season.
Key Words: biomass partitioning, Bromus tectorum, intraspecific variation, developmental response, root growth, photosynthetic rates, population differences, salt stress, stomatal conductance
Resumen
Mediante
2estudios en invernadero
seinvestigaron
losefectos del estres por salinidad en el desarrollo
ycrecimiento del
"Cheatgrass" (Bromus tectorum L.). El primer estudio evaluo
eldesarrollo
yla respuesta fisiologica de este zacate a
4niveles de salinidad. La salinidad suprimio
elcrecimiento a reducir la ini- ciacion
yexpansion de las hojas
ytasas fotosinteticas. La reduc- cion de las tasas fotosinteticas parece ser principalmente debido a una limitacion estomatica. La salinidad tambien redujo la
dis-criminacion del isotopo de carbon, indicando efectos a largo plazo en la conduccion
yganancia de carbon. El crecimiento de la raiz fue severamente inhibido por la alta salinidad, resultando en un patron de asignacion desviado de la raiz a
lostallos. En
elsegundo estudio
seinvestigaron
lospatrones de crecimiento del
"Cheatgrass" en relacion a la variation intrespecifica a la toler- ancia a sales, utilizando para
elloplantas desarrolladas a partir de semillas colectadas en sitios salinos
yno salinos. La salinidad redujo
elcrecimiento de las plantas de ambos ambientes. Sin embargo, las plantas del sitio salino acumularon
elarea foliar
yradical a una tasa casi del doble que las plantas provenientes del sitio no salino, aun en
elgrupo control. Porque las plantas
se cul-tivaron en un ambiente comun, las diferencias de crecimiento entre poblaciones estuvieron basadas en su genetica. Asi,
elpotencial para un rapido crecimiento puede permitir a las plan- tas de sitios salinos depender de reservas superficiales menos
salinas disponibles a inicios de la estacion de crecimiento.
Cheatgrass (Bromus tectorum L.),
acleistogamous annual grass, was introduced to the western United States from Eurasia in the 1800's (Novak et
al.1993). Since its introduction cheat- grass rapidly occupied overgrazed rangelands and other disturbed areas reaching its current geographic range by 1930 (Mack 1981).
Its success in cold deserts and many other habitats of western North America
isattributed to several developmental and mor- phological characteristics including rapid growth of an extensive root system, tremendous phenotypic plasticity, and the ability to germinate and establish over a wide range of temperature and moisture conditions (Smith et
al.1997). Its presence has been
This research was supported by the Idaho DOE-EPSCoR Traineeship program and The Environmental Science and Research Foundation, Idaho Falls, Idaho. The authors thank Steve Link for providing seed collected from the Arid Lands Ecology Reserve.
The authors also thank Jeff Hill for helpful discussions on plant growth and development which improved the content of the manuscript.
Manuscript accepted 14 Feb. 2001.
recorded in pristine
aswell
asdisturbed sagebrush steppe com- munities. The ubiquitous nature of this weedy annual and its tenacity once established suggest that few factors have
anegative influence on its distribution. Nevertheless, cold desert habitats exist where it does not occur, indicating certain soil and climatic factors influence its ability to successfully establish and persist (see Smith et
al. 1997or Upadhyaya et
al.1986 for reviews). It has been suggested that soil salinity
is 1of those factors (Stewart and Hull 1949, Upadhyaya et
al.1986).
Salinity can cause osmotic stress, suppress nutrient absorption,
and affect biomass allocation patterns, physiological processes,
and biochemical reactions (Greenway and Munns 1980, Levitt
1980, Munns and Termaat 1986). Disruption of these processes
may reduce growth or alter developmental patterns in nonhalo-
phytic plants (Levitt 1980, Munns and Termaat 1986). Salt toler-
ance varies widely in both halophytic and nonhalophytic plants
(Levitt 1980). In addition, intraspecific variation
insalt tolerance
has been demonstrated in grass species growing in habitats of varying salinity (Nester et
al.1996).
In this study we examined growth and physiological responses of cheatgrass to varying levels of salinity, and explored the possibility of intraspecific variation in salt tolerance
incheatgrass from habitats dif- fering in soil salinity. Specific objectives were
1)to assess the effects of salinity on growth parameters and biomass partition- ing of cheatgrass,
2)to assess the impor- tance of developmental stage on salinity- induced differences in growth,
3)to assess the effects of salt stress on stomata! behav- ior and photosynthesis, and 4) to compare responses of cheatgrass plants from non- saline and saline sites to determine
whether growth characteristics account for
ahigher degree of salt tolerance in the population from the saline site.
Materials and Methods
Cheatgrass seeds were collected from the U.S. Department of Energy (DOE) Idaho National Engineering and Environmental Laboratory (INEEL) (42°52'00"N, 111°54'14.74"W) on the upper Snake River Plain in southeast Idaho, and from the Arid Lands Ecology Reserve (ALE) at the DOE Hanford Reservation (46°3015"N, 119°42'03"W)
ineastern Washington. These areas were chosen because previous studies suggested that soils at the INEEL (referred to here- after as the non-saline site) were less saline than those at the ALE (referred to hereafter as the saline site). Rasmuson (1996) showed that soil salinity potentially restricts emergence and growth of cheat- grass populations at the non-saline site and that salinity reduced percent germination of cheatgrass seeds collected from this
site. Incontrast, Rickard (1965) reported
apopulation of cheatgrass growing at the saline site where soil salinity at 1-m depth was 10.0 dS/m. Salinity was low in sur- face soils and increased with depth. The bulk of cheatgrass roots were shallower than
1m and it was unclear whether roots were actually exploring the high salinity
soil.
Two greenhouse studies were conducted to address the experimental objectives.
The first assessed growth, developmental and physiological responses of cheatgrass to increasing salinity using plants grown from seeds collected from the non-saline site. The second study compared growth responses of cheatgrass plants grown from seeds collected from the non-saline site
and from seeds collected from the saline study sites described by Rickard (1965).
The population comparison study was ini- tiated upon completion of the growth and development study, following the determi- nation that salinity caused reductions in growth and photosynthetic rates in popula- tions from the non-saline sites. The popu- lation of cheatgrass from the saline site was chosen because previous research indicated that it might be more tolerant of salinity than populations found at the non- saline site.
Salinity Treatments
Salinity treatments in both studies were designated control, low, medium and high.
Low- and medium-salinity treatments were based on soil salinity values that had been determined previously for the non- saline and saline field sites, respectively.
The high-salinity treatment was below tol- erance levels of common Artemisia species (West 1983) which are dominant shrubs in cold desert shrub-steppe habi- tats. Sodium chloride was added to water- ing solutions in concentrations of 0.0, 0.025 M, 0.070 M and 0.10 M resulting in electrical conductivities of
1.8(control), 4.5 (low), 9.0 (medium) and 13.7 (high) dS/m, respectively. The stock watering solution was half strength Raukura nutri- ent solution (Smith et
al.1983). Studies were conducted in
2greenhouses located in Pocatello, Ida..
Growth and Development
Cheatgrass seeds collected from non- saline soils were grown in 3.5-liter PVC pots filled with washed sand. Mean day/night temperatures were 27/20°C and mean daily maximum photosynthetic pho- ton flux density (PPFD) was
ca.900 pmol m2 sec-' (ambient light). Six seeds were planted per pot. After
3weeks each pot was thinned to
1plant. Care was taken to leave plants of similar size and develop- mental stage to ensure that results of the first harvest would not be confounded by
initial differences among plants.
Treatments were randomly assigned and began after plants were thinned. Each plant was watered with 300-ml of saline/nutrient solution every third day.
After 26 days of treatment, 4 plants per treatment were harvested at approximately 8-day intervals
(6harvests).
Population Comparisons
Plant culture and salinity treatments were the same as described above using the
2seed collections. Treatment and seed
sources were replicated
3times. This study was conducted in
adifferent green- house, consequently environmental condi- tions differed from above. Mean day/night temperatures were 24/18°
C;mean PPFD was 525 jimols
m"2sec"' (ambient light).
Because of the depth to saline soil report- ed by Rickard (1965) it was reasoned that plants would be somewhat older when their root systems encountered the saline soil than those were in the growth and development study when treatments were initiated. Therefore, plants were allowed an additional week of growth before treat- ments were applied. Also, treatment peri- od was reduced in the population study to determine whether effects of salinity appeared earlier than 26 days (treatment period of the first harvest in the growth and development study). Treatments were initiated when plants were 28 days old.
Plants were harvested
17days later.
Growth Measurements
Growth measurements were the same for both studies except where otherwise noted. Leaf length was measured from the base of the sheath to the tip with
aruler to the nearest mm, and the number of emer- gent leaves and tillers were counted. Mean leaf elongation rates were determined for plants in the growth and development study by dividing leaf length for plants
ineach treatment by the number of growing days. Leaves and stems were separated and area was determined with
amodel CI-201 area meter (CID, Inc., Vancouver, Wash., USA). Roots were extracted from the sand by removing the sand/root col- umn from the PVC container, placing the whole column on
ascreen above
acatch- ment basin, and rinsing the bulk of the sand away. Any root material was retrieved from the basin. Roots were then floated
inclean water and remaining sand particles were removed. Leaf, stem and root biomass were dried at 70°
Cuntil weight loss ceased and weighed on
aMettler H31AR analytical balance (Denver Instruments, Arvada, Colo., USA). Root area and length were mea- sured with
aPseudo-color Agvision image analyzer (Decagon Devices, Inc., Pullman, Wash., USA).
Development Indices
Two indices were used to evaluate
effects of salt stress on development. The
plastochron index is a commonly used
developmental scale based on the time
between initiation of successive leaves
(Erickson and Michelini 1957). As an
approximation of the plastochron index,
mean leaf initiation rates were calculated by dividing the number of leaves produced per plant by the number of growing days.
This was used to determine if salt treat- ments directly affected plant development.
Plants of the same chronological age may differ in their stages of development, thus obscuring mechanisms of reduced growth caused by treatment. Because the natural log (ln) of whole plant dry mass was lin- early related to time for plants in the 4 salinity treatments, we used this parameter as
asecond developmental index. Leaf area was related to this index for each plant in the study to determine if salt induced effects on growth were the same for plants compared at similar develop- mental stages
asthose observed at equiva- lent chronological ages. Second order polynomials with 95% confidence inter- vals were fitted to leaf area versus
Intotal dry mass for each treatment. Polynomials from the low, medium and high treatments
were compared to the control treatment.
Gas Exchange Measurements, Leaf Water Potentials and Carbon Isotope Discrimination
Leaf water potentials were measured in both studies. Leaf gas exchange and leaf carbon isotope concentrations were mea- sured only in the growth and development study. Mid-day water potential of leaves was measured with a pressure chamber (PMS Instruments Co., Corvallis, Ore., USA) at the time of gas exchange mea- surements. For population comparisons, leaf water potential was measured just prior to harvest. Gas exchange characteris- tics were measured on
3plants per treat- ment at the first, third and fifth harvests.
Measurements were made with an open gas exchange system described by Toft et
al.(1989). Young, fully expanded leaves on one or more tillers were sealed in
anickel plated cuvette and photosynthetic rate at ambient CO2 concentration and stomatal conductance were measured under typical atmospheric conditions.
Incident photon flux density supplied by a 300-watt projector lamp was maintained at about
1800pmol m
2 sec"'.Leaf tempera- ture was 20°
C.Ambient CO2 concentra- tion was 350
± 5 j,tlliter"', and the vapor pressure deficit was
1.8kPa. Measure- ments were taken after steady state rates were reached. Intercellular CO2 concen- tration, photosynthetic rates, and stomatal conductance were calculated according to von Caemmerer and Farquhar (1981).
Plant material from
3plants per treat- ment at the first and third harvests was collected for determination of carbon iso-
tope values. Young, fully expanded leaves were dried, ground and sent to the Stable Isotope Research Facility for Environ- mental Research at the University of Utah for analysis. Carbon isotope discrimina- tion
(A)was calculated from carbon iso- tope ratios according to Farquhar and Richards (1984). Carbon isotope discrimi- nation is linearly related to intercellular CO2 concentration:
0 = a + (b
- a)(cilca) (1)where a is discrimination against
13C02relative to
12C02by diffusion in air (4.4
%o), b is
discrimination against
13C02by carboxylation (27
%o), ci isthe intercellu- lar CO2 concentration of the leaf, and
ca isthe concentration of CO2 in the atmos- phere (350 pl liter'). Because
a,b and ca are constant, variation in 0 reflects
changes in intercellular CO2 concentration which occur due to changes in stomatal conductance and mesophyll capacity to fix CO2 (Farquhar et
al.1982). An integrated mean intercellular CO2 concentration was estimated from 0 using the above equation and constants. Changes in 0 and intercel- lular CO2 concentration, relative to the control group, were evaluated for plants in the low-, medium- and high-salinity treat-
ments.
Statistical Analysis
Two-way analyses of variance (ANOVA) with time and salinity, or seed source and salinity,
asindependent vari- ables were used to analyze growth and physiological parameters. Tests for differ- ences were considered significant for P
<_0.05. Growth parameters were
Intrans- formed for analysis. Differences in rela- tive growth rates (RGR, the rate of increase in plant weight per unit of plant weight) among treatments were assessed by examining the interaction between time and salinity treatment for transformed total dry mass (Poorter 1991). Post-hoc com-
parisons were made among treatments for specific leaf area, leaf elongation rates, and leaf initiation rates. Bonferroni pair- wise comparisons were used to examine differences in specific leaf area among the
4salinity treatments. Leaf elongation and initiation rates were examined at the last harvest by comparing individual treatment means within that harvest (i.e., analysis of simple effects, Keppel 1991).
Physiological variables were normally distributed, met the assumption of equal variance, and consequently were not trans- formed for analysis. The time effect was not significant for gas exchange variables,
A,or leaf water potential, and was there- fore dropped from the analysis, resulting in
a1-way ANOVA with salinity
asthe independent variable. Post-hoc pairwise multiple comparisons were made between treatments using the Tukey HSD test (Keppel 1991). The relationships between photosynthetic rates, stomatal conduc- tance, intercellular CO2 concentration
,leaf water potential, 0, and electrical con- ductivity of the salinity treatments were evaluated with Pearson correlation.
Relationships between photosynthetic rates, stomatal conductance and intercellu- lar CO2 concentration were also explored with Pearson correlation.
Results
Growth and Development Analysis
Biomass accumulation was significantly depressed by salinity (Fig,
1,Table
1).The significant interaction between time and salinity for transformed whole plant dry mass indicated differences occurred
inrelative growth rates (RGR) among treat- ments (Fig.
1 Intotal dry mass, Table
1).The RGR of plants in the high-salinity treatment was lower than that of the other
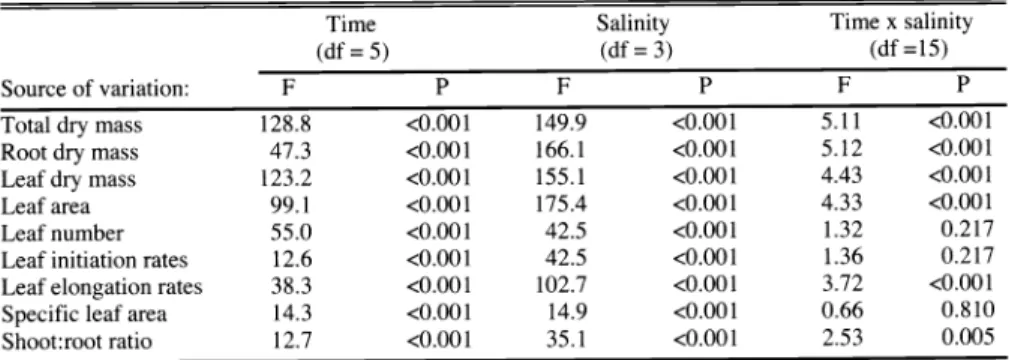
Table 1. Results of analyses of variance (ANOVA) of growth variables for cheatgrass plants grown in 4 salinity treatments. F =
F-ratio
of the ANOVA, P = probability of Type Ierror. Error term df
= 68 (all tests).Time (df = 5)
Salinity (df = 3)
x salinity (df =15)
Source of variation: F P F P F P
Total dry mass 128.8 <0.001
Root dry mass 47.3 <0.001
Leaf dry mass 123.2 <0.001
Leaf area 99.1 <0.001
Leaf number 55.0 <0.001
Leaf initiation rates 12.6 <0.001 Leaf elongation rates 38.3 <0.001 Specific leaf area 14.3 <0.001 Shoot:root ratio 12.7 <0.001
2
1
0 -1
-2
2
7 6 5
4 3
-0 -1
-2 -3 -4
-5
0 10 20 30 40 50 60 70 80
Days after treatment initiation
Fig. 1. Growth
parameters
for cheatgrass plants grown in 4 salinitytreatments.
Symbolsare
meansfor
4 plantsat
6 harvests. Barsare
SE. Note differences in scale for each variable.3
treatments. Slopes of transformed total dry mass
vstime for plants in the control, low- and medium-salinity treatments were roughly parallel indicating RGRs were similar (Fig.
1).The interaction between time and salini- ty was significant for root dry mass (Table
1).Root dry mass of plants in the medi- um-salinity treatment was lower than that of plants in the high-salinity treatment at the first harvest (Fig.
1).At subsequent harvests, root dry mass for plants in the high-salinity treatment was reduced below that of plants in the medium-salinity treat- ment. The relative rankings of salinity treatments did not change for root dry mass after the second harvest (Fig.
1).With the exception just noted, salinity caused significant reductions in root dry mass at all harvests (Table
1,Fig.
1).Root area and length showed similar responses to salt stress as root dry mass (data not shown).
Interactions between time and salinity for leaf dry mass and leaf area were also significant (Table
1).The interactions were caused by changes in the magni- tude of difference among treat- ments over time, relative rank- ings of salinity treatments were not affected (Fig.
1).Leaf area and dry mass were significantly reduced by increasing salinity (Table
1,Fig.
1).Both leaf area and dry mass were negatively correlated with salinity at the final harvest (Fig.
2).The same patterns were observed for stem area and dry mass (data not shown).
Leaf initiation rates were slowed by medium and high salinity (Table 2) resulting in fewer leaves per plant (Table
1,Fig.
2).Plants in the high-salini- ty treatments at the final harvest exhibited a reduction in mean leaf initiation rates of nearly 70% compared to plants in the control treatment (Tables
1and 2). Leaf elongation rates were also significantly reduced by salinity (Table 1). Mean leaf
400
300
200
100
E 3.0 2.5 2.0 1.5 1.0 0.5 0.0
a
1200
800
400
0 0
10 20 30 40 50 60 70 80
Days after treatment initiation
2 4
EC (dS/m)
I ,
6 8 10 16
EC (dSlm)
12 14
elongation rates for plants from
Fig. 2. Leaf accumulation over time and leaf parame-the final harvest were reduced by
an average of
10%in low-, 22%
in medium-, and 58% in high- salinity plants compared to con- trol plants (Table
2).Mean specific leaf area (leaf area:leaf dry mass) was higher for control plants than for medium- and high-salinity plants (P
=0.043 and P
<
0.001, respectively, from
ters at
the final harvest for cheatgrass plants grown in 4 salinitytreatments.
Symbolsare
means for 4 plants. Bars are SE. EC = electrical conductivity of the watering solution.for higher ratios for plants in the medium- salinity treatment (Table
1,Fig.
3).No differences were observed in leaf area between plants in the control and low-salinity treatments when compared at similar developmental stages (95% confi- dence intervals for second order polyno- mials overlap, Fig. 4) indicating that dif- ferences observed at equal chronological ages were due to differences in develop- mental stages. Polynomial coefficients of the medium and high treatments were reduced from control; there was no over- lap in the 95% confidence intervals (Fig.
4) indicating that both the rate and pattern of development were affected.
Bonferroni pairwise comparisons). Mean specific leaf area decreased from the fourth to the sixth harvest for plants in all treatments (Fig.
3).Shoot:root ratios were higher for plants in the high-salinity treatment than for plants in the remaining treatments, but the magnitude of this difference changed over time (Fig.
3).Shoot:root ratios for plants in the medium-, low- and control-salinity treatments were similar, with
aslight trend
Table 2. Mean
rates
(± SE) of leaf initiation (leavesday')
and leaf elongation (cmday'')
for cheat- grass plants grown in 4 salinity treatments. Means are based on 4 plantsper treatment.
Treatment Leaf initiation rate Leaf elongation rate
(leaves day- --- ) (cm day )
Control 4.9 (0.92)a1 0.31(0.03y
Low salinity 3.6 (0.11)a
0.28 (0.01)ab
Medium salinity 2.1(0.48)b 0.24 (0.02)b
High salinity 1.5 (0.42)b 0.13 (0.01)
Means within columns with the same superscript are not significantly different at P = 0.05.
N U
a
600
500
400
C/D 300
200
0 2 4 6 8 10 12 14 16
EC (dS/m)
0
+r 0 0
30
0 control
low salinity - La medium salinity
p high salinity 25
20 15
0.10
5
0
Days after treatment initiation
Fig. 3. Specific leaf
area
(SLA) and shoot:root ratios for cheatgrass plants grown in 4 salini- tytreatments.
Specificleaf area's are the means of
4plants at
2harvest periods.
EC = electrical conductivity of the watering
solution. Shoot:root ratios are means of
4 plantsat
6 harvests. Barsare
SE.1400 1200 1000 800 600 400 200 0
0 10 20 30 40 50 60 70 80
1400 1200 1000
800 600 400 200 0
1400 1200 1000 800 600 400 200 0
-3 -2 -1 0 1
In Whole plant dry mass (g)
Fig. 4. Relationship between leaf
area
and nat-ural
logtransformed
(ln) wholeplant dry
massfor cheatgrass plants grown
infour salinity treatments. Comparisons are
between control and salinitytreated
plants.Symbols
represent
individuals. Linesare
sec- ond degree polynomials with 95% confidenceintervals fitted
tothe data.
The followingcoefficients describe the curves: control,
b0=332, b1=317, b2=84, r2=0.98,P0.001;
low, by=304,
b1=273, b2=75,
r2=O.97, P<0.001;medium,
by=257, b1=212, b2=51,r2=0.98, P<0.001; high, b0=176, b1=105,
b2=16, r2=0.96, P<0.001.Table 3. Results of 2-way analyses of variance (ANOVA) for growth
parameters
of cheatgrass plants from the 2 seed sources grown in 4 salinity treatments. Interaction terms were not significant (P > 0.05). F = Fratio
of the ANOVA, P = probability of a Type Ierror.
Salinity (df = 3)
Seed source (df
=1)
Source of variation: F P F P
Leaf area 9.29 0.001
Stem area 6.89 0.003
Root length 5.12 0.011
Root area 6.01 0.006
Specific leaf area 2.84 0.070
Population Comparisons
Growth parameters were significantly reduced by increasing salinity for plants from both seed sources (Fig.
5)with the exception of shoot:root ratios, which increased with salt stress. Because growth responses were similar to those presented above, only differences that occurred between populations will be presented here. Leaf and stem area, root area, and specific leaf area were all greater for plants from the saline site than for plants from the non-saline site (Table
3,Fig.
5).Root length was not significantly different at the designated significance level of P
=0.05. However, there was
atrend towards greater root length for plants from the saline site (P = 0.06). Stem area and root length showed similar patterns to leaf area and root area, respectively, and so were not included in Fig.
5.Gas Exchange Characteristics Photosynthetic rates, stomatal conduc- tance, intercellular CO2 concentration and leaf water potential were significantly dif- ferent among salinity treatments (P
<0.001, df
= 3,for all cases). Mean photo- synthetic rate was maintained by plants growing under low-salinity conditions but was reduced by
18and 41% for plants in the medium- and high-salinity treatments, respectively (Table 4). Stomatal conduc- tance was negatively correlated with salin- ity (r
=0.88, P
<0.001,
n =35) and was reduced by
asmuch
as67% for plants in the high-salinity treatment (Table 4).
Intercellular CO2 concentration and leaf
water potential were also negatively corre- lated with salinity (r
=0.89, P
<0.001, and r
=0.62, P
<0.001 respectively,
n =35). Photosynthesis and stomatal conduc- tance were linearly related to intercellular C02 concentration
(r
=0.63, P
<0.001 and r
=0.87, P
<0.001 respectively, Fig.
6).
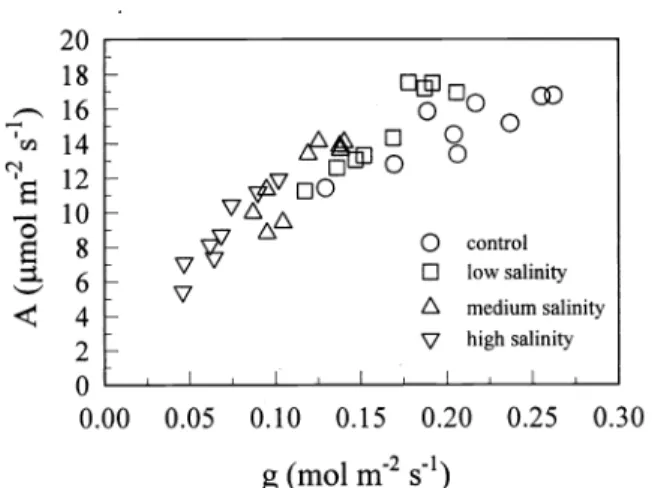
Photosynthesis was positively correlat- ed with stomatal conductance (r
=0.89, P
<
0.001, Fig.
7).Leaf water potentials did not differ between populations (P
=0.96, data not shown).
Carbon Isotope Discrimination
Carbon isotope discrimination differed significantly among treatments (P
<0.001, data not shown), and was negatively corre- lated with increasing salinity (r
=0.85, P
<0.001,
n =24, Fig.
8).Carbon isotope discrimination and intercellular CO2 con- centration calculated from
Adecreased rel- ative to control in all treatments (Table
5).Time averaged intercellular CO2 concen- tration calculated from
Adecreased by
asmuch
as 65 p1liter
1for plants in the high- salinity treatment compared to control (Table
5).Discussion
Growth, Development and Biomass Partitioning
Large reductions in leaf area at the first harvest (26 days of treatment) indicated that leaf production and/or expansion were stunted in response to salinity early in
Table 4. Means for net assimilation
rate
(A), stomatal conductance (g), intercellular CO2 concen-tration
(ci) and leaf water potential (ip) for cheatgrass plants grown in 4 salinity treatments. Meansare for
9 plants per treatment. SEare
in parentheses.Treatment A
Control 14.8
(0.81)0.208
Low Salinity 14.9 (0.63)' 0.165 Medium Salinity 12.1(0.72)b 0.116 High Salinity 8.8 (0.79) 0.069
g ci
(j mol
m
2sec')
(molm
2sec')
(pLliter
1) (MPa) (0.014)a228 (5.5)a (0.010)b 199 (3.1)b (0.007)` 175 (6.4)c
(0.007)d 140 (7.4) (0.143)
100
40
20
0
60
N
d
CI) 40
20
E 100
80
Saline site Non-saline site
expanding, more tissue would have been past the most sensitive developmental stages than at the first harvest. This could have resulted in new steady state relative growth rathe (RGR's) that were similar to control plants in the low- and medium- salinity plants. However, because RGR
is acompound rate of change, even small initial differences in rates can result in large differences
infinal biomass (framer et
al.1994). The number of leaves in the
high-salinity treatment remained low throughout the study. Thus, plants subject- ed to the high-salinity treatment were unable to recover.
Specific leaf area varied for plants in the different treatments over time, increasing initially then decreasing. Lower specific leaf area indicates more biomass was allo- cated to leaf structure
asthe plants aged, which probably also influenced RGR's.
The comparatively higher specific leaf area in control and low-salinity plants indicates
alower investment in biomass per unit area and increased photosynthetic surface of leaves, both of which would enhance whole-plant carbon gain. Thus, in a field setting, plants growing on non- saline soils could have the potential to increase leaf area at
agreater rate which could increase competitive ability and flower production compared to plants growing in saline soils.
Mechanisms behind the strong reduction in leaf area and dry mass in response to salt treatments were both developmental and physiological in nature. Specifically, inhibition of leaf expansion observed in the salt-treated plants was partly related to low photosynthetic rates. Also, lower water potentials of plants in the high-salt treatment might have affected cellular expansion through effects on cell turgor, resulting in reduced leaf expansion
(Cosgrove 1986). Reductions in the num- ber and size of leaves induced by increas- ing salinity indicate development was affected at both the meristematic level and at subsequent leaf expansion stages, resulting in reduced leaf area and dry mass. Investigation of the leaf area vs.
total dry mass relationships shows the pri- mary effect of the low-salinity treatment was to slow the rate of development in
cheatgrass. Similar developmental responses to salinity have been observed in salt-sensitive dicots such as lettuce (Lactuca sativa L., Lazof et
al.1991). The medium and high treatments had profound effects on cheatgrass which retarded the pattern of whole-plant development and severely delayed timing of growth.
Cheatgrass often functions as a drought
60
40
Control Low Medium High Salinity
Fig.
5.Growth parameters for cheatgrass plants from saline and nonsaline environ-
ments grown in 4 salinity treatments. Means are for 3 plantsper treatment.
Bars are SE.SLA = specific leaf area.
development for treated cheatgrass.
Bernstein et
al.(1993) found that growth velocity
insorghum leaves was most sen- sitive to salinity when leaves were elon- gating linearly at
arapid rate, and they were especially sensitive to salinity when the leaf was still enclosed in the encircling sheaths. Toward the end of the elongation period the sensitivity to salinity was reduced. Cheatgrass plants in the low- and
medium-salt treatments experienced reduction in leaf elongation and produc- tion shortly after salinity treatments began, resulting in differences in plant size
atthe first harvest. At later harvests, with
agreater number of leaves and there- fore progressively more leaf tissue
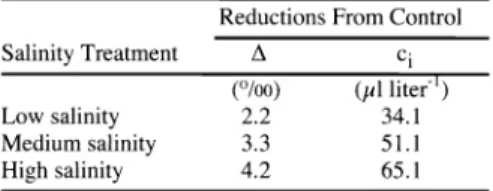
Table 5. Salinity induced reductions in carbon isotope discrimination (A) and time averaged intercellular CO2 concentrations (ci) calculat- ed from A for cheatgrass plants. Values
are
mean reductions in eachtreatment
compared tocontrol values. Means are based
on 6 plants per treatment. All means were signifi- cantly different from control (P < 0.05, Tukey HSD test).Reductions From Control
Salinity Treatment A ci
Low salinity
(°/oo) 2.2
liter')
34.1
Medium salinity 3.3 51.1
High salinity 4.2 65.1
N
0
0.30 0.25 0) 0.20
N
:_! 0.15 0
0.10 00
0.05 0.00
0
0V
C V L
100
O
0 cxjL
0
00
,,V0
$
V oV
0
control 0
low salinity medium salinity
00o
00
high salinity
: o
boo
0
0V
Soo
150 200 250
ci (µL L l)
300
Fig. 6. Relationship of photosynthesis (A) and
stomatal conductance
(g) tointercellular
CO2 concentration (c1) for cheatgrass plants grown in 4 salinity treatments. Symbols rep- resent individual plants.avoider in arid steppe environments with growth and seed set occurring early in the season before water becomes severely lim- iting (Rice et
al.1992). The delay
intim- ing of growth caused by salinity may be great enough in saline environments to prevent or reduce seed production, thus inhibiting population maintenance and/or expansion in such environments.
It is noteworthy that salinity caused
ashift in biomass allocation from roots to shoots in cheatgrass since the opposite response is commonly reported for other species (e.g., Seemann and Critchley 1985). Salinity caused
a50% increase in root to shoot ratios in bean plants (Phaseolus vulgaris L.) due to
asmaller effect on root than shoot dry weight (Seemann and Critchley
1985).Cheatgrass root area and biomass were severely reduced by salinity. As
aresult, root growth may have been insufficient to sus- tain healthy shoot growth, particularly in the medium and high salinity treatments.
The remarkable success of cheatgrass in the sagebrush steppe, where competition for water and nutrients can be intense,
is inpart
aconsequence of its ability to rapidly develop an extensive root system (Harris 1967, Smith et al. 1997). Harris (1967) suggested rapid, early root growth was responsible for cheatgrass' competitive displacement of bluebunch wheatgrass (Agropyron spicatum [Pursh] Scribn.
&Smith). Mack and Pyke (1983) showed
that reduced biomass production was
0
v
0
GD0 o0
0
0
controllow salinity L medium salinity
p
high salinityI I I
0.00 0.05 0.10 0.15 0.20 0.25 0.30
g (mol m
2s1)
Fig. 7. Relationship between photosynthesis (A) and stomatal conduc-
tance
(g)for cheatgrass plants grown
in 4salinity treatments.
Symbols
represent
individual plants.strongly correlated with reduced seed pro- duction
incheatgrass. Therefore, restricted root development caused by salinity would be expected to affect both its fitness and competitive ability.
Photosynthetic Rates, Stomatal Conductance and Carbon Isotope Discrimination
Reduction in plant growth caused by salinity
isoften accompanied by decreased rates of photosynthesis in
avariety of species (e.g., Meinzer et al. 1994, Seemann and Critchley 1985). This decline in photosynthesis has been attrib- uted to decreased stomatal conductance in some studies (i.e., cotton [Gossypium hirstutum L.] and bean [P. vulgaris, cv Strike], Brugnoli and Lauteri 1991) and to decreased mesophyll capacity to fix CO2 in others (i.e., bean [P. vulgaris, cv Hawkesbury Wonder, Seemann and Sharkey 1986). In this study, salinity reduced photosynthetic rates in cheatgrass by
18%in the medium- and 41% in the high-salt treatments compared to control.
Photosynthesis and conductance decreased concomitantly in response to salt stress (Fig.
7).However, salinity caused greater reductions in conductance than in photo- synthetic rate (67% and 41%, respective- ly). This difference caused the photosyn- thesis/conductance ratio to increase and therefore intercellular CO2 concentration
todecrease with salt stress. Thus, stomatal conductance was at least partially respon- sible for salinity induced reductions in photosynthesis. Additionally, both photo- synthetic rate and stomatal conductance were positively correlated with intercellu- lar CO2 concentration across salt treat- ments (Fig.
6).The increase in photosyn-
0 2 4 6 8 10 12 14 16
EC (dS/m)
Fig. 8. Relationship between carbon isotope discrimination (A) and electri- cal conductivity(EC)
for cheatgrass plants grown
in 4 salinitytreat-
ments. Symbolsrepresent
means for 6 plants. Bars are SE.thetic rate with intercellular CO2 concen- tration also provides evidence that reduc- tions in photosynthesis were primarily due to stomatal limitation rather than reduced mesophyll photosynthetic capaci- ty (Meinzer et
al.1994). Had intercellular CO2 concentration remained constant, or increased, with concomitant reductions in photosynthesis and stomatal conductance (g), this would have indicated that salinity affected the photosynthetic capacity of the mesophyll (Brugnoli and Lauteri 1991).
Therefore, reductions in photosynthetic rate caused by salinity in cheatgrass
seemed to be primarily due to reduced
g.However, this hypothesis was not explicit- ly tested.
Carbon isotope discrimination reflects diffusional and assimilation components of leaf physiology averaged over the life of
aleaf and can be used to investigate long term effects of environmental stresses (Farquhar et
al.1982). The
4.2%oreduc- tion in
Acaused by the high-salinity treat- ment was indicative of
a65 pl liter"' decrease in the average intercellular CO2 concentration. Similar salt induced shifts in 0 have been reported for other species (spinach [Spinacia oleracea L.] Downton et al. 1985; bean [P. vulgaris] Seemann and Critchley 1985; plantain [Plantago maritima
L.]Flanagan and Jefferies 1989).
The reductions in
Aand time averaged intercellular CO2 concentration calculated from 0 caused by salt treatments indicate that long term effects of salinity on leaf physiology includes reduced
g,even at low salinity levels. Decreased carbon gain would be one long-term result of reduced
g.Population Comparisons
Leaf area of cheatgrass plants from the saline site was nearly twice that of plants
from the non-saline site in the control, low- and medium-salinity treatments. In addition, root area and length were greater across treatments for plants from the saline site. However, it is important to note that the percent reduction in leaf and root area caused by salinity in plants from the saline site was similar to that in plants from the non-saline site and no differences were found in leaf water potential between populations. Thus, primary physiological responses to salinity appear to have been similar in these populations. Because plants were grown in a common environ- ment, the accelerated growth of plants from the saline site suggests differences in response to environmental conditions were genetically based. If these differences were due to phenotypic plasticity, one would expect the same rates of area accu- mulation in the control plants from the
2populations when grown under identical conditions. Cheatgrass
isself pollinating and studies have indicated that outcrossing
israre, and that gene flow among popula- tions occurs primarily through seed disper- sal (e.g., Pyke and Novak 1994). This might constrain the evolution of locally adapted ecotypes. Studies suggest that genetic variation found among cheatgrass populations is probably due to multiple introductions (Novak et
al.1993) and that little ecotypic differentiation has occurred (Pyke and Novak 1994). Thus, it seems likely that plants from the saline site were pre-adapted for survival under saline con- ditions due to genetic potential for rapid growth.
Plants from the saline site maintained
higher specific leaf area than those from
the non-saline site, with the exception of
plants in the control treatment. This indi-
cates a lower investment in biomass per
unit area in leaves of the plants from the saline site, perhaps resulting
inlower car- bon requirements for maintenance respira- tion for those plants when subjected to salinity. Also, specific leaf area
isposi- tively correlated with relative growth rate (RGR) in many species (Poorter 1991).
The faster growth of plants from the saline site could increase competitive ability and shorten time to flowering. Accelerated growth of these plants in
anatural setting may enable use of shallow, less saline moisture reserves early in the growing season, prior to depletion by neighboring species that either do not become active
asearly
ascheatgrass, or are not
ascompeti- tive for water resources. Thus, low soil water potential that occurs later in the sea- son could be avoided, as suggested by Rice and Mack (1991).
Conclusions
Increasing soil salinity had profound effects on photosynthesis and growth of cheatgrass. Responses to salt stress includ- ed
1)reduced whole-plant carbon gain
asa consequence of low photosynthetic rates and reduced leaf area,
2)severely stunted root growth and
3)alteration of biomass allocation patterns from roots to shoots.
The combined effects on growth and phys- iology could impair cheatgrass's competi- tive ability and/or lead to reduced seed production in environments where soil salinity is greater than approximately
4dS/m in the rooting zone. Thus, success of cheatgrass in saline environments is probably limited by physiological and developmental mechanisms which stunt or delay growth and likely reduce fecundity.
Cheatgrass plants from the saline site accumulated leaf and root area faster than those from non-saline site and tended to invest less biomass per unit area in leaves.
While plants from the saline site experi- enced salt induced reductions in area and biomass, accelerated growth may convey advantage to plants from this population in saline habitats.
Literature Cited
Bernstein,
N.,W.K. Silk, and
A.Lauchli.
1993. Growth and development
of
sorghumleaves under conditions of NaCI stress.
Planta 191:433-439.
Brugnoli,
E.and
M.Lauteri.1991.
Effectsof
salinity on stomatal conductance, photosyn- thetic capacity, and carbon isotope discrimi- nationof
salt-tolerant (Gossypium hirsutumL.) and salt-sensitive (Phaseolus vulgaris L.) C3
non-halophytes. Plant Physiol.
95:628-635.
Cosgrove,
D. 1986.Biophysical control of
plant cell growth. Annual Rev. Plant Physiol.37: 377-405.
Cramer, G. R., G.J. Alberico, and C.
Schmidt.
1994.Leaf expansion limits
dry matter accumulationof
salt-stressed maize.Australian J. Plant Physiol. 21:663-674.
Downton, W.
J.
S., W.J.
R.Grant, and
S. P.Robinson.
1985.Photosynthetic
and stom- atal responses of spinach leaves to salt stress.Plant Physiol. 77:85-88.
Erickson, R.O. and F.J. Michelini.1957.
The plastochron index. Amer. J. Bot. 44:297-305.Farquhar,
G. D.and
R. A.Richards.
1984.Isotopic composition
of
plant carbon corre-lates with water-use efficiency of wheat
genotypes. Australian J. Plant Physiol. 11:539-552.
Farquhar,
G. D., M. H.O'Leary, and J.
A.Berry.
1982. On therelationship between
carbon isotope discrimination and the inter-cellular carbon dioxide concentration
in leaves. Aust. J. Plant Physiol. 9:121-137.Flanagan,
L. B.and
R. L.Jefferies.
1989.Effects of increased salinity on CO2 assimi- lation,
02
evolution and the 13C valuesof
leaves of Plantago maritima L. developed atlow and high NaCL levels. Planta
178:377-384.Greenway, H. and R. Munns. 1980.
Mechanisms of salt tolerance
innonhalo- phytes.
Annu. Rev.Plant Physiol. 31:149-
190.Harris,
G. A. 1967. Somecompetitive rela- tionships between
Agropyron spicatum and Bromus tectorum. Ecol. Monogr. 37:89-111.Hester, M.W.,
I. A.Mendelssohn, and K.L.
McKee.
1996. Intraspecific variation in salttolerance and morphology
inthe coastal
grassSpartina patens (Poaceae). Amer.
J.Bot. 83:1521-1527.
Keppel, G. 1991. Design and analysis:
a researcher's handbook. Prentice Hall. Upper Saddle River, N.J.Lazof, D.,
N.Bernstein, and
A.Lauchli.
1991. Growth and development of the Lactuca sativa shoot
asaffected
by NaCl stress: considerationof leaf
developmental stages. Bot. Gazette 152:72-76.Levitt, J.
1980. Salt and ion stresses, p. 365- 434. In: Responsesof
plants to environmen- talstresses,
vol II.Academic Press.
New York, N.Y.Mack,
R. N. 1981. Invasionof
Bromus tecto- rum L. into western North America; an eco-logical chronicle. Agro-Ecosystems
7:145-165.Mack, R.
N.and
D. A.Pyke. 1983. The
demographyof
Bromus tectorum: variation in time and space. J. Ecol. 71:69-93.Meinzer,
F. C., Z.Plaut, and
N. Z.Saliendra.
1994.
Carbon isotope discrimination,
gas exchange, and growthof
sugarcane cultivars under salinity. Plant Physiol. 104:521-526.Munns,
R.and
A.Termaat.
1986.Whole- plant responses
tosalinity.
Aust. J.Plant
Physiol. 13:143-160.Novak,
S.J.,
R. N.Mack, and
P. S.Soltis.
1993. Genetic variation in Bromus tectorum:
introduction dynamics
inNorth America.
Can. J. Bot. 71:1441-1448.
Poorter,
H. 1991. Interspecific variation in the relative growth rate of plants: The underlying mechanisms. Ph.D. Diss. Univ.of
Utrecht, the Netherlands.Pyke,
D.A.and
S.J. Novak. 1994. Cheatgrassdemography
-establishment, attributes,
recruitment, ecotypes, and genetic variabili- ty, p. 12-21. In: S.B. Monsen, S.G. Kitchen(eds.),
Proc. Ecol. and Manage.of
Annu.Rangelands, INT-GTR-313. Interm.
Res.Sta., Ogden, Ut.
Rasmuson,
K.E. 1996. Population and individ- ual responsesof
Bromus tectorum to environ- mental stresses: a studyof
factors that may limit its distribution in cold desert habitats.Ph.D. Diss.. Ida. State Univ., Pocatello, Ida.
Rice, K.
J. and
R. N.Mack.
1991. Ecologicalgenetics of Bromus tectorum. III. The demography of reciprocally
sown popula- tions. Oecologia 88:91-101.Rice, K.
J. and
R.A.Black,
G.Radamaker, and R.D. Evans. 1992. Photosynthesis, growth, and biomass allocation
inhabitat
ecotypesof
cheatgrass (Bromus tectorum).Functional Ecol. 6:32-40.
Rickard,
W. H. 1965. The influence of grease- wood on soil moisture penetration and soil chemistry. Northwest Science 39:36-42.Seeman,
J.
R.and
C.Critchley.1985.
Effectsof salt stress
on thegrowth,
ioncontent,
stomatal behavior and photosynthetic capaci- tyof
a salt-sensitive species, Phaseolus vul-garis
L. Planta 164:151-162.Seemann, J. R. and T.
D.Sharkey.
1986.Salinity and nitrogen effects on photosynthe- sis,
ribulose-l,5-bisphosphate carboxylase
and metabolite pool sizes in Phaseolus vul-garis
L. Plant Physiol. 82:555-560.Smith, G. S., C. M. Johnston, and I.
S.Cornforth.
1983.Comparison of nutrient solutions for growth of plants
in sand cul- tures. New Phytologist 94:537-548.Smith,
S.D., R. K. Monson, and J. E.
Anderson.
1997. Exotic plants, p.199-225.In: Physiological Ecology
of
North American Desert Plants. Springer-Verlag, N.Y.Stewart,
G.and
A. C. Hull. 1949. Cheatgrass (Bromus tectorum L.)- an ecologic intruder in southern Idaho. Ecol. 30:58-74.Toft, N. L.,
J.
E.Anderson, and
R. S. Nowak.1989. Water use efficiency and carbon iso- tope composition of plants in a cold desert environment. Oecologia 80:11-18.
Upadhyaya,
M. K., R.Turkington, and
R.McIlvride.
1986. The biologyof
Canadian weeds. Can. J. Plant Science 66:689-709.von Caemmerer,
S.and G.
D.Farquhar.
1981. Some