Jointly Event Extraction and Visualization on Twitter via Probabilistic
Modelling
Deyu Zhou†‡ Tianmeng Gao† Yulan He§
†School of Computer Science and Engineering, Key Laboratory of Computer Network and Information Integration, Ministry of Education, Southeast University, China ‡State Key Laboratory for Novel Software Technology, Nanjing University, China
§School of Engineering and Applied Science, Aston University, UK
[email protected], [email protected], [email protected]
Abstract
Event extraction from texts aims to de-tect structured information such as what has happened, to whom, where and when. Event extraction and visualization are typ-ically considered as two different tasks. In this paper, we propose a novel approach based on probabilistic modelling to joint-ly extract and visualize events from tweet-s where both tatweet-sktweet-s benefit from each oth-er. We model each event as a joint dis-tribution over named entities, a date, a lo-cation and event-related keywords. More-over, both tweets and event instances are associated with coordinates in the visual-ization space. The manifold assumption that the intrinsic geometry of tweets is a low-rank, non-linear manifold within the high-dimensional space is incorporated in-to the learning framework using a regu-larization. Experimental results show that the proposed approach can effectively deal with both event extraction and visualiza-tion and performs remarkably better than both the state-of-the-art event extraction method and a pipeline approach for event extraction and visualization.
1 Introduction
Event extraction, one of the important and chal-lenging tasks in information extraction, aims to detect structured information such as what has happened, to whom, where and when. The out-puts of event extraction could be beneficial for downstream applications such as summarization and personalized news systems. Data visualiza-tion, an important exploratory data analysis task, provides a simple way to reveal the relationships among data (Nakaji and Yanai, 2012).
Although event extraction and visualization are two different tasks and typically studied separately in the literature, these two tasks are highly related. Documents which are close to each other in the low-dimensional visualization space are likely to describe the same event. Events in nearby loca-tions in the visualization space are likely to share similar event elements. Therefore, jointly learn-ing the two tasks could potentially brlearn-ing benefits to each other. However, it is not straightforward to learn event extraction and visualization jointly since event extraction usually relies on semantic parsing results (McClosky et al., 2011) while vi-sualization is accomplished by dimensionality re-duction (Iwata et al., 2007; L´opez-Rubio et al., 2002).
In this paper, we propose a novel probabilistic model, called Latent Event Extraction & Visual-ization (LEEV) model, for joint event extraction and visualization on Twitter. It is partly inspired by the Latent Event Model (LEM) (Zhou et al., 2015) where each tweet is assigned to one even-t inseven-tance and each eveneven-t is modeled as a join-t disjoin-tribujoin-tion over named enjoin-tijoin-ties, a dajoin-te/join-time, a location and the event-related keywords. Going beyond LEM, we assume that each event is not only modeled as the joint distribution over event elements as in (Zhou et al., 2015), but also asso-ciate with coordinates in the visualization space. The Euclidean distance between a tweet and each events determines which event the tweet should be assigned to. Furthermore, the manifold as-sumption that the intrinsic geometry of tweets is a low-rank, non-linear manifold within the high-dimensional space, is incorporated in the learning framework using a regularization. Experimental results show that the proposed approach can effec-tively deal with both event extraction and visual-ization tasks and performs remarkably better than both the state-of-the-art event extraction method
and a pipeline approach for event extraction and visualization.
2 Related Work
Our proposed work is related to two lines of re-search, event extraction and joint topic modeling and visualization.
2.1 Event Extraction
Research on event extraction of tweets can be cat-egorized into domain-specific and open domain approaches. Domain-specific approaches usual-ly have target events in mind and aim to extract events from a particular location or for emergen-cy response during natural disasters. Anantharam et al. (2015) focused on extracting city events by solving a sequence labeling problem. Evaluation was carried out on a real-world dataset consist-ing of event reports and tweets collected over four months from San Francisco Bay Area. TSum4act (Nguyen et al., 2015) was designed for emergency response during disasters and was evaluated on a dataset containing 230,535 tweets.
Most of open domain approaches focused on extracting a summary of events discussed in so-cial media. For example Benson et al. (2011) proposed a structured graphical model which si-multaneously analyzed individual messages, clus-tered, and induced a canonical value for each even-t. Capdevila et al. (2015) proposed a model named Tweet-SCAN based on the hierarchical Dirichlet process to detect events from geo-located tweet-s. To extract more information, a system called SEEFT (Wang et al., 2015) used links in tweets and combined tweets and linked articles to identi-fy events. Zhou et al. (2014; 2015) proposed an unsupervised Bayesian model called latent event model (LEM) for event extraction from Twitter by assuming that each tweet message is assigned to one event instance and each event is modeled as a joint distribution over named entities, a date/time, a location and the event-related keywords. Our proposed method is partly inspired by (Zhou et al., 2015). However, different from previous methods, our approach not only extracts the structured rep-resentation of events, but also learns the coordi-nates of events and tweets simultaneously.
2.2 Joint Topic Modeling and Visualization
Since our proposed approach can be considered as a variant of topic model, we also review the
relat-ed work of joint topic modeling and visualization here.
Traditionally, topic modeling and visualization are considered as two disjoint tasks and can be combined for pipeline processing. For example, probabilistic latent semantic analysis (Hofmann, 1999) can be first performed followed by para-metric embedding (Iwata et al., 2007). Another pipeline approach (Millar et al., 2009) is based on latent Dirichlet allocation followed by self-organizing maps (L´opez-Rubio et al., 2002).
Jointly modeling topics and visualization is a new problem explored in very few works. The state-of-the-art is a joint approach proposed in (I-wata et al., 2008). In this model, both documents and topics are assumed to have latent coordinates in a visualization space. The topic proportions of a document are determined by the distances be-tween the document and the topics in the visual-ization space, and each word is drawn from one of the topics according to the document’s topic pro-portions. A visualization was obtained by fitting the model to a given set of documents using the EM algorithm. Following the same line, by con-sidering the local consistency in terms of the in-trinsic geometric structure of the document mani-fold, an unsupervised probabilistic model, called SEMAFORE, was proposed in (Le and Lauw, 2014a) by preserving the manifold in the lower dimensional space. In (Le and Lauw, 2014b), a semantic visualization model is learned by asso-ciating each document a coordinate in the visu-alization space, a multinomial distribution in the topic space, and a directional vector in a high-dimensional unit hypersphere in the word space.
Our work is partly inspired by (Le and Lauw, 2014a). However, our proposed approach differ-s from (Le and Lauw, 2014a) in that eventdiffer-s, in-stead of topics, are modelled as the joint distribu-tion over event elements. Both tweets and events are associate with coordinates in the visualization space.
3 Methodology
visu-Table 1: Definition of Notations.
Notation Definition
e event index,e∈ {1..E}
W ={wm} tweets,m∈ {1..M}
Z={zm} event labels for tweets
Nmy number of named entities inwm
Nmd number of dates inwm
Nml number of locations inwm
Nmk number of keywords inwm
θey probability of named entityyin evente
φed probability of datedin evente
ψel probability of locationlin evente
ωek probability of keywordkin evente
β, γ, η, λ Dirichlet hyperparameters χ, δ Normal hyperparameters G dimension of visualization space
alization. We describe our model in more details below.
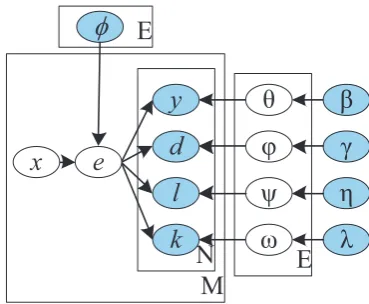
3.1 Latent Event Extraction & Visualization (LEEV) Model
We propose an unsupervised latent variable mod-el called the Latent Event Extraction & Visualiza-tion (LEEV) model which simultaneously extracts events from tweets and generates a visualization of the events. Table 1 lists notations used in this paper.
In LEEV, each tweet message wm, m ∈
{1...M}is associated with a latent coordinatexm
in the visualization space. Each evente∈ {1...E}
is also associated with a coordinateϕe.
Assum-ing that each tweet messagewm, m∈ {1...M}is
assigned to one event instance zm = eand eis
modeled as a joint distribution over named entities
y, the datedwhenehappened, the locationland the event-related keywords k, the generative pro-cess of the model is described as follows:
• For each event e ∈ {1..E}, draw multino-mial distributionsθe ∼ Dirichlet(β), φe ∼
Dirichlet(γ), ψe ∼ Dirichlet(η), ωe ∼
Dirichlet(λ), draw event coordinate ϕe ∼
Normal(0, χ−1I);
• For each tweetwm, m∈ {1..M}
* Choose tweet coordinate: xm ∼
Normal(0, δ−1I);
* Choose an event zm = e ∼
Multinomial({P(e|xm,Φ)Ee=1});
* For each named entity in the tweet
wm, choose a named entity y ∼
Multinomial(θe);
M
N
E
x
e
l
d
y
k
E
θ
φ
ψ
ω
β
γ
η
λ
f
Figure 1: Latent Event Extraction & Visualization (LEEV) Model.
* For each date in the tweetwm, choose a
dated∼Multinomial(φe);
* For each location in the tweet wm,
choose a locationl∼Multinomial(ψe);
* For other words in the tweetwm, choose
a wordk∼Multinomial(ωe).
Here, β, γ, η, λ, χ, δ are priors, I is an identi-ty matrix, and P(e|xm,Φ) is the probability of
the tweetwmwith coordinatexmbelonging to the
evente. It is defined as,
P(e|xm,Φ) = exp(−
1
2 ∥xm−ϕe∥2)
∑E
e′=1exp(−12 ∥xm−ϕe′ ∥2). (1)
It is calculated as the normalized Euclidean dis-tance between a tweet wm and an event e.
Us-ing this equation, when the Euclidean distance be-tween a tweet wm and and an event e is small,
the probability that tweet wm belongs to event e
becomes large. The graphical model of LEEV is shown in Figure 1.
The parameters to be learned are Θ =
{θe, φe, ψe, ωe}Ee=1, tweets’ coordinates X = {xm}Mm=1 and events’ coordinatesΦ = {ϕe}Ee=1,
which are collectively denoted asB=⟨Θ,X,Φ⟩. Let
H(wm, e) = N∏my
n=1
P(yn|θe) N∏md
n=1
P(dn|φe)
N∏ml
n=1
P(ln|ψe) N∏mk
n=1
[image:3.595.321.506.70.222.2] [image:3.595.82.287.70.245.2]The log likelihood ofBgiven tweetsW is,
L(B|W) = ∑M
m=1
log{∑E
e=1
P(e|xm,Φ)×H(wm, e)
}
+
M
∑
m=1
log(P(xm)) + E
∑
e=1
log(P(ϕe))
+∑E
e=1
{log(P(θe)∗P(φe)∗P(ψe)∗P(ωe))}.
(2)
For the events’ coordinateϕeand tweets’
coordi-natexm, we use a Gaussian prior with a zero mean
and a spherical covariance:
p(ϕe) = (2χπ)G2 exp(−χ
2 ∥ϕe ∥2)
p(xm) = (2δπ)G2 exp(−δ
2 ∥xm ∥2).
3.2 LEEV with Manifold Regularization
Recent studies suggest that the intrinsic geome-try of textual data is a low-rank, non-linear man-ifold lying in the high dimensional space (Cai et al., 2008; Zhang et al., 2005). We therefore as-sume that when two tweets wi andwj are close
in the intrinsic geometry of the manifoldΥ, their low-rank representations should be close as well. To capture this assumption, we consider Lapla-cian Eigenmaps (LE) (Belkin and Niyogi, 2003) which has been commonly used in manifold learn-ing algorithms (Le and Lauw, 2014a). It constructs a k-nearest neighbors graph to represent data re-siding on a low-dimensional manifold embedded in a higher-dimensional space. In this paper, we use LE to incorporate neighborhood information of tweets. We construct a manifold graph with edges connecting two data pointswi andwj. Set
the edge weight υij = 1 if wj is one of the
k-nearest neighbors ofwi; Otherwiseυij = 0. That
makes LEEV an special case when ξ = 0. We represent each tweet as a word-count vector, i.e., each element of a vector is weighted by its corre-sponding term frequency, and use cosine similari-ty metric to measure the distance between tweets when constructing the manifold graph. We also tried vectors with the TFIDF weighting strategy to represent tweets and found word-count vectors give better results.
We apply a regularization framework to incor-porate a manifold structure into a learning model. The new regularized log-likelihood functionLis
L(B|W,Υ) =L(B|W)−ξ2R(B|Υ), (3)
whereξ is the regularization parameter. The sec-ond component R is a regularization function, which consists of two parts:
R(B|Υ) =R+(B|Υ) +R−(B|Υ), (4)
R+(B|Υ) =
M
∑
i,j=1;i̸=j
υij · F(wi, wj), (5)
R−(B|Υ) =
M
∑
i,j=1;i̸=j
1−υij
F(wi, wj) + 1, (6)
whereFis a distance function that operates on the low rank space. We define F as the squared Eu-clidean distance of coordinates in the visualization space.F(wi, wj)is computed as follows:
F(wi, wj) =∥xi−xj ∥2 . (7)
MinimizingR+ leads to minimizing the distance
between neighbors and minimizing R− leads to maximizing the distance between non-neighbors. By enforcing manifold learning, we capture the spirit of keeping neighbors close and keeping none-neighbors apart.
3.3 Parameter Estimation
As in Equation 2, the presence of the sum over
e prevents the logarithm form directly acting on the joint distribution. Assuming that the corre-sponding latent event zm of each tweet wm is
known,{W, Z}is called the complete data. Max-imizing the log likelihood of the complete data,
logP(W, Z|B), can be easily done. However, in practice we don’t observe the latent variables Z
and only have the incomplete data W. There-fore, the expectation maximization (EM) algorith-m is ealgorith-mployed to handle the incoalgorith-mplete data. EM involves an efficient iterative procedure to com-pute the Maximum Likelihood estimation of prob-abilistic models with unobserved latent variables involved.
The class posterior probability of themthtweet
under the current parameter values Bˆ, P(zm = e|m,Bˆ), is given as follows:
P(zm =e|m,Bˆ) =
P(zm =e|xˆm,ˆΦ,Bˆ)×H(wm, e)
∑E
e′=1P(zm=e′|xˆm,ˆΦ,Bˆ)×H(wm, e′),
(8)
In M-step, model parametersBare updated by maximizing the regularized conditional expecta-tion of the complete data log likelihood with priors defined as follows:
Q(B|Bˆ) =
M ∑ m=1 E ∑ e=1
{P(zm=e|m,Bˆ)
×log[P(e|xm,Φ)×H(wm, e)]}
+
M
∑
m=1
log(P(xm)) + E
∑
e=1
log(P(ϕe))
+∑E
e=1
{log(P(θe)∗P(φe)∗P(ψe)∗P(ωe))}
−ξ2R(B|Υ),
whereP(zm=e|m,Bˆ)is calculated in E-step.
By maximizingQ(B|Bˆ)w.r.tθey, φed, ψel, ωek,
the next estimates are given as follows,
θey = M
∑
m=1 Nmy∑
n=1I(ymn=y)P(zm=e|m,Bˆ) +β Y ∑ y=1 M ∑ m=1 Nmy∑
n=1I(ymn=y)P(zm=e|m,Bˆ) +Y β
,
φed = M
∑
m=1 Nmd∑
n=1I(dmn=d)P(zm=e|m,Bˆ) +γ D ∑ d=1 M ∑ m=1 Nmd∑
n=1I(dmn=d)P(zm=e|m,Bˆ) +Dγ
,
ψel = M
∑
m=1 Nml∑
n=1I(lmn=l)P(zm=e|m,Bˆ) +η L ∑ l=1 M ∑ m=1 Nml∑
n=1I(lmn=l)P(zm=e|m,Bˆ) +Lη
,
ωek = M
∑
m=1 Nmk∑
n=1I(kmn=k)P(zm=e|m,Bˆ) +λ K ∑ k=1 M ∑ m=1 Nmk∑
n=1I(kmn=k)P(zm=e|m,Bˆ) +Kη
,
whereY, D, L, Kare the total numbers of distinc-t named endistinc-tidistinc-ties, dadistinc-tes, locadistinc-tions, and words ap-peared in the whole Twitter corpus, respectively.
ϕe and xm cannot be solved in a closed form,
and are estimated by maximizing Q(B|Bˆ) using quasi-Newton method. The gradients ofQ(B|Bˆ)
w.r.tϕeandxmare as follows:
∂Q
∂ϕe = M
∑
m=1
p(e|m,Bˆ)(p(e|xm,Φ)−1)(ϕe−xm)
−χϕe,
∂Q
∂xm = E
∑
e=1
p(e|m,Bˆ)(p(e|xm,Φ)−1)(xm−ϕe)
−δxm−ξ2∂R∂x(B|Υ) m ,
where the gradient of R(B|Υ)w.r.t. xm is
com-puted as follows:
∂R(B|Υ) ∂xm =
M
∑
j=1,j̸=m
2υmj(xm−xj)
− M
∑
j=1,j̸=m
2(xm−xj)(F(x1−υmj m, xj) + 1)2.
We set the parameter χ = 0.00005, δ = 0.05,
β = γ = η = λ = 0.1 and run EM algorithm for 50 iterations. Finally we select an entity y, a dated, a locationl and two keywordskwith the highest probabilities to form a tuple⟨y, d, l, k⟩ to represent each potential event.
3.4 Post-processing
In order to filter out spurious events, we calculate the correlation coefficient of each event element. Remove the event element if its correlation coef-ficient is less than a thresholdCeand remove the
event if the sum of the correlation coefficients of all its four event elements is less thanCt.
For an event element A, its correlation coeffi-cient is calculated below:
CA= log
∑
B∈Ω
B̸=A#(A, B)
#(A) , (0)
where Ω is the set of the four event elements
⟨y, d, l, k⟩and#(x)indicates the number of times
x appeared in the whole corpus. We empirically setCeto 0.4 andCtto 4.
4 Experiments
In this section, we firstly describe the datasets used in our experiments and then present the experi-mental results.
4.1 Setup
We choose two datasets for model evaluation. The first one is the First Story Detection (FSD) dataset (Petrovic et al., 2013) (Dataset I) which contains 2,499 tweets published between 7th July and 12th September 2011. These tweets have been man-ually annotated with 27 events, covering a wide range of topics from accidents to science discover-ies and from disasters to celebrity news. We filter out events mentioned in less than 15 tweets since events mentioned in very few tweets are less likely to be significant. The final dataset contains 2,453 tweets annotated with 20 events. This dataset has been previously used for evaluating event extrac-tion models and the state-of-the-art results have been achieved using LEM (Zhou et al., 2015). We also create another dataset, called Dataset II, by manually annotating 1,000 tweets published in December 2010. A total of 20 events are annotat-ed.
y,d,l,k ⟩. The main difference between LEM and our model is that LEM directly estimates the event distribution from the sampled latent event labels, while we derive the distribution from coordinates of tweets and eventsxm, ϕe. We re-implemented
the system described in (Zhou et al., 2015) and used the same evaluation metrics such as preci-sion, recall and F-measure. Precision is defined as the proportion of the correctly identified events out of the system returned events. Recall is de-fined as the proportion of correctly identified true events. For calculating the precision of the 4-tuple
⟨y, d, l, k⟩, we use following criteria:
• Do the entity y, location l, date dand key-word k that we have extracted refer to the same event?
• If the extracted representation contains key-words, are they informative enough to tell us what happened?
As mentioned in Section 2, PE (Iwata et al., 2007) is a nonlinear visualization method which takes a set of class posterior vectors as input and embeds samples in a low-dimensional Euclidean space. By minimizing the sum of Kullback-Leibler divergences, PE tries to preserve the poste-rior structure in the embedding space. In order to evaluate the visualization results, we compare our proposed method with a pipeline approach, even-t exeven-traceven-tion using LEM (Zhou eeven-t al., 2015) fol-lowed by event visualization using PE (Iwata et al., 2007), named as LEM+PE.
4.2 Event Extraction Results
Table 2 shows the event extraction results on the two datasets. LEEV+R is LEEV with manifold regularization incorporated, in which the model parameters are estimated by the EM algorithm de-scribed in Section 3.3. For LEEV and LEEV+R, the number of events, E, is set to 50 for both datasets. For LEEV+R, the number of neighbor-hood sizekis set to 10 and the regularization pa-rameterξis set to 1. For LEM,E is set to 25 for both datasets following the suggestion in (Zhou et al., 2015).
We ran our experiments on a server equipped with3.40GHz Intel Corel i7CPU and8GB mem-ory. The average running time of LEEV is2328.1
[image:6.595.317.507.73.224.2]seconds on Dataset I and940.7seconds on Dataset II for one iteration. The average running time
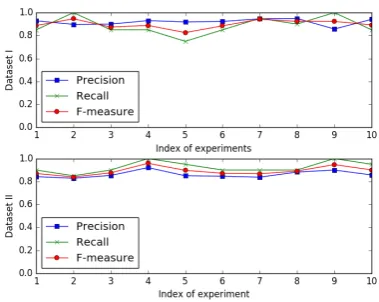
Figure 2: Experimental results of LEEV+R in 10 different runs.
of LEEV+R is 2612.7 seconds on Dataset I and
1296.4seconds on Dataset II for one iteration.
Table 2: Comparison of the event extraction re-sults on the two datasets.
Dataset I
Method Prec. (%) Rec. (%) F-measure (%)
LEM 84.00 76.19 80.35
LEEV 92.10 80.00 85.62
LEEV+R 91.91 88.50 89.88
Dataset II
Method Prec. (%) Rec. (%) F-measure (%)
LEM 80.00 90.00 84.70
LEEV 83.33 95.00 88.78
LEEV+R 86.18 92.50 89.19
It can be observed that both LEEV and LEEV+R outperforms the state-of-the-art result-s achieved by LEM on Dataresult-set I. In particular, LEEV improves upon LEM by over 5% in F-measure and with regularization, LEEV-R further improves upon LEEV by over 4%. A similar trend is observed on Dataset II where both LEEV and LEEV+R outperforms LEM and the best perfor-mance is given by LEEV+R. This shows the ef-fectiveness of using regularization in LEEV. We will further demonstrate its importance in visual-ization results. Overall, we see superior perfor-mance of LEEV+R over the other two models, with the F-measure of over 89% being achieved on both datasets.
Figure 3: The performance of LEEV+R with dif-ferent number of eventsE.
on the two datasets for 10 times using LEEV+R. The experimental results are shown in Figure 2. It can be observed that the performance of LEEV+R is quite stable on both datasets. The standard deviation of F-measure on both Dataset I and I-I is0.036, which shows that random initialization does not have significant impact on the final per-formance of the model.
4.3 Impact of Number of EventsE
We need to pre-set the number of eventsE in the proposed approach. Figure 3 shows the perfor-mance of event extraction based on LEEV+R ver-sus different values of E on the two datasets. It can be observed that the performance of the pro-posed approach improves with the increased value of E and when E goes beyond 50, we notice a more balanced precision/recall values and a rela-tively stable F-measure. This shows that the pro-posed approach is less sensitive to the number of eventsE so long asE is set to a relatively larger value.
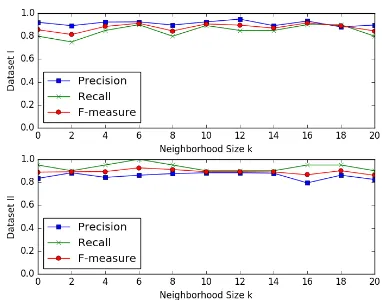
4.4 Impact of Neighborhood Size
As described in Section 3.2, the neighborhood in-formation of tweets is incorporated into the learn-ing framework. A manifold graph with edges con-necting two tweets (or data points) wi andwj is
constructed by setting the edge weight υij = 1
ifwj is among thek-nearest neighbors ofwi and υij = 0 otherwise. Therefore, it is crucial to see
[image:7.595.83.275.75.223.2]whether the performance of LEEV+R heavily de-pends on the setting ofk. Figure 4 shows the per-formance of our proposed approach with different neighborhood sizek. It can be observed that the
Figure 4: The performance of LEEV+R with dif-ferent neighborhood sizek.
performance of LEEV+R is quite stable and inde-pendent of thekvalue.
4.5 Visualization Results
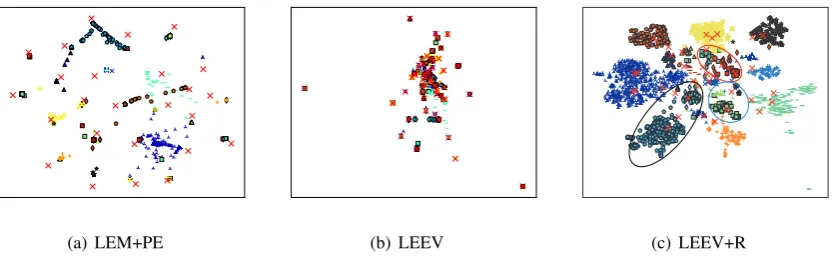
We show the visualization results produced by d-ifferent approaches on the two datasets in Fig-ure 5 and 6 respectively. We compare LEEV and LEEV+R with the pipeline approach LEM+PE. In the figures, each point represents a tweet and d-ifferent shapes and colors represent the dd-ifferent events they are associated with. Each red cross represents an extracted event with coordinateϕz.
For Dataset I, it can be observed from Fig-ure 5(a) that the visualization result generated by LEM+PE is not informative. Tweets from d-ifferent events are mixed together and events are evenly distributed across the whole visualization space. Thus, this visualization does not provide any sensible information about the relationships between tweets and events. The result generated by LEEV without manifold Regularization unitR
(a) LEM+PE (b) LEEV (c) LEEV+R Figure 5: Visualization results on Dataset I.
[image:8.595.90.516.80.383.2](a) LEM+PE (b) LEEV (c) LEEV+R
Figure 6: Visualization results on Dataset II.
debt bill”, respectively. It shows that LEEV+R with manifold learning incorporated significantly improved upon LEEV without regularization and gives better visualization results. The relationship-s of eventrelationship-s are directly reflected in the direlationship-stancerelationship-s between their coordinates in the visualization s-pace.
Similar visualization results have been obtained on Dataset II. Figure 6(a) and 6(b) failed to convey the semantic relations between different events. LEEV+R in Figure 6(c) is good at separating tweets from different events. The events in the red circle are the government activities of the U-nited States. The events in the blue circle are cat-egorized as traffic accidents. They are “ Trans-port chaos caused by heavy snow ”, “Train to Paris crushed ” and “Demonstrators attacked car carry-ing Prince Charles ”. Compared to LEM+PE and LEEV, LEEV+R gives much more informative vi-sualization results.
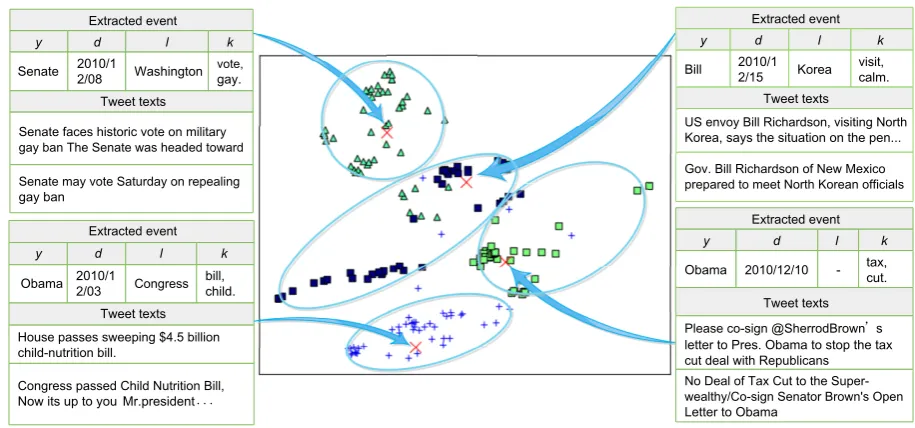
To further analyze the visualization results in more detail, the 4 representative events and their corresponding tweets in the red circle of Fig-ure 6(c) are visualized in FigFig-ure 7. These four events are “Senate vote on repealing gay ban”,
“US state governor plan to visit North Korea”, “Send letter to President Obama to stop tax cut deal” and “Congress passed the Child Nutrition Bill”. Their corresponding tweets are denoted as green ’△’, blue ’2’, green ’2’ and blue ’+’ in-dividually in Figure 7. It can be observed that these four events are all about government activ-ities of the United States, and they are located close to each other in the low-dimensional visu-alization space. Moreover, the tweets describing the same event are located close to each other and center around their corresponding events, while the tweets describing different events are far away from each other.
5 Conclusions
Extracted event
y d l k
Senate 2010/1
2/08 Washington vote, gay. Tweet texts
Senate faces historic vote on military gay ban The Senate was headed toward
Senate may vote Saturday on repealing gay ban
Extracted event
y d l k
Obama 2010/1
2/03 Congress bill, child. Tweet texts
House passes sweeping $4.5 billion child-nutrition bill.
Congress passed Child Nutrition Bill, Now its up to you Mr.president ...
Extracted event
y d l k
Bill 2010/1 2/15 Korea
visit, calm. Tweet texts
US envoy Bill Richardson, visiting North Korea, says the situation on the pen...
Gov. Bill Richardson of New Mexico prepared to meet North Korean officials
Extracted event
y d l k
[image:9.595.68.526.60.274.2]Obama 2010/12/10 - tax, cut. Tweet texts Please co-sign @SherrodBrown’s letter to Pres. Obama to stop the tax cut deal with Republicans No Deal of Tax Cut to the Super-wealthy/Co-sign Senator Brown's Open Letter to Obama
Figure 7: Four representative events and their corresponding tweets in the red circle of Figure 6(c).
Dataset I by nearly 10% in F-measure. Visual-ization results show that the proposed approach with manifold regularization can significantly im-prove the quality of event visualization. These re-sults show that by jointly learning event extrac-tion and visualizaextrac-tion, our proposed approach is able to give better results on both tasks. In fu-ture work, we will investigate scalable and paral-lel model learning to explore the performance of our model for large-scale real-time event extrac-tion and visualizaextrac-tion.
Acknowledgments
We would like to thank the anonymous reviewers for their valuable comments and suggestions. This work was funded by the National Natural Science Foundation of China (61528302), the Innovate UK under the grant number 101779 and the Collabo-rative Innovation Center of Wireless Communica-tions Technology.
References
Pramod Anantharam, Payam Barnaghi, Krishnaprasad Thirunarayan, and Amit Sheth. 2015.
Extract-ing city traffic events from social streams. ACM
Transactions on Intelligent Systems and Technology, 6(4):e110206.
Mikhail Belkin and Partha Niyogi. 2003. Laplacian eigenmaps for dimensionality reduction and data
representation. Neural Comput., 15(6):1373–1396,
June.
Edward Benson, Aria Haghighi, and Regina Barzi-lay. 2011. Event discovery in social media feeds. In Proceedings of the 49th Annual Meeting of the Association for Computational Linguistics: Human Language Technologies - Volume 1, pages 389–398, Stroudsburg, PA, USA. Association for Computa-tional Linguistics.
Deng Cai, Qiaozhu Mei, Jiawei Han, and Chengxiang Zhai. 2008. Modeling hidden topics on document
manifold. InProceedings of the 17th ACM
Confer-ence on Information and Knowledge Management, CIKM ’08, pages 911–920, New York, NY, USA. ACM.
Joan Capdevila, Jess Cerquides, Jordi Nin, and Jor-di Torres. 2015. Tweet-scan: An event Jor-discovery
technique for geo-located tweets. In Artificial
In-telligence Research and Development: Proceedings of the 18th International Conference of the Catalan Association for Artificial Intelligence, volume 277, pages 110–119.
Thomas Hofmann. 1999. Probabilistic latent semantic
indexing. InProceedings of the 22nd Annual
Inter-national ACM SIGIR Conference on Research and Development in Information Retrieval, SIGIR ’99, pages 50–57, New York, NY, USA. ACM.
Tomoharu Iwata, Kazumi Saito, Naonori Ueda, Sean Stromsten, Thomas L. Griffiths, and Joshua B. Tenenbaum. 2007. Parametric embedding for class
visualization. Neural Computation, 19(9):2536–56.
Tomoharu Iwata, Takeshi Yamada, and Naonori Ue-da. 2008. Probabilistic latent semantic visualiza-tion: Topic model for visualizing documents. In
Tuan M. V. Le and Hady W. Lauw. 2014a. Manifold learning for jointly modeling topic and visualization. In Proceedings of the Twenty-Eighth AAAI Con-ference on Artificial Intelligence, AAAI’14, pages 1960–1967. AAAI Press.
Tuan M.V. Le and Hady W. Lauw. 2014b. Semantic
vi-sualization for spherical representation. In
Proceed-ings of the 20th ACM SIGKDD International Con-ference on Knowledge Discovery and Data Mining, KDD ’14, pages 1007–1016, New York, NY, USA. ACM.
Ezequiel L´opez-Rubio, Jos´e Mu˜noz-P´erez, and Jos´e Antonio G´omez-Ruiz. 2002. Self-organizing
dynamic graphs. Neural Processing Letters,
16(2):93–109(17).
David McClosky, Mihai Surdeanu, and Christopher D. Manning. 2011. Event extraction as dependency
parsing. InProceedings of the 49th Annual
Meet-ing of the Association for Computational LMeet-inguistic- Linguistic-s: Human Language Technologies - Volume 1, HLT ’11, pages 1626–1635, Stroudsburg, PA, USA. As-sociation for Computational Linguistics.
Jeremy Millar, Gilbert Peterson, and Michael Menden-hall. 2009. Document clustering and visualization with latent dirichlet allocation and self-organizing
maps. InProceedings of Florida Artificial
Intelli-gence Research Society Conference.
Yusuke Nakaji and Keiji Yanai. 2012. Visualization of real-world events with geotagged tweet photos. In
Proceedings of the 2012 IEEE International Confer-ence on Multimedia and Expo Workshops, ICMEW ’12, pages 272–277, Washington, DC, USA. IEEE Computer Society.
Minh-Tien Nguyen, Asanobu Kitamoto, and Tri-Thanh Nguyen. 2015. Tsum4act: A framework for re-trieving and summarizing actionable tweets during
a disaster for reaction. InAdvances in Knowledge
Discovery and Data Mining, pages 64–75. Springer.
Saˇsa Petrovic, Miles Osborne, Richard McCreadie, Craig Macdonald, Iadh Ounis, and Luke Shrimpton. 2013. Can twitter replace newswire for breaking
news? InProceedings of the 7th International AAAI
Conference on Weblogs and Social Media.
Yu Wang, David Fink, and Eugene Agichtein. 2015. Seeft: Planned social event discovery and attribute extraction by fusing twitter and web content. In
Proceedings of the Ninth International AAAI Con-ference on Web and Social Media, pages 483–492.
Dell Zhang, Xi Chen, and Wee Sun Lee. 2005. Text classification with kernels on the multinomial
mani-fold. InProceedings of the 28th Annual
Internation-al ACM SIGIR Conference on Research and Devel-opment in Information Retrieval, SIGIR ’05, pages 266–273, New York, NY, USA. ACM.
Deyu Zhou, Liangyu Chen, and Yulan He. 2014. A simple bayesian modelling approach to event
extrac-tion from twitter. InProceedings of the 51st Annual
Meeting of the Association for Computational Lin-guistics (ACL), pages 700–705. ACL.
Deyu Zhou, Liangyu Chen, and Yulan He. 2015. An unsupervised framework of exploring events on twitter: Filtering, extraction and categorization. In