Published Online December 2012 in SciRes (http://www.SciRP.org/journal/ce) http://dx.doi.org/10.4236/ce.2012.38202
Writing Performance, Practices and Locus of Control of the Five
Linguistic Groups in Canada
Yamina Bouchamma
1, Catherine Ruel
2, Marc Basque
31Department Foundations and Practices in Education, Laval University, Quebec, Canada 2Department of Studies on Teaching and Learning, Laval University, Quebec, Canada
3Department of Kinesiology and Recreation, Moncton University, Moncton, Canada Email: [email protected]
Received September 9th, 2012; revised October 12th, 2012; accepted October 25th, 2012
A study with students from the five linguistic groups in Canada were shown to not succeed at the same level. Francophone students performed better, followed by multilingual, anglophone, allophone, and abo- riginal students. Allophones tended to use a more internal locus of control. Students who spoke a Native language were shown to spend the least amount of time writing on the Internet compared to the multilin- gual and anglophone students who spent the most amount of time, and allophones spent the most time outside of class hours working on homework unrelated to writing and doing activities associated with learning to write.
Keywords: Linguistic Group; Writing; Academic Achievement; Locus of Control; Immigrants
Introduction
Knowing an official language is considered to be essential to an individual’s economic and social integration (Jedwab, 2005). Not knowing the language is the primary source of all of the difficulties in school that lead to academic failure (Blackwell & Melzak, 2000), cultural and social isolation (Long & Amaya, 2007), or a sense of significant distress (Ditisheim, 1990). In contrast, mastering the language is the key to any knowledge acquisition (Loyer, 1987; Moisset, Mellouki, Ouellet, & Diam- bomba, 1995). Indeed, language is crucial from the start when welcoming and integrating children who know neither English nor French.
Reading and writing abilities are particularly important for children long term, as they contribute not only in ensuring their self-determination, their social mobility, their successful inte- gration within society, and their academic achievement, and also in providing greater economic possibilities in the future (Carter, Polevychock, & Friesen, 2006).
Canada and other (Organisation for Economic Cooperation and Development) OECD countries show significant differ- ences in performance associated with the language spoken in the home, even if the level of education and professional status of the parents is taken into account (OECD, 2007).
Literature Review
In a study of 230,000 newly arrived immigrant children and adolescents, the Canadian Council on Social Development found that learning the language (English or French) and the difficulties with homework represented significant challenges (Kunz & Hanvey, 2000). A Statistics Canada National Longi- tudinal Survey of Children and Youth (NLSCY, 2001) revealed that, on average, immigrant children succeeded as well as did children of persons born in Canada in every aspect of academic
French obtained high outcomes in reading compared to those for whom the language spoken at home was neither English nor French. However, after a certain number of years in the Cana- dian school system, the level of achievement of these children in reading was shown to come close to that of children of Ca- nadian-born parents. The findings show that on almost every aspect, 13 year-old immigrant children generally scored as well as did children born in Canada (Statistics Canada, 2001).
The Programme for International Student Assessment (PISA) later showed that Canada figured among the countries in which performance differences were relatively non-significant between immigrant students and those of the host country who had gen- eral access to established linguistics programmes with clearly defined standards and objectives (OECD, 2006).
The results were similar in the province of Québec where the number of immigrant students in difficulty in school (all lan- guages combined) steadily decreased from 30.3% (1994-1995) 27% (1997-1998), 24.6% (2000-2001), and 21.7% (2003-2004) and that these difficulties were predominant in high school years rather than primary school. In fact, the early problems for at-risk students were shown to increase over time (Marchesi, 1998). Other smaller studies have also shown various risk fac- tors that affect the academic achievement of immigrant students (Van Ngo & Schleifer, 2005). These factors are numerous, such as individual, socioeconomic, and cultural characteristics (fam- ily income, country of origin, religion, language spoken in the home, education level of the parents, etc.) (Marchesi, 1998) and school-related factors (ethnic composition of the school and the means employed by each school to facilitate learning (Moisset et al., 1995).
Writing Performance
tariat, Human Resources Development Canada and the Organi- sation for Economic Cooperation and Development, 1997).
The individuals who master reading and writing can change and adapt to new situations as well as demonstrate overall bet- ter health (Public Health Agency of Canada). In a school setting, writing performances appear to be a prerequisite for learning other subjects. The Thayer & Giebelhauss study (2001) showed the positive effect of writing skills on mathematic performances.
Therefore, the literature shows that successful writing de- pends on several factors such as individual, academic, and so- cial, more specifically the strategic behavior of the student, knowledge, motivation, socio-economic level (Graham, Harris, & Mason, 2005), and language status (minority or majority), as is the case in Canada where the Francophone minority performs less well than Anglophones (Childs & Denomme, 2008; Bou- chamma & Lapointe, 2008).
The Locus of Control
How we explain success and failure influences practices and decisions (Bandura, 1986; Pajares, 1992). These causal expla- nations are subjective and vary according to four attribution variables: 1) locus of control (Heider, 1958; Rotter, 1966); 2) stability (Weiner, Heinz, Meyer, & Cook, 1972); 3) controlabil- ity (Heider); and 4) globality (Abramson, Seligman, & Teasdale, 1978). Locus of control, the most studied dimension of the attri- bution theory (Bell-Dolan & Anderson, 1999), was chosen for the present study. In essence, the causes may be internal (per- sonality factors) or external (circumstances of the situation), and how an individual interprets success/failure may vary de- pending on their own characteristics, including culture (Berry et al., 1997).
Academic Achievement and Student Attributions
In Canada, the School Achievement Indicators Program (SAIP, Sciences, 1996) revealed a positive relationship between per- formance and the fact of attributing success to hard work. Re- search in this area has also shown a positive link between aca- demic achievement and attribution style (Cortes-Suarez, 2005).
Methodology
Participants and Data Collection Instrument
The present study used data collected through the School Achievement Indicators Program—Writing Assessment III (SA- IP, 2002) developed by the Council of Ministers of Education of Canada (CMEC). This program gathered information on 23,680 13- and 16-year-old students from a total of 17 differ- ent populations representing all ten Canadian provinces, the Northwest Territories, and Yukon on writing achievement. Stu- dents completed the Student Questionnaire which was admin- istered in one of the two official Canadian languages (English and French). For the purpose of our study, only the 13-year- old students (12,708; 6062 boys) were used in our sample. A large majority of these students (95.1%) are Canadian-born. Se- venty-six percent of the 13-year-old students completed the as- sessment in English. The SAIP studentquestionnaire contains a total of fifty-five questions. For the present study, specific ques- tions pertaining to languagespokenathome (question 8), locus ofcontrol (question 23), schoolpractices (questions 32, 36 - 42),
and extracurricularpractices (questions 19 - 20) were selected.
Measures
First, a new variable was created based on the four presented items (English, French, Aboriginal language, and Other) of “Which of these languages is (are) spoken in your home?”
(question 8). This question required students to answer “often
spoken” or “occasionally spoken” for languages specific to
them. Students were assigned to a specific language group ac- cording to which language they answered “often spoken” (1-
Anglophones, 2-Francophones, 3-Aboriginal language, 4-Al- lophones). Next, a fifth category, called Multilingual has been
added in order to dispatch students who answered “often” to two or more languages. Then, 8512 students were assigned to the Anglophones group; 1895 to the Francophones group; 53 to
the Aboriginal language group; 362 to the Allophone group;
and 1028 to the Multilingual group. This distribution is consis-
tent with the Canadian linguistic distribution obtained through the 2001 Census (www.statcan.gc.ca).
The locusofcontrol concept was represented by a group of 15 statements. The students were asked to respond to each statement on a scale of A to D (A: strongly disagree, B: dis- agree, C: agree, and D: strongly agree). A factorial analysis enabled us to identify two dimensions: internal and external. The internallocusofcontrol dimension consisted of eight items (one of which was eliminated to improve internal consistency), such as “To writewell, I must... work hard”, “WhenI get an exceptionally low score on a French paper, it’s mainly be- cause...Ididn’tstudyenough”, and “WhenIgetanexception- ally high score on a French/English paper, it’s mainly be- cause... the course was welltaught” (α = .64). The external locusofcontrol dimension consisted of seven items, including
“WhenIgetanexceptionallylowscoreonaFrenchpaper, it’s mainly because... theteacher wastoo strict”, “WhenI getan exceptionallyhighscoreonaFrenchpaper, it’sbecause...the coursewaseasy”, and “WhenIgetanexceptionallyhighscore onaFrenchpaper, it’smainlybecause...Iwaslucky” (α = .68).
Two questions (19 and 20) used to measure the variable “ex-
tracurricular practices” were respectively ranged on a scale
from A to F (A: no time, B: less than 1 hour, C: 1 - 2 hours, D: 3 - 4 hours, E: 5 - 6 hours, and F: more than 6 hours) and on a scale from A to D (A: rarely or never, B: a few times a month, C: a few times a week, and D: almost every day). Factorial analyses were performed on the statements pertaining to extra- curricular practices so as to construct six new independent variables: learning-related activities outside of class hours (a19), homework unrelated to writing (b19), using a computer outside of class hours (c19), writing different literary genres (poetry, letters, etc.) outside of class hours (a20), writing on a computer on the Internet (b20), and reading for different reasons outside of class hours (c20).
Regarding the variable “school practices”, eight questions
quantity of independent variables to eighteen. The independent variables related to school practices will be the following: using metacognitivestrategiesinwriting (a32), using metacognitive strategiesinwritingII (b32), discussionwithothersaboutmy text (c32), usefulnessofthetext (d32), basicwritingexercises
(a36), choiceoftextsubjectsandgenres (b36), choiceofsub- jectandliterarygenre (c36), teamworkinwritingthetext (d36), writingofdifferentliterarygenres (e36), explanationrelatedto learningtowrite (a37), classclimate (b37), readingoftextsby theteacherorthestudents (c37), useofdifferentresourcesby the student for writing (a38), use of different resources for teaching (b38), amountofwritinginFrenchclass (a39), amount ofwritingincoursesotherthanFrench (a40), writingatlength inallofthecourses (a41), and writingexplanationandevalua- tion (a42).
The dependent variable in this study was determined as “stu- dent achievement in writing”. This variable was based on the results of a student essay used to measure the students’ writing performance. Students were assessed on their writing skills and the knowledge they expressed through their writing. According to the specific criteria for each performance level, 13 year old students were expected to perform at a level 2 or better. There-fore, an assignation to level 2 orupper meant that they success-
fully achieved the writing assessment while an assignation to
level 1 indicated that they did not achieve properly the assess-
ment (failure). For the purpose of this study, students who per- formed at level 2 or better were all assigned to create the suc- cessful group. A chi-square test was conducted to assign stu-
dents into each writing achievement level while controlling for their language group attribution.
Analyses
All of the analyses were performed using SPSS software, ver- sion 13.0. A preliminary chi-square test was performed to ver- ify whether the percentage of students who passed/failed dif- fered among the different linguistic groups. Thereafter, ANO- VA variance analyses were undertaken to identify any differ- ences between the groups in terms of locus of control, school practices, and extracurricular practices.
Results
[image:3.595.311.538.85.209.2]Writing Achievement
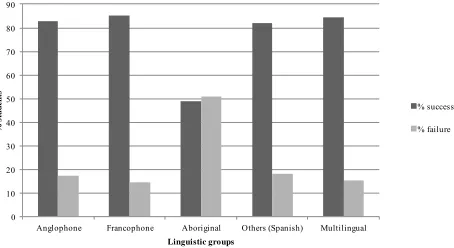
Figure 1 presents the proportion of students who succeeded
and failed the writing assessment, according to linguistic group. Overall results indicate that 83.2% of 13-year-old students (all linguistic groups combined) successfully achieved the writing assessment while 16.8% did not. The chi-square test revealed significant differences between success and failure in the dif-
ferent linguistic groups, [χ2 = 51.039,
p < .001]. Specifically, in
the francophone group, the proportion of students who suc- cessfully achieved the assessment (85.3%) was significantly higher than expected. On the other hand, fewer students than expected did not achieve it properly (14.7%). Nevertheless, the opposite pattern was observed for the students who spoke an aboriginal language (success: 49.0%; failure: 51%). Our find- ings show no significant difference in the proportions obtained by the anglophone students (success: 82.8%; failure: 17.2%),
0 10 20 30 40 50 60 70 80 90
Anglophone Francophone Aboriginal Others (Spanish) Multilingual
% s
tud
en
ts
Linguistic groups
% success
% failure
Figure 1.
Success and failure levels of the five linguistic groups.
Locus of Control
An analysis of variance (ANOVA) was performed to deter- mine whether the internal or external factors attributed to a
successful or a failed performance differed depending on the
language spoken at home. Table 1 illustrates the results of this analysis. Our results show significant differences with regard to the internal factors attributed to the success or the failure of the assessment and the language spoken at home by students, [FWelch (4,357,380) = 16.560, p < .001]. Compared to the four other
linguistic groups, the allophone students (M = 3.01; SD = .45)
displayed a stronger tendency to attribute their success or their failure to internal factors (anglophone: M = 2.92; SD = .42;
francophone: M = 2.83; SD = .47; aboriginal: M = 2.81; SD
= .62; multilingual: M = 2.92; SD = .48).
Extracurricular Writing Practices
An analysis of variance (ANOVA) was conducted to deter- mine whether the students’ extracurricular practices differed according to their language spoken at home. Table 2 presents
the results observed in terms of the time each linguistic group spent on the different extracurricular writing activities, for which significant differences were noted. Generally speaking, all of the students (all linguistic groups combined) revealed spending an important amount of time in activities involving a computer and spending far less time on extracurricular practices involv- ing writing different literary genres such as poetry, letters, and songs compared to other writing activities such as stories and in a journal. Specifically, the aboriginal students (M = 2.33; SD = 1.08) answered spending the smallest amount of time writing on the computer on the Internet while the multilingual students (M = 2.82; SD = 1.00) and anglophone students (M = 2.80; SD
= 1.04) reveal the highest scores on this category. Finally, the allophone students reported spending much more time outside of class hours doing activities associ- ated with learning about writing (M = 2.98; SD = .98) and to doing homework unrelated
to writing outside of class hours (M = 2.12; SD = 1.09) compare
to the other four linguistic groups.
Writing Practices in School
Table 1.
ANOVA of internal and external locus of control for each linguistic group.
Anglophones Francophones Aboriginals Allophones Multilingual Dimension
M (SD) M (SD) M (SD) M (SD) M (SD) F Df
Internal 2.92 (.42) 2.83 (.46) 2.81 (.62) 3.01 (.45) 2.92 (.48) 16.560*** 357.380
External 2.32 (.48) 2.32 (.50) 2.18 (.48) 2.31 (.52) 2.30 (.51) 1.694 781.732
[image:4.595.57.539.213.321.2]Note: ***p < .001.
Table 2.
ANOVA of time spent on extracurricular practices according to the linguistic group.
Anglophones Francophones Aboriginals Allophones Multilinguals Independent variables
M (SD) M (SD) M (SD) M (SD) M (SD) F Df
a19 2.69 (.92) 2.59 (.87) 2.12 (.86) 2.98 (.98) 2.88 (.99) 29.787*** 832.402 b19 1.89 (.94) 2.11 (.99) 1.85 (1.05) 2.12 (1.09) 2.14 (1.04) 29.351*** 627.875 c19 3.26 (1.08) 3.18 (1.12) 2.91 (1.28) 3.35 (1.14) 3.42 (1.11) 10.064*** 11 720 a20 1.49 (.58) 1.53 (.59) 1.60 (.61) 1.55 (.59) 1.58 (.63) 6.474*** 673.983 b20 2.80 (1.04) 2.61 (1.03) 2.33 (1.08) 2.77 (1.00) 2.82 (1.00) 15.705*** 591.412 c20 2.26 (.72) 2.17 (.68) 2.11 (.80) 2.30 (.73) 2.36 (.75) 11.246*** 544.331
Note: ***
[image:4.595.58.542.368.634.2]p < .001.
Table 3.
ANOVA of the average time spent for school practices.
Anglophones Francophones Aboriginals Allophones Multilinguals Independent variables
M (SD) M (SD) M (SD) M (SD) M (SD) F Df
a32 2.37 (.59) 2.12 (.59) 2.56 (.66) 2.32 (.60) 2.20 (.60) 81.556*** 11 704 b32 2.47 (.59) 2.34 (.54) 2.69 (.68) 2.47 (.58) 2.36 (.59) 25.248*** 437.180
c32 2.84 (.70) 2.86 (.67) 2.96 (.72) 2.85 (.69) 2.77 (.72) 3.057* 622.786
d32 3.19 (.64) 3.19 (.62) 3.16 (.69) 3.09 (.69) 3.07 (.70) 8.072*** 634.933
a36 2.65 (.78) 3.04 (.74) 2.67 (.83) 2.80 (.80) 2.81 (.80) 94.239*** 576.291
b36 2.60 (.62) 2.59 (.67) 2.44 (.69) 2.68 (.65) 2.65 (.67) 3.045* 602.911
c36 2.03 (.59) 2.03 (.61) 2.06 (.54) 2.07 (.59) 2.09 (.62) 2.641* 868.407
d36 2.10 (.75) 1.75 (.73) 2.10 (.82) 2.15 (.81) 2.07 (.79) 76.016*** 573.555 e36 2.16 (.63) 1.97 (.65) 2.24 (.63) 2.26 (.65) 2.19 (.68) 37.393*** 744.206
a37 2.81 (.62) 2.90 (.57) 2.79 (.61) 2.82 (.58) 2.83 (.63) 8.985*** 655.583
b37 2.78 (.84) 2.27 (.86) 2.56 (.82) 2.61 (.82) 2.67 (.88) 141.050*** 11 607 c37 2.57 (.71) 2.35 (.73) 2.65 (.89) 2.61 (.75) 2.52 (.73) 30.532*** 418.591 a38 2.05 (.66) 1.86 (.63) 2.16 (.88) 2.05 (.69) 2.07 (.70) 29.291*** 365.081 b38 2.04 (.75) 1.84 (.74) 2.12 (.85) 2.04 (.83) 2.00 (.77) 25.709*** 531.658
a39 3.91 (.98) 3.95 (.95) 3.78 (1.11) 3.87 (.97) 3.97 (.95) 1.847 465.974
a40 3.13 (.91) 3.25 (.88) 2.78 (1.12) 3.10 (.90) 3.24 (.88) 10.999*** 391.172 a41 2.35 (.73) 2.28 (.68) 2.14 (.87) 2.39 (.71) 2.46 (.75) 10.850*** 420.870 a42 2.57 (.80) 2.40 (.79) 2.55 (.81) 2.71 (.77) 2.60 (.81) 22.671*** 11 605
Note: ***p < .001. ** p < .01. *p < .05.
francophone, and anglophone students to the writing practices bloc “discussion withothersaboutmytext” (c32) [FWelch (4,622, 786) = 3.057, p < .05], and “usefulnessofthetext” (d32) [FWelch (4, 634,933) = 8.072, p < .001]. Francophone and anglophone stu-
dents reported a greater tendency on these two dimensions compared with their multilingual peers. Noticeable differences were also identified between groups on “classclimate” (b37).
Anglophone students revealed spending more time on writing
tasks in class than their francophone and allophone counterparts [F(4,11 607) = 141.050, p < .001]. Nevertheless, allophone stu-
dents still report spending more time on writing tasks in class than their French counterparts, who reported occasionally spen- ding time on in-class writing activities.
for writing” (a38). Indeed, francophone students reported the
lowest frequency of out loud readings in their class compared to the four other linguistic groups, [FWelch (4,418.591) = 30.532, p
< .001]. Among all five linguistic groups, francophone students revealed referring less frequently to other resources such as Internet, a computer, and the library, [FWelch (4,365.081) = 29.291, p
< .001].
Finally, the results showed significant differences between the linguistic groups on the variable “writingexplanationand evaluation” (a42), [F(4,11 605) = 22.671, p < .001]. Allophone
students reported requiring more frequent explanations and evaluations related to their writing in their “courses other than French” compared to their francophone, anglophone, and multi- lingual counterparts.
Discussion and Conclusion
This study was conducted using the cross-country data ob- tained from the the School Achievement Indicators Program— Writing III (SAIP, 2002). Our findings show that the five lin- guistic groups in Canada do not perform at the same level. In order, the francophone students achieved the highest scores, followed by the multilingual, anglophone, allophone, and abo- riginal students.
Similar achievement levels were observed between allophone students and the other groups, with the exception of the abori- ginal students, who failed in approximately 60% of cases. This observation concurs with results of other studies showing that immigrant children who initially have weak outcomes in Cana- dian schools catch up to non-immigrant children in reading, wri- ting, and mathematics around the age of 13 (Worswick, 2001).
Regarding the locus of control, we found that compared to the other linguistic groups, the allophone students had a ten- dency to refer to a more internal locus of control. Studies indi- cate that an internal locus of control increases the level of mo- tivation. This aspect was mentioned by the OECD who noted the motivation and positive attitude of immigrant students with regard to school and who recommended that schools take the necessary actions to facilitate learning for this specific student population in order to help them succeed (OECD, 2006).
As for the extracurricular practices, allophone students were shown to spend the most amount of time outside of class hours doing activities associated with learning to write and to home- work unrelated to writing outside of class hours.
A more recent Programme for International Student Achieve- ment (PISA) showed that Canada was one of the countries in which performance differences were relatively non-significant between immigrant students and those of the host country who generally benefited from established language support pro- grams with clearly defined objectives and norms (OECD, 2006). However, this same organization stated that Canada, along with other OECD countries, showed significant performance differ- ences associated with the language spoken in the home, despite the education and professional status of the parents (OECD, 2007).
Moreover, if we examine the practices teachers must adopt to improve the academic achievement of allophones—which is so close to that of the other linguistic groups (with the exception of aboriginal students), we may conclude that no “universal” solution exists for immigrant students. Immigrants in Canada
therefore depends on target programmes (McAndrew et al., 2009).
Regarding the allophone students who participated in this study, their characteristics are unknown (number of years since their arrival in Canada, whether they went through preparatory programmes), thus we ultimately question whether this sample is representative of all immigrant students, including those with learning difficulties.
REFERENCES
Abramson, L., Seligman, M., & Teasdale, J. (1978). Learned helpless- ness in humans: Critique and reformulation. Journal of Abnormal Psychology, 87, 49-74. doi:10.1037/0021-843X.87.1.49
Bandura, A. (1986). Socialfoundationsofthoughtandaction:Asocial cognitivetheory. Englewood Cliffs, NJ: Prentice-Hall.
Bell-Dolan, D., & Anderson, C. A. (1999). Attributional processes: An integration of social and clinical psychology. In R. M. Kowalski, & M. R. Leary (Eds.), Thesocialpsychologyofemotionalproblems (pp. 37-68). Washington: American Psychological Association. doi:10.1037/10320-002
Berry, J. W., Segall, M. H., & Kagitçibasi, C. (1997). Handbook of cross-cultural psychology. In Socialbehaviorandapplications (2nd ed.). Needham Heights, MA: Allyn & Bacon.
Blackwell, D., & Melzak, S. (2000). Farfromthebattlebutstillatwar: Troubledrefugeechildreninschool. London: Child Psychotherapy Trust.
Bouchamma, Y., & Lapointe, C. (2008). Success in writing and attri- butions of 16-year-old French-speaking students in minority and majority environments. TheAlbertaJournalofEducationalResearch, 54, 194-209.
Carter, T., Polevychock, M., & Friesen, A. (2006). Winnipeg’s inner city: Research on the challenges of growing diversity. Our Diverse Cities, 2, 55-61.
Cortes-Suarez, G. (2005). Causal attributions for success or failure by passing and failing students in college algebra. Abstracts Interna- tionalSectionA:HumanitiesandSocialSciences, 66, 486.
Ditisheim, M. (1990). Multi-care: The integration of immigrant chil- dren in child care. PetitàPetit, 8, 7-12.
Graham, S., Harris, K., & Mason, L. (2005). Improving the writing performance, knowledge, and self-efficacy of struggling young writ- ers: The effects of self-regulated strategy development. Contempo- rary Educational Psychology, 30, 207-241.
doi:10.1016/j.cedpsych.2004.08.001
Heider, F. (1958). Thepsychologyofinterpersonalrelations. New York: Wiley. doi:10.1037/10628-000
Human Resources and Development Canada, Organisation for Econo- mic Cooperation and Development, and Statistics Canada (1997). Li- teracyskillsfortheknowledgeofsociety:Furtherresultsfromthe internationaladultliteracysurvey. Paris: Organisation for Economic Cooperation and Development and Ottawa, Ottawa, ON: Human Re- sources and Development Canada and Statistics Canada.
Jedwab, J. (2005). Neither finding nor losing our way: The debate over Canadian multiculturalism. CanadianDiversity, 4, 95-102. Kunz, J. L., & Hanvey, L. (2000). Research report of the Canadian
council on social development, Ottawa, Ontario.
Long, N., & Amaya, B. (2007). “We” and “the others”: Cultural iden- tity among Latin Americans in rural new Brunswick. Our diverse Cities, 3, 155-160.
Loyer, L. (2007). Ethnological portrait of students in schools CECM, French regions, Deuxième partie. Montréal: CECM.
Marchesi, A. (1998). Meeting the needs of students at risk. Education Canada, 38, 22-30.
Quebec’s cultural communities and theiracademic performance. Sainte-Foy, QC: Université Laval, Centre de recherche et d’inter- vention sur la réussite scolaire (CRIRES).
Organisation for Economic Cooperation and Development (OECD) (2006). Attracting, developing and retaining effective teachers— Final report: Teachers matter. URL (last checked 12 April 2008). http://www.oecd.org/edu/preschoolandschool/attractingdevelopingan dretainingeffectiveteachers-homepage.htm
Organisation for Economic Cooperation and Development (OECD) (2007). Education at a Glance. The OECD indicators. Canadian profile. Ottawa: The Council of Ministers of Education, Canada. Pajares, M. F. (1992). Teachers’ beliefs and educational research: Clea-
ning up a messy construct. ReviewofEducationalResearch, 62, 307- 332.
Rotter, J. B. (1966). Generalized expectancies for internal versus exter- nal control of reinforcement. PsychologicalMonographs, 80, 1-28. doi:10.1037/h0092976
Statistics Canada (2001). Visible minority groups and immigrant sta- tus and period of immigration for population, 2001 census. URL (last checked 12 April 2008).
http://www12.statcan.gc.ca/english/census01/products/standard/them es/Rp-eng.cfm?TABID=3&LANG=E&A=R&APATH=3&DETAIL =1&DIM=0&FL=A&FREE=0&GC=01&GID=431515&GK=1&GR P=1&O=D&PID=62913&PRID=0&PTYPE=55430,53293,55440,55 496,71090&S=0&SHOWALL=0&SUB=0&Temporal=2001&THE ME=44&VID=0&VNAMEE=&VNAMEF=&D1=0&D2=0&D3=0& D4=0&D5=0&D6=0
Statistics Canada (2001). National longitudinal survey of children and youth (NLSCY).URL (last checked 12 April 2008).
http://www23.statcan.gc.ca/imdb/p2SV.pl?Function=getSurvey&Sur vId=4450&SurvVer=1&InstaId=16044&InstaVer=4&SDDS=4450& lang=fr&db=IMDB&dbg=f&adm=8&dis=2
Thayer, J., & Giebelhauss, C. (2001). Integrating writing to improve math achievement. Mid-WesternEducationalResearcher, 14, 11-16. Van Ngo, H., & Schleifer, B. (2005). Look at children and young im-
migrants. CanadianIssues-ThèmesCanadiens, printemps.