Method for Improving the Lateral Resolution of
Near-Infrared (NIR) Single Optods: Application to
Subcutaneous Vein Detection and Localization
Yasser S. Fawzy1,2
1
Inovia Technologies Ltd., Vancouver, Canada 2
National Laser Institute, Cairo University, Cairo, Egypt Email: [email protected]
Received September 11,2012; revised October 13, 2012; accepted October 24, 2012
ABSTRACT
NIR backscattering measurements using single source-detector optical probe (optods) can detect absorption areas within deep tissue layer. However, such optods, are characterized by large separation distance between the source and detec- tors (>2 cm) and poor lateral resolution (>1 cm), which limits its usage for the localization of small absorption volumes embedded deep within the tissue such as subcutaneous veins. In this work a method to improve the accuracy of locating such absorption volumes (areas) using backscattered NIR measurements is suggested and investigated with the aim of developing an optical sensor for detecting and localizing large subcutaneous veins. The method is based on measuring the differential signal from three overlapping source-detector pairs arranged within the probe such that the total photon sensitivity profile of the probe is maximized along a narrow width area (within the central of the probe) and minimized along its sides. The location of the absorption areas is then determined when a peak maximum of the measured signal is detected. Monte Carlo simulation and light transport modeling was used to determine the optimum arrangement of each source-detector pair within the probe to create the required spatial sensitivity profile and demonstrate the validity of the method. The results showed that the differential optode has more than two times improvement in the lateral resolution compared to the standard optode. The result also showed that the differential probe can locate subcutaneous veins with diameter ~5 mm and embedded at ~1.5 cm depth. The method could have a potential for designing and developing an optical backscattering sensors for detecting and localizing large subcutaneous veins embedded <2 cm depths.
Keywords: Reflectance Measurements; Photon Migration; Optical Diagnosis; Fiber Probe Design
1. Introduction
NIR diffuse reflectance measurements and spectroscopy is simple and portable optical diagnostic technique that can be used to detect and to monitor the alteration in tis- sue physiology and/or pathology, by measuring the change in absorption coefficient related to such alteration. Several different types of NIR instruments in the CW domain [1], frequency-domain [2], and time-domain [3] have been developed over the past 20 years to measure changes in tissue oxygenation, perfusion, and brain ac- tivity [4-7]. Depending on the source-detector separation, among other parameters, NIR reflectance measurements can detect absorption changes from areas or volumes that are 2 - 3 centimeters deep within the tissues [8,9]. How- ever the lateral spatial resolution for such single source- detector arrangement is typically larger than 1 cm for absorption areas located within such depths [10,11]. This would limit the application of such probes in the ap-
plications that require detecting as well as localizing the lateral position of the measured absorption areas within deep tissue layers.
2. Method
2.1. Probe Design Method
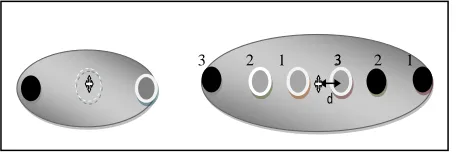
Our design method is based on measuring the differential signal obtained using multiple overlapping source-de- tector pairs interrogate common area (or volume) within the tissue. The multiple source-detector pairs were ar- ranged such that the probe photon sensitivity profile is maximized within a narrow area (volume) along the cen- ter of the probe. In particular, we have used in this design, three source-detector pairs arranged such that one pair in the probe center and the other two arranged at symmetri- cal distance from the probe center as shown in Figure 1(b). The two detectors at the side of probe are assumed to have a similar distance (d) from the center of the probe. The differential probe signal Idiff is equal to
I1 I3 2 I 2
where I1, I2, I3 are the intensity meas- ured by the first, second (central) and third source--tector pairs respectively. Monte Carlo simulation, de-scribed below, was used to calculate the spatial sensitiv-ity profile [12,13] of this differential detection sequence. The photon sensitivity profile was calculated for different distances (d) to find the optimum distance (d) that produce the smallest (width) area with maximum photon density along the center of the probe. The width of this high pho- ton density area obtained from such arrangement should determine the lateral resolution of the designed probe.2.2. Measured Method
The method of measurement is based on scanning the tissue with the probe, and measures the change in attenu- ated light over the scanned area. The position of the ab- sorber is localized when it falls within the central of the probe which has the maximum photon density (maximum probe sensitivity). In terms of reflectance measurements, this will corresponds to a peak maximum during the measurement scan. We have verified the measurement method using a Monte Carlo simulation by modeling the total diffuse reflectance measured by the differential probe from a scattering media contains two subcutaneous veins (diameter ~5 mm each) separated by ~5 mm dis- tance as shown in Figure 2. The absorption coefficient of the subcutaneous veins was chosen to simulate realistic conditions of the subcutaneous veins embedded within fat
d 3
3 2 1 3 2 1
Figure 1. (a) Standard probe; (b) Differential probe. Detec- tor (framed circle), source (solid black).
x Probe Scan Measurement
Turbid Media
[image:2.595.346.504.75.238.2]Absorption rods
Figure 2. Schematic diagram of the measurement method.
and muscle layers (~8 folds increase). To model the scanning measurements of the probe we have acquired different measurements at interval distances in the radial direction
r0,r4 cm,dr0.5 mm .
The radial dis- tance is referenced tothe position of the maximum sensi- tivity point in each probe (probe center).2.3. Monte Carlo Simulation
Monte Carlo simulations were performed using custom-ized software based on the algorithms and techniques used by Phral et al. [14]. In particular, the Monte Carlo simu-lation has been customized to estimate the spatial sensi-tivity profile (photon density distribution) and the total diffuse reflectance measured from the differential probe. The measured diffuse reflectance signal was calculated by recording the photons that hit the detectors when it escape the sample and propagate to any of the three detectors plane with an angle, to the surface normal, less than the NA cone of the fiber detector. A detector fiber with 400 µm diameter and NA ~ 0.4 was used for the simulated reflectance probes. The spatial sensitivity profile calcula-tions required to keep track of the escaped photons in three dimensions. To simulate differential probe detection, the photon is recorded to hit the probe when the weighted intensity of the photon detected by the second (central) detector is larger than the half sum of the weighted inten-sities detected by the two other detectors in the side. This would be corresponding to detecting the signal only when (Idiff > 0).
[image:2.595.60.288.631.708.2]
3. Results
-3 -2 -1 0
20 15 -10 -5 0 5 10 15 20
-Max
-Min
(a)
-3 -2 -1 0
20 15 -10 -5 0 5 10 15 20
-Max
-Min
[image:3.595.113.485.83.512.2](b)
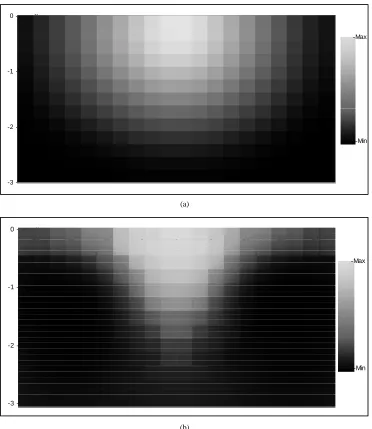
Figure 3. Photon Sensitivity Profile for (a) Single source-detector probe and (b) Differential triple source-detector probe (units in 0.5*cm).
Figure 5 shows the radial sensitivity profile (at depth ~10 mm) of the differential probe in comparison to the single probe. The radial sensitivity profile was calculated by recording all the radial position of the photons de-tected by the probe detectors from depths between 10 - 12 mm. As shown in Figure 5, the width of the radial sensitivity profile was reduced more than two times compared to the standard probe. This would result in improving the localization accuracy of an absorption structure by two times.
that of the single source-detector probe.
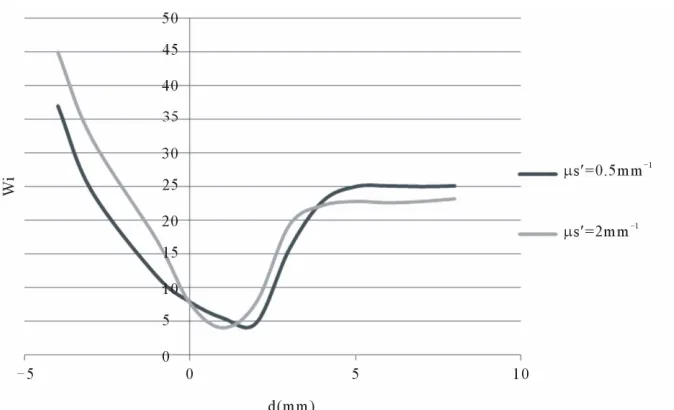
The distance between the source-detectors pairs de-termine the resultant sensitivity profile of the probe. Dis-tance (d) between the center of the detector on the side (detector 1 or 3) and the probe center was varied and the width of the resultant sensitivity profile (wi), defined here as the area with photon sensitivity >75% of the maximum, was calculated. Figure 4 shows the width of the sensitivity profile calculated for a range of distances (d) between –8 mm to 8 mm. As shown in the figure, the width of the sensitivity profile (wi) is minimized to 4mm along distances (d) between (0 - 3 mm). The figure also shows that the optimum distance range for minimizing the sensitivity profile width depends on the background optical properties of the tissue being investigated.
The depth sensitivity profile was also calculated for each probe by recording all the photons that hit the probe detectors with intensity larger than 1/e of the maximum detected photon intensity. Figure 6, shows that both the ifferential probe and the standard probe interrogate d
Figure 4. Design optimization for improving the lateral resolution for turbid media with different optical scattering proper- ties (µa = 0.01 mm–1).
S
ens
iti
v
it
[image:4.595.133.470.333.533.2]y
Figure 5. Radial sensitivity profile at 10 mm depth for the total diffuse reflectance collected by the standard probe and the differential probe.
similar depths (up to 2 cm) when measuring the diffuse reflectance signal from the same tissue optical properties.
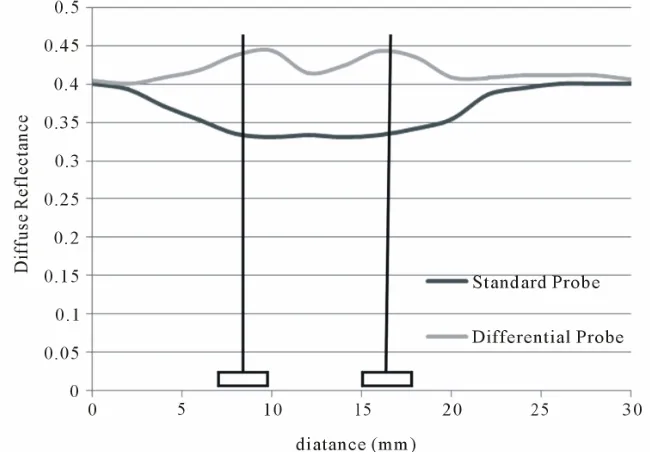
The result of the virtual scanning measurements is shown in Figure 7. For such measurement the back- ground optical properties was (µs’ = 1.5 mm–1, µa = 0.01 mm–1) and the two absorption rods was assumed to have a diameter of 5 mm and µa = 0. 08 mm–1. As shown in figure the measured signal detected using the differential probe measurement has two remarkable peak minimum corresponding to the position of the absorption rods. The figure also shows the diffuse reflectance measured during the virtual scanning (along different distances) using the standard probe measurement. The differential signal
plotted in the figure is equal to (Idiff+ 0.4). As shown in the figure the position of the two absorption rods are not differentiated using the standard probe measurements.
4. Discussion
Sens
iti
v
it
[image:5.595.144.460.84.285.2]y
Figure 6. Depth sensitivity profile for the total diffuse reflectance measured by the standard probe and the differential probe.
Figure 7. Results of the virtual scanning measurements, using Monte Carlo simulation, showing the total diffuse reflectance measured using the differential and the standard reflectance probes. The two rectangles on the bottom of the graph indicate the actual position of the two absorption rods.
genation from deep veins by localizing the area or the volume from where the signal is measured [17].
Our results showed that the differential probe can de-tect and localize the attenuation changes from area (volume) with diameter ~5 mm at depths ~1.5 cm. Com-pared to the standard probe with the same source-detec- tor distance, the designed probe has at least two folds improvement in the lateral resolution and consequently in the localization accuracy of the small absorption volume embedded deep within the tissue. This improvement in the spatial resolution is the resultant of the differential measurements of the signals detected by multiple source-
[image:5.595.135.460.315.541.2]ments and with a priori knowledge about the optical properties range of the tissue being investigated. Never-theless, the objective of this work is mainly to illustrate the validity of the proposed method and the concept for designing diffuse reflectance probes that have improved lateral resolution (<5 mm) and yet interrogate deep tissue layers within ~1.5 cm depth.
In addition, the proposed method is not limited to CW measurements and could be used with other types of NIR instruments including time-resolved and frequency mo- dulated reflectance measurements. However, other de- sign parameters such as detectors SNR, dynamic range, source-detector pairs switching, and tissue background optical properties, need to be investigated before devel- oping an experimental differential probe that could lo- calize deep small absorption changes from different modes of reflectance measurements.
5. Conclusion
We have proposed and investigated a new method for improving the lateral resolution of the optical back-scat- tering (reflectance) measurements. The method could have potential for improving the accuracy of the locating absorption structure (such as vein) embedded deep within the biological tissue. Future work will involve develop- ing an optical probe based the suggested method and verifying the validity of this approach using experimental measurements on tissue simulating phantoms.
REFERENCES
[1] T. Vaithianathan, I. D. Tullis, N. Everdell, T Leung, A. Gibson, J. Meek and D. T. Delpy, “Design of a Portable Near-Infrared System for Topographic Imaging of the Brain in Babies,” Review of Scientific Instruments, Vol. 75, No. 10, 2004, p. 3276. doi:10.1063/1.1775314 [2] M. A. O’Leary, D. A. Boas and B. Chance, “Experimen-
tal Images of Heterogeneous Turbid Media by Fre- quency-Domain Diffusing-Photon Tomography,” Optics Letters, Vol. 20, No. 5, 1995, pp. 426-428.
doi:10.1364/OL.20.000426
[3] H. Eda, I. Oda, Y. Ito, Y. Wada, Y. Oikawa, Y. Tsuna- zawa, M. Takada, Y. Tsuchiya, Y. Yamashita, M. Oda, A. Sassaroli, Y. Yamada and M. Tamura, “Multichannel Time- Resolved Optical Tomographic Imaging System,” Review of Scientific Instruments, Vol. 70, No. 9, 1999, p. 3595. doi:10.1063/1.1149965
[4] J. M. Murkin and M. Arango, “Near-Infrared Spectros- copy as an Index of Brain and Tissue Oxygenation,” Brit- ish Journal of Anaesthesia, Vol. 103, Suppl. 1, 2009, pp. 3-13. doi:10.1093/bja/aep299
[5] N. Subhash, J. R. Mallia, S. S. Thomas, A. Mathews, P. Sebastian and J. Madhavan, “Oral Cancer Detection Us- ing Diffuse Reflectance Spectral Ratio R540/R575 of Oxygenated Hemoglobin Bands,” Journal of Biomedical Optics, Vol. 11, No. 1, 2006, Article ID: 014018. doi:10.1117/1.2165184
Fong, E. Desperito, D. L. Hershman, R. L. Barbour and A. H. Hielscher, “Digital Optical Tomography System for Dynamic Breast Imaging,” Journal of Biomedical Optics, Vol. 16, No. 7, 2011, Article ID: 076014.
doi:10.1117/1.3599955
[7] M. Ferrari, V. Cettolo and V. Quaresima, “Light Source- Detector Spacing of Near-Infrared-Based Tissue Oxime- ters and the Influence of Skin Blood Flow,” Journal of Applied Physiology, Vol. 100, No. 4, 2006, pp. 1426- 1427. doi:10.1152/japplphysiol.01207.2005
[8] M. S. Patterson, S. Anderson, B. C. Wilson and E. K. Osei, “Absorption Spectroscopy in Tissue-Simulating Ma- terials: A Theoretical and Experimental Study of Photon Paths,” Applied Optics, Vol. 34, No. 1, 1995, pp. 22-30. doi:10.1364/AO.34.000022
[9] E. Okada, M. Firbank and D. T. Delpy, “The Effect of Overlying Tissue on the Spatial Sensitivity Profile of Near- Infrared Spectroscopy,” Physics in Medicine and Biology, Vol. 40, No. 12, 1995, pp. 2093-2108.
doi:10.1088/0031-9155/40/12/007
[10] D. A. Boas, K. Chen, D. Grebert and M. A. Franceschini, “Improving the Diffuse Optical Imaging Spatial Resolu- tion of the Cerebral Hemodynamic Response to Brain Activation in Humans,” Optics Letters, Vol. 29, No. 13, 2004, pp. 1506-1508.
[11] H. Kawaguchi and E. Okada, “Evaluation of Image Re- construction Algorithm for Near-Infrared Topography by Virtual Head Phantom,” Progress in Bimedical Optics and Imaging, Vol. 10, 2007, pp. 1-662906.
[12] J. C. Schotland, J. C. Haselgrove and J. S. Leigh, “Photon Hitting Density,” Applied Optics, 32, 1993, pp. 448-453. doi:10.1364/AO.32.000448
[13] Y. Fawzy, A. Youssef, M. El-Batanony and Y. Kadah, “Determination of the Optical Properties of A Two-Layer Tissue Model by Detecting Photons Migrating at Pro- gressively Increasing Depths,” Applied Optics, Vol. 42, No. 31, 2003, pp. 6398-6411.
doi:10.1364/AO.42.006398
[14] M. Keijzer, S. L. Jacques, S. A. Prahl and A. J. Welch, “Light Distributions in Artery Tissue: Monte Carlo Simu- lations for Finite-Diameter Lasers Beams,” Lasers in Medicine and Surgery, Vol. 9, No. 2, 1989, pp. 148-154. doi:10.1002/lsm.1900090210
[15] B. Lin, C. Kong, D. Tarng, T. Huang and G. Tang, “Ana- tomical Variation of the Internal Jugular Vein and Its Im- pact on Temporary Haemodialysis Vascular Access: An Ultra-Sonographic Survey in Uraemic Patients,” Ne- phrology Dialysis Transplantation, Vol. 13, No. 1, 1998, pp. 134-138. doi:10.1093/ndt/13.1.134
[16] V. Zharov, S. Ferguson, J. Eidt, P. Howard, L. Fink and M. Waner, “Infrared Imaging of Subcutaneous Veins,” Laser in Surgery and Medicine, Vol. 34, No. 1, 2006, pp. 56-61. doi:10.1002/lsm.10248