http://www.scirp.org/journal/jpee ISSN Online: 2327-5901
ISSN Print: 2327-588X
DOI: 10.4236/jpee.2017.59005 Sep. 15, 2017 55 Journal of Power and Energy Engineering
New Improved Maximum Power Point Tracking
Algorithm for Partially Shaded PV Systems
Dmitry Baimel
1, Saad Tapuchi
1, Nina Baimel
21Shamoon College of Engineering, Beer-Sheva, Israel
2Sapir Academic College, Hof Ashkelon, Israel
Abstract
The paper presents new MPPT algorithm for partial shading of series con-nected PV cells/modules. In the shaded condition, there is a problem of de-crease in the total output power of the PV system. The proposed algorithm aims to reduce this problem by active bypassing of the shaded cells. The algo-rithm senses the irradiance of each cell and performs calculation in order to decide if to actively bypass the shaded cell or not. Extensive simulation results proved that algorithm works and increases the output power under partial shading conditions. Furthermore, the algorithm becomes more efficient when the number of cells is increased.
Keywords
MPPT, Algorithm, Partial Shading, Simulation
1. Introduction
There is a constant increase in worldwide electrical power consumption and the conventional energy resources are limited. As a result, the need for renewable energy sources is constantly increasing. The photovoltaic (PV) systems draw spe-cial attention as one of the most promising renewable energy sources due to the fact that solar energy is clean, inexhaustible, without pollution and can be easily harvested. The PV panels convert solar energy into electrical energy.
The PV panels can be used as standalone electric power sources or integrated to the main grid as additional power source. The total cost of the PV system de-pends on the cost of PV array and the area it catches.
The solar cell, in terms of an electrical source, acts as a current source. The light hits the solar cell surface and as a result the solar cell produces current [1]. The PV systems have drawbacks of electric parameters and power generation
varia-How to cite this paper: Baimel, D., Tapu-chi, S. and Baimel, N. (2017) New Im-proved Maximum Power Point Tracking Algorithm for Partially Shaded PV Systems. Journal of Power and Energy Engineering, 5, 55-63.
https://doi.org/10.4236/jpee.2017.59005
Received: June 19, 2017 Accepted: September 12, 2017 Published: September 15, 2017
Copyright © 2017 by authors and Scientific Research Publishing Inc. This work is licensed under the Creative Commons Attribution International License (CC BY 4.0).
http://creativecommons.org/licenses/by/4.0/
DOI: 10.4236/jpee.2017.59005 56 Journal of Power and Energy Engineering tion with irradiation level and temperature changes. These variations influence short-circuit current, the open-circuit voltage, the Fill Factor (FF), the efficiency etc. [2]. Another important disadvantage is low conversion efficiency of the PV panels. Often, PV modules are shaded fully or partially due to few reasons like move-ment of clouds, adjacent high buildings, trees and the movemove-ment of the sun itself [3]-[9]. This shading leads significant reduction in the output power and inter-nal devastating effects.
During partial shading, the PV curve of the array has multiple maximum points—several local peaks and one global peak. This can lead to the situation where the local peak is mistakenly recognized by the MPPT algorithm as a maxi-mum point instead of true global peak in this case the system will operate at this local peak and significant power losses will be present [10][11]. Therefore, the PV system has been operated at the real global maximum power point in all con-ditions, including during partial shading.
The standard MPPT methods can’t identify the real global peak during the partial shading because they are not sophisticated enough to differentiate be-tween the local and global points. The standard MPPT methods can be divided into two categories: direct and indirect tracking. The direct tracking methods have the advantage of being independent from prior knowledge of PV characte-ristics. Thus, the operation point is independent of isolation, temperature or de-gradation levels. The most common direct tracking methods are Incremental Conduction (IC) [12], Perturb and Observe (PO) [13] [14], as well as neural network and fuzzy logic techniques [15] [16] [17]. The indirect tracking me-thods use databases of parameters that include empirical data of typical P-V curves for different irradiances and temperatures, or use mathematical functions obtained from the empirical data to estimate the MPP [18] [19]. The direct tracking methods include the techniques of look-up table, open circuit PV vol-tage and short circuit PV current and more. The MPPT methods are imple-mented by insertion of DC-DC converter between the PV panel and the load [20] [21]. The switching of DC-DC converter is controlled by MPPT algorithms by Pulse Width Modulation (PWM).
The simplest solution is using by-pass diodes and inverters, which track the maximum power point, thus keeping the cells safe and utilize them. However, this solution has a limited effectiveness due to the fact that one inverter can draw just one current from all the modules. If one of them is shaded it can’t be utilized in full potential. On the other hand, the use of inverter for each module increases costs.
Additional methods were reported in the literature [22] [23][24][25] [26]. They have some drawbacks such as limited application (not appropriate for all limited conditions), slow response and computationally complicated.
2. The Benefits of the Bypassing PV Modules during Partial
Shading
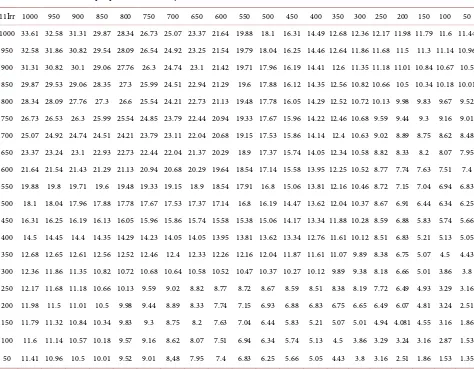
dif-DOI: 10.4236/jpee.2017.59005 57 Journal of Power and Energy Engineering ferent PV cells, two PV arrays each consisted of ten series connected cells. Each module has parallel diode for bypassing. The load of the PV system is imple-mented by the voltage source. The simulated model is shown in Figure 1. Dif-ferent cases of irradiation combinations were simulated and the total output power of the PV system was calculated. The simulation results are concentrated in Table 1. Table 2 shows simulated output power of the PV system consisted of only one PV module.
During the shading the irradiance on each module is different and this causes the output power reduction of the whole PV system. For some irradiance condi-tions, the output power of the whole system will be smaller than the output power of one cell. This conclusion is seen from comparison between the values in Table 1 and Table 2. In these cases, it is preferable to bypass cell in order to increase the output power. These cases are colored in red in the Table 1. For example, when the irradiance of two modules is 1000/2 and 450/2 the obtained output power is 16.31 W (see Table 1) and if the module with 450/2 is by-passed, the output power will rise to 16.8 W (see Table 2). This effect will become even more complicated when the number of the PV cells connected in series is in-creased.
3. The Proposed Method
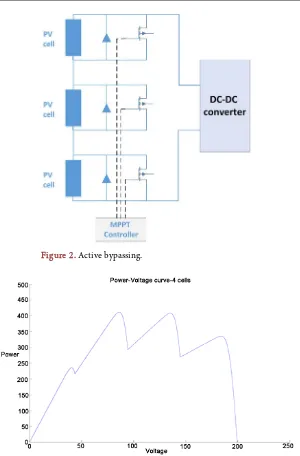
The paper proposes method that performs active bypassing of the modules by switches (Figure 2). In Figure 2, each PV cell has parallel bypass switch that can be closed in order to bypass the cell in the case of cell shading.
The typical P-V curve for PV system with three cells is shown in Figure 3. During the partial shading, the most shaded module will has the lowest cur-rent that will limit the curcur-rent of the whole string due to the series connection of the modules. The proposed algorithm checks if it is more efficient to bypass the most shaded module or not. The flowchart of the algorithm is shown in Figure 4.
DOI: 10.4236/jpee.2017.59005 58 Journal of Power and Energy Engineering Table 1. The simulated output power of the PV system for different irradiance conditions, two PV modules.
11Irr 1000 950 900 850 800 750 700 650 600 550 500 450 400 350 300 250 200 150 100 50 1000 33.61 32.58 31.31 29.87 28.34 26.73 25.07 23.37 21.64 19.88 18.1 16.31 14.49 12.68 12.36 12.17 11.98 11.79 11.6 11.44
950 32.58 31.86 30.82 29.54 28.09 26.54 24.92 23.25 21.54 19.79 18.04 16.25 14.46 12.64 11.86 11.68 11.5 11.3 11.14 10.96 900 31.31 30.82 30.1 29.06 27.76 26.3 24.74 23.1 21.42 19.71 17.96 16.19 14.41 12.6 11.35 11.18 11.01 10.84 10.67 10.5 850 29.87 29.53 29.06 28.35 27.3 25.99 24.51 22.94 21.29 19.6 17.88 16.12 14.35 12.56 10.82 10.66 10.5 10.34 10.18 10.01 800 28.34 28.09 27.76 27.3 26.6 25.54 24.21 22.73 21.13 19.48 17.78 16.05 14.29 12.52 10.72 10.13 9.98 9.83 9.67 9.52 750 26.73 26.53 26.3 25.99 25.54 24.85 23.79 22.44 20.94 19.33 17.67 15.96 14.22 12.46 10.68 9.59 9.44 9.3 9.16 9.01 700 25.07 24.92 24.74 24.51 24.21 23.79 23.11 22.04 20.68 19.15 17.53 15.86 14.14 12.4 10.63 9.02 8.89 8.75 8.62 8.48 650 23.37 23.24 23.1 22.93 22.73 22.44 22.04 21.37 20.29 18.9 17.37 15.74 14.05 12.34 10.58 8.82 8.33 8.2 8.07 7.95 600 21.64 21.54 21.43 21.29 21.13 20.94 20.68 20.29 19.64 18.54 17.14 15.58 13.95 12.25 10.52 8.77 7.74 7.63 7.51 7.4 550 19.88 19.8 19.71 19.6 19.48 19.33 19.15 18.9 18.54 17.91 16.8 15.06 13.81 12.16 10.46 8.72 7.15 7.04 6.94 6.83 500 18.1 18.04 17.96 17.88 17.78 17.67 17.53 17.37 17.14 16.8 16.19 14.47 13.62 12.04 10.37 8.67 6.91 6.44 6.34 6.25 450 16.31 16.25 16.19 16.13 16.05 15.96 15.86 15.74 15.58 15.38 15.06 14.17 13.34 11.88 10.28 8.59 6.88 5.83 5.74 5.66 400 14.5 14.45 14.4 14.35 14.29 14.23 14.05 14.05 13.95 13.81 13.62 13.34 12.76 11.61 10.12 8.51 6.83 5.21 5.13 5.05 350 12.68 12.65 12.61 12.56 12.52 12.46 12.4 12.33 12.26 12.16 12.04 11.87 11.61 11.07 9.89 8.38 6.75 5.07 4.5 4.43 300 12.36 11.86 11.35 10.82 10.72 10.68 10.64 10.58 10.52 10.47 10.37 10.27 10.12 9.89 9.38 8.18 6.66 5.01 3.86 3.8 250 12.17 11.68 11.18 10.66 10.13 9.59 9.02 8.82 8.77 8.72 8.67 8.59 8.51 8.38 8.19 7.72 6.49 4.93 3.29 3.16 200 11.98 11.5 11.01 10.5 9.98 9.44 8.89 8.33 7.74 7.15 6.93 6.88 6.83 6.75 6.65 6.49 6.07 4.81 3.24 2.51 150 11.79 11.32 10.84 10.34 9.83 9.3 8.75 8.2 7.63 7.04 6.44 5.83 5.21 5.07 5.01 4.94 4.081 4.55 3.16 1.86 100 11.6 11.14 10.57 10.18 9.57 9.16 8.62 8.07 7.51 6.94 6.34 5.74 5.13 4.5 3.86 3.29 3.24 3.16 2.87 1.53 50 11.41 10.96 10.5 10.01 9.52 9.01 8,48 7.95 7.4 6.83 6.25 5.66 5.05 4.43 3.8 3.16 2.51 1.86 1.53 1.35
Table 2. The simulated output power of the PV system for different irradiance conditions, one PV module.
1000 950 900 850 800 750 700 650 600 550 500 450 400 350 300 250 200 150 100 50 16.8 15.93 15.05 14.17 13.29 12.42 11.55 10.69 9.82 8.95 8.07 7.23 6.38 5.53 4.69 3.84 3.03 2.23 1.42 57γ0
The main principle of the proposed method relies on the measurement of the irradiance of each PV module. By knowing the irradiance and the I-V curves, the possible output current of each cell is calculated. The cell with the lowest possi-ble current is the most shaded cell. The algorithm locates this cell. Afterwards, the total output power of the PV system (Pout) is calculated by:
out out cell
P =I ∗ ∗n V (1)
where n is the number of series connected cells, Vcellis the output voltage of
each cell and Iout is the current of the PV module. The next step is to calculate
the new output power of the PV system (Pout_new) if the most shaded cell is by-passed.
In this case there will be (n-1) cells:
(
)
_ _ 1
out new out new cell
[image:4.595.56.541.486.519.2]DOI: 10.4236/jpee.2017.59005 59 Journal of Power and Energy Engineering Figure 2. Active bypassing.
Figure 3. Typical I-V curve during partial shading [27], three PV modules are present in the system.
where Iout_new is the new obtained P module current due to the bypassing the shaded cell.
Then, the algorithms checks if the new output power with bypass is higher than the original output power including the switching losses of the switchPloss:
_
out new out loss
P >P +P (3)
If true, then the most shaded cell is bypassed by parallel switch. At the end of cycle the algorithm returns to the beginning.
4. Simulation Results
DOI: 10.4236/jpee.2017.59005 60 Journal of Power and Energy Engineering Figure 4. The flowchart of the proposed algorithm.
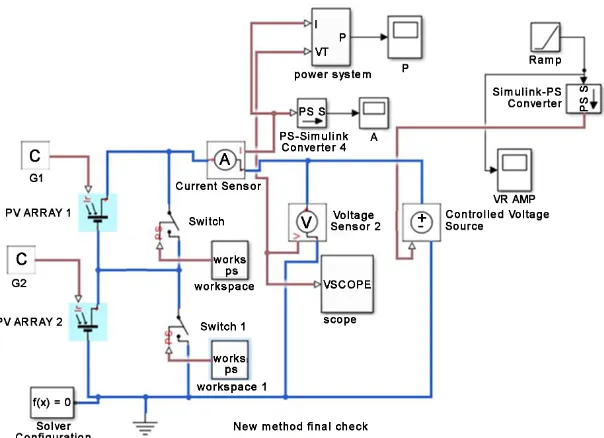
Figure 5. The simulated PV system for testing the proposed algorithm.
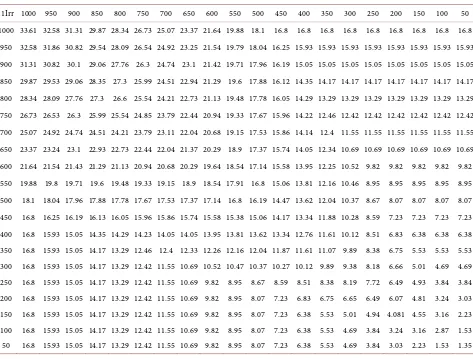
[image:6.595.225.527.439.658.2]DOI: 10.4236/jpee.2017.59005 61 Journal of Power and Energy Engineering Table 3. The simulated output power of the PV system for different irradiance conditions operated by the proposed algorithm.
11Irr 1000 950 900 850 800 750 700 650 600 550 500 450 400 350 300 250 200 150 100 50 1000 33.61 32.58 31.31 29.87 28.34 26.73 25.07 23.37 21.64 19.88 18.1 16.8 16.8 16.8 16.8 16.8 16.8 16.8 16.8 16.8
950 32.58 31.86 30.82 29.54 28.09 26.54 24.92 23.25 21.54 19.79 18.04 16.25 15.93 15.93 15.93 15.93 15.93 15.93 15.93 15.93 900 31.31 30.82 30.1 29.06 27.76 26.3 24.74 23.1 21.42 19.71 17.96 16.19 15.05 15.05 15.05 15.05 15.05 15.05 15.05 15.05 850 29.87 29.53 29.06 28.35 27.3 25.99 24.51 22.94 21.29 19.6 17.88 16.12 14.35 14.17 14.17 14.17 14.17 14.17 14.17 14.17 800 28.34 28.09 27.76 27.3 26.6 25.54 24.21 22.73 21.13 19.48 17.78 16.05 14.29 13.29 13.29 13.29 13.29 13.29 13.29 13.29 750 26.73 26.53 26.3 25.99 25.54 24.85 23.79 22.44 20.94 19.33 17.67 15.96 14.22 12.46 12.42 12.42 12.42 12.42 12.42 12.42 700 25.07 24.92 24.74 24.51 24.21 23.79 23.11 22.04 20.68 19.15 17.53 15.86 14.14 12.4 11.55 11.55 11.55 11.55 11.55 11.55 650 23.37 23.24 23.1 22.93 22.73 22.44 22.04 21.37 20.29 18.9 17.37 15.74 14.05 12.34 10.69 10.69 10.69 10.69 10.69 10.69 600 21.64 21.54 21.43 21.29 21.13 20.94 20.68 20.29 19.64 18.54 17.14 15.58 13.95 12.25 10.52 9.82 9.82 9.82 9.82 9.82 550 19.88 19.8 19.71 19.6 19.48 19.33 19.15 18.9 18.54 17.91 16.8 15.06 13.81 12.16 10.46 8.95 8.95 8.95 8.95 8.95 500 18.1 18.04 17.96 17.88 17.78 17.67 17.53 17.37 17.14 16.8 16.19 14.47 13.62 12.04 10.37 8.67 8.07 8.07 8.07 8.07 450 16.8 16.25 16.19 16.13 16.05 15.96 15.86 15.74 15.58 15.38 15.06 14.17 13.34 11.88 10.28 8.59 7.23 7.23 7.23 7.23 400 16.8 15.93 15.05 14.35 14.29 14.23 14.05 14.05 13.95 13.81 13.62 13.34 12.76 11.61 10.12 8.51 6.83 6.38 6.38 6.38 350 16.8 15.93 15.05 14.17 13.29 12.46 12.4 12.33 12.26 12.16 12.04 11.87 11.61 11.07 9.89 8.38 6.75 5.53 5.53 5.53 300 16.8 15.93 15.05 14.17 13.29 12.42 11.55 10.69 10.52 10.47 10.37 10.27 10.12 9.89 9.38 8.18 6.66 5.01 4.69 4.69 250 16.8 15.93 15.05 14.17 13.29 12.42 11.55 10.69 9.82 8.95 8.67 8.59 8.51 8.38 8.19 7.72 6.49 4.93 3.84 3.84 200 16.8 15.93 15.05 14.17 13.29 12.42 11.55 10.69 9.82 8.95 8.07 7.23 6.83 6.75 6.65 6.49 6.07 4.81 3.24 3.03 150 16.8 15.93 15.05 14.17 13.29 12.42 11.55 10.69 9.82 8.95 8.07 7.23 6.38 5.53 5.01 4.94 4.081 4.55 3.16 2.23 100 16.8 15.93 15.05 14.17 13.29 12.42 11.55 10.69 9.82 8.95 8.07 7.23 6.38 5.53 4.69 3.84 3.24 3.16 2.87 1.53 50 16.8 15.93 15.05 14.17 13.29 12.42 11.55 10.69 9.82 8.95 8.07 7.23 6.38 5.53 4.69 3.84 3.03 2.23 1.53 1.35
system for different irradiance conditions is shown in Table 3. It can be seen from Table 3 that the algorithm actually works and improves the efficiency of the PV system. The algorithm becomes more efficient when the number of series connected cells/modules is increased.
5. Conclusions
The paper presents new MPPT algorithm for partial shading of series connected PV cells/modules. The algorithm performs active bypassing of the shaded cells that decrease the total output power of the PV system.
By performing extensive simulation of different shading conditions, the algo-rithm was tested for two series connected cells. It was shown that algoalgo-rithm works and increases the output power under partial shading conditions. Furthermore, the algorithm becomes more efficient when the number of cells is increased. There-fore, it should be used in large PV installations.
References
DOI: 10.4236/jpee.2017.59005 62 Journal of Power and Energy Engineering Diode Models from Single I-V Characteristics of PV Panels. IEEE Transactions on Industrial Electronics, 62, 4181-4193. https://doi.org/10.1109/TIE.2015.2390193 [2] Reis, F., Guerreiro, C., Batista, F., Pimentel, T., Pravettoni, M., Wemans, J., Sorasio,
G. and Brito, M.C. (2015) Modeling the Effects of Inhomogeneous Irradiation and Temperature Profile on CPV Solar Cell Behavior. IEEE Journal of Photovoltaics, 5, 112-122. https://doi.org/10.1109/JPHOTOV.2014.2358080
[3] Spertino, F. and Akilimali, J.S. (2009) Are Manufaturing I-V Mismatch and Reverse Currents Key Factors in Large Photovoltaic Arrays? IEEE Transactions on Industri-al Electronics, 56, 4520-4531. https://doi.org/10.1109/TIE.2009.2025712
[4] Patel, H. and Agarwal, V. (2008) MATLAB-Based Modeling to Study the Effects of Partial Shading on PV Array Characteristics. IEEE Transactions on Energy Conver-sion, 23, 302-310. https://doi.org/10.1109/TEC.2007.914308
[5] Ghitas, A.E. and Sabry, M. (2006) A Study of the Effect of Shadowing Location and Area on the Si Solar Cell Electrical Parameters. Vacuum, 81, 475-478.
https://doi.org/10.1016/j.vacuum.2006.07.001
[6] Drif, M., Perez, P.J., Aguilera, J. and Aguilar, J.D. (2008) A New Estimation Method of Irradiance on a Partially Shaded PV Generator in Grid-Connected Photovoltaic Systems. Renewable Energy, 33, 2048-2056.
https://doi.org/10.1016/j.renene.2007.12.010
[7] Maki, A. and Valkealahti, S. (2012) Power Loss in Long String and Parallel Con-nected Short Strings of Series-ConCon-nected Silicon-Based Photovoltaic Modules Due to Partial Shading Conditions. IEEE Transactions on Energy Conversion, 27, 173-183. https://doi.org/10.1109/TEC.2011.2175928
[8] Paraskevadaki, E.V. and Papathanassiou, S.A. (2011) Evaluation of MPP Voltage and Power of Mc-Si PV Modules in Partial Shading Conditions. IEEE Transactions on Energy Conversion, 26, 923-932. https://doi.org/10.1109/TEC.2011.2126021 [9] Mastromauro, R.A., Liserre, M. and Dell’Aquila, A. (2012) Control Issues in
Sin-gle-Stage Photovoltaic Systems: MPPT, Current and Voltage Control. IEEE Trans-actions on Industrial Informatics, 8, 241-254.
https://doi.org/10.1109/TII.2012.2186973
[10] Ishaque, K., Salam, Z., Taheri, H., et al. (2011) Maximum Power Point Tracking for PV System under Partial Shading Condition via Particle Swarm Optimization. 2011 IEEE Applied Power Electronics Colloquium (IAPEC 2011), Johor Bahru, 18-19 April 2011. https://doi.org/10.1109/IAPEC.2011.5779866
[11] Petrone, G., Spagnuolo, G., Teodorescu, R., et al. (2008) Reliability Issues in Photo-voltaic Power Processing Systems. IEEE Transactions on Industrial Electronics, 55, 2569-2580. https://doi.org/10.1109/TIE.2008.924016
[12] Jeddi, N. and El Amraoui Ouni, L. (2014) Comparative Study of MPPT Techniques for PV Control Systems. International Conference on Electrical Sciences and Tech-nologies in Maghreb,Tunis, 3-6 November 2014, 1-7.
https://doi.org/10.1109/CISTEM.2014.7077034
[13] Raj, J.S.C.M. and Jeyakumar, A.E. (2014) A Novel Maximum Power Point Tracking Technique for Photovoltaic Module Based on Power Plane Analysis of I-V Charac-teristics. IEEE Transactions on Industrial Electronics, 61, 4734- 4745.
https://doi.org/10.1109/TIE.2013.2290776
[14] Sera, D., Teodorescu, R., Hantschel, J. and Knoll, M. (2008) Optimized Maximum Power Point Tracker for Fast-Changing Environmental Conditions. IEEE Transac-tions on Industrial Electronics, 55, 1017-1026.
DOI: 10.4236/jpee.2017.59005 63 Journal of Power and Energy Engineering [15] Vinay, P. and Mathews, M.A. (2014) Modelling and Analysis of Artificial Intelli-gence Based MPPT Techniques for PV Applications. International Conference on Advances in Green Energy (ICAGE), Thiruvananthapuram, 17-18 December 2014, 56-65.
[16] Chiu, C.-S. and Ouyang, Y.-L. (2011) Robust Maximum Power Tracking Control of Uncertain Photovoltaic Systems: A Unified T-S Fuzzy Model-Based Approach. IEEE Transactions on Control Systems Technology, 19, 1516-1526.
https://doi.org/10.1109/TCST.2010.2093900
[17] Chikh, A. and Chandra, A. (2015) An Optimal Maximum Power Point Tracking Algorithm for PV Systems with Climatic Parameters Estimation. IEEE Transactions on Sustainable Energy, 6, 644-652. https://doi.org/10.1109/TSTE.2015.2403845 [18] Uoya, M. and Koizumi, H. (2015) A Calculation Method of Photovoltaic Array’s
Operating Point for MPPT Evaluation Based on One-Dimensional Newton-Raphson Method. IEEE Transactions on Industry Applications, 51, 567-575.
https://doi.org/10.1109/TIA.2014.2326083
[19] Bizzarri, F., Bongiorno, M., Gruosso, G. and Gajani, G.S. (2013) Model of Photo-voltaic Power Plants for Performance Analysis and Production Forecast. IEEE Transactions on Sustainable Energy, 4, 278-285.
https://doi.org/10.1109/TSTE.2012.2219563
[20] York, B., Yu, W. and Lai, J.-S. (2013) An Integrated Boost Resonant Converter for Photovoltaic Applications. IEEE Transactions on Power Electronics, 28, 1999-1207. https://doi.org/10.1109/TPEL.2012.2207127
[21] Li, W.H. and He, X.N. (2011) Review of Nonisolated High-Step-Up DC/DC Con-verters in Photovoltaic Grid-Connected Applications. IEEE Transactions on Indus-trial Electronics, 58, 364-369. https://doi.org/10.1109/TIE.2010.2049715
[22] Zbeeb, A., Devabhaktuni, V. and Sebak, A. (2009) Improved Photovoltaic MPPT Algorithm Adapted for Unstable Atmospheric Conditions and Partial Shading. 2009 International Conference on Clean Electrical Power, Capri, 9-11 June 2009, 320-323. https://doi.org/10.1109/ICCEP.2009.5212035
[23] Karatepe, E., Hiyama, T., Boztepe, M. and Çolak, M. (2008) Voltage Based Power Compensation System for Photovoltaic Generation System under Partially Shaded Insolation Conditions. Energy Conversion and Management, 49, 2307-2316. https://doi.org/10.1016/j.enconman.2008.01.012
[24] Patel, H. and Agarwal, V. (2008) Maximum Power Point Tracking Scheme for PV Systems Operating under Partially Shaded Conditions. IEEE Transactions on In-dustrial Electronics, 55, 1689-1698. https://doi.org/10.1109/TIE.2008.917118 [25] Tat Luat, N. and Kay-Soon, L. (2010) A Global Maximum Power Point Tracking
Scheme Employing DIRECT Search Algorithm for Photovoltaic Systems. IEEE Transactions on Industrial Electronics, 57, 3456-3467.
https://doi.org/10.1109/TIE.2009.2039450
[26] Kobayashi, K., Takano, I. and Sawada, Y. (2006) A Study of a Two Stage Maximum Power Point Tracking Control of a Photovoltaic System under Partially Shaded In-solation Conditions. Solar Energy Mater. Solar Cells, 90, 2975-2988.
https://doi.org/10.1016/j.solmat.2006.06.050
[27] Severini, M., et al. (2017) Energy Management with Support of PV Partial Shading Modelling in Micro Grid Environments. Energies, 10, 453.
Submit or recommend next manuscript to SCIRP and we will provide best service for you:
Accepting pre-submission inquiries through Email, Facebook, LinkedIn, Twitter, etc. A wide selection of journals (inclusive of 9 subjects, more than 200 journals)
Providing 24-hour high-quality service User-friendly online submission system Fair and swift peer-review system
Efficient typesetting and proofreading procedure
Display of the result of downloads and visits, as well as the number of cited articles Maximum dissemination of your research work