Diffusion Bonding of Co to TiAu High Temperature Shape Memory Alloy
Yuta Okimori
1;*, Tomonari Inamura
1, Hideki Hosoda
1and Kenji Wakashima
1 1Precision and Intelligence Laboratory, Tokyo Institute of Technology, Yokohama 226-8503, JapanWe propose a high-temperature actuator composite material composed of a high temperature shape memory alloy (HTSMA) TiAu with a
high martensitic transformation temperature (Ms¼880K) and ferromagnetic cobalt with a high Curie temperature (TC¼1388K). This actuator
material can be driven by magnetic field in a bending mode due to ferromagnetic force acting on the Co-layer and generates a large actuation strain which originates from the HTSMA. The purposes of this work are (1) to fabricate the composite materials laminated as TiAu/Co/TiAu by a diffusion bonding method through hot pressing, (2) to characterize the microstructure near the bonding interface between TiAu and Co layers, (3) to evaluate growth behavior of the diffusion layer, and (4) to determine the optimum condition for the fabrication. The composite materials were fabricated by hot pressing at 1073, 1173 and 1273 K for 10 h. The bonding interface between TiAu and Co was observed by a scanning electron microscope and concentration profiles were measured by an energy-dispersive X-ray spectroscopy. In order to evaluate the growth behavior of the diffusion layer, the TiAu/Co composites were aged at 773, 1073, 1173 and 1273 K for 24 h. It was found that, after the hot pressing, TiAu and Co layers were successfully bonded, and that two reactant intermetallic compounds were formed near the TiAu/Co interface.
The intermetallic compounds were identified to be C11bTi(Au,Co)2and C36 (Ti,Au)Co2. As for the growth behavior, the thickness of the
diffusion layer was not changed by aging at 773 K. However, the thickness was increased by increasing the aging temperature above 1073 K. The
apparent activation energy for the growth of the diffusion layer was estimated to be28020kJ/mol in a temperature range of 1073–1273 K.
Using the values of the activation energy and the diffusion constant, the thickness of the diffusion layer was predicted to be sufficiently thin:
12mmby the hot pressing at 1073 K for 10 h. This predicted value was in good agreement with the experimental result of 7mm.
[doi:10.2320/matertrans.MAW200862]
(Received May 16, 2008; Accepted July 11, 2008; Published August 13, 2008)
Keywords: diffusion bonding, hot pressing, high temperature shape memory alloy, TiAu, cobalt, actuator material, intermetallic compound, activation energy
1. Introduction
Recently, development of high-performance actuator materials which can be used in a high-temperature (HT) environment with actuation strain and frequency in the order of 0.01 and kHz, respectively, is required.1)Shape memory alloys (SMAs) are expected to be power actuator materials because they can generate a large transformation strain about a few percent by thermoelastic martensitic trans-formation.2)Although several kinds of SMAs such as Ti-Ni, Cu-base, Fe-base, Ti-base SMAs have been known,2) most of practical applications use TiNi. The highest actuation temperature of TiNi is about 350 K1,3) and the highest actuation-frequency is limited to be in the order of 100 Hz in TiNi thin film.4)This is because the actuation of SMAs requires heat dissipation time through heat transfer. Ferro-magnetic SMAs (FSMAs) which are driven by an external magnetic field are proposed with a higher frequency of actuation and a larger actuation strain. At present, NiMnGa has been widely studied as FSMA.5)The actuation frequency of NiMnGa is expected to reach a few kHz by magnetic field which can be controlled electronically unlike the heat-dissipation. There are two actuation principles for FSMAs. One is using the magnetic-induced martensitic transforma-tion whose actuatransforma-tion temperature is higher than martensitic transformation temperature (Ms). However, it takes a higher external magnetic field for actuation. The other is the re-orientation of martensite variants coming from the magneto-crystalline anisotropy of FSMAs which can actuate under relatively low external magnetic field. However, there are some drawbacks in this mode of actuation. One is that the actuation temperature is limited to be lower than both the
Msand the Curie temperature (TC). This is because FSMAs must be in both the martensite state and the ferromagnetic state. The Ms of NiMnGa is, however, decreased with increasing the Curie temperature6) and Ms equals to TC at around 373 K.6) This means that NiMnGa cannot be used above 373 K as a FSMA actuator. Another drawback of FSMAs is a relatively low generative force of few MPa,7) which is about 1/100 of that of TiNi.
A few kinds of SMA/ferromagnet composite actuator materials have been already reported.8–10) Taya et al. proposed a new first generation torque actuator based on FSMA composite.8)Unlike the FSMA of NiMnGa which is actuated by homogeneous magnetic field, these SMA/ ferromagnet composites are actuated by magnetic gradient, and have a large actuation strain due to use the SMAs. As discussed previously, the actuation temperature of the SMAs is, however, not too high. Therefore, we propose a new high-temperature magnetostrictive actuator material which is a laminated composite composed of a high temperature SMA (HTSMA) with highMs and a ferromagnetic material with highTc. The HTSMA/ferromagnet laminated composite has a stacking structure that a thin plate of ferromagnet is sandwiched between relatively thick laminae of HTSMA as HTSMA/ferromagnet/HTSMA. By applying magnetic field with gradient, the ferromagnet layer is elastically bent by magnetic force, and then the reorientation of martensite variants of HTSMA occurs when the magnetic force is sufficiently high. Even though the strain at the surface of the HTSMA lamina reaches a few percent, the strain of the ferromagnet layer can be kept within the elastic region which the value of strain is around 0.2%. The shape strain of the laminated composite is, therefore, perfectly recovered by the inversion of the field or heating above the reverse martensitic transformation temperature (Af).
*Graduate Student, Tokyo Institute of Technology
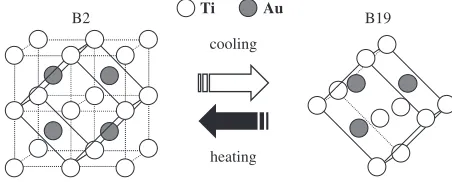
In this work, TiAu withMs¼880K11–13)and cobalt (Co) with TC¼1388K were selected as the HTSMA and the ferromagnet, respectively. Figure 1 shows the lattice corre-spondence and the crystal structures of the B2 parent phase (cubic) and the B19 martensite phase (orthorhombic). Equiatomic TiAu exhibits a thermoelastic martensitic trans-formation from B2 to B19 at around 880 K. The principal strains of the transformation are 10%, 2% and 7%14)and the maximum value is close to that of TiNi.15)
Diffusion bonding through hot pressing is a conventional technique to fabricate the laminated composite. When Co atoms are solved into TiAu layers,Msof TiAu is decreased with increasing the amount of Co as seen in Fig. 2.14,16)In addition, there is a possibility that brittle intermetallic compounds are formed as reactants at the interface between TiAu and Co during the hot pressing. In general, such reactants are detrimental for the bonding strength.17) The diffusion behavior near the TiAu/Co interface and the control of the thickness of the diffusion and the reactant layers are, therefore, necessary for the fabrication. Besides, the morphological change near the bonding interface often determines the lifetime, thus, the interfacial change at the operated temperature should be investigated. Therefore, the purposes of this work are (1) to fabricate the composite materials laminated as TiAu/Co/TiAu by a diffusion bond-ing method through hot pressbond-ing, (2) to characterize the microstructure near the bonding interface between TiAu and
Co layers, (3) to evaluate growth behavior of the diffusion and reactant layers, and (4) to determine the optimum condition for the fabrication.
2. Experimental Procedure
Starting materials used were elemental Ti, Au and Co with purity of 99.99%, 99.99% and 99.9%, respectively. Equia-tomic TiAu ingots were fabricated by Ar arc-melting method with a non-consumable W electrode and were hot-forged at 1423 K for 24 h to be about 0.8 mm in thickness. Then, the TiAu lamina was cold-rolled with 50% reduction rate. A Co lamina with the thickness of about 0.4 mm was cut from a tablet of pure Co, and then cold-rolled with 47% reduction rate. The final thicknesses of the TiAu and Co lamina were around 0.5 mm and 0.2 mm, respectively. A Co lamina was sandwiched by two TiAu laminae and they were bonded by hot pressing at 1273, 1173 and 1073 K for 10 h in vacuum using boron-nitride-coated carbon dices. The heating and cooling rate of the hot pressing was 0.067 K s1 (4 K/min). The hot-pressed laminate were cut into some pieces by electro-discharge machining and finished by mechanical polishing. In order to characterize the microstructure and diffusion behavior, cross-section bonding interfaces between TiAu and Co were observed by a field-emission gun type scanning-electron-microscope (FE-SEM). The chemical compositions and concentration profiles near the TiAu/Co interfaces were measured by an energy-dispersive spec-troscopy (EDS) analysis equipped with the FE-SEM. In order to evaluate the growth behavior of the diffusion layer, the TiAu/Co composites were aged at 773, 1073, 1173 and 1273 K for 24 h and then similar observations were made by FE-SEM and EDS.
3. Results and Discussions
3.1 Microstructure and diffusion behavior near the bonding interface between TiAu and Co
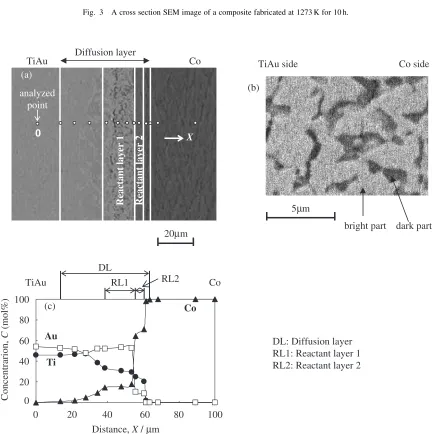
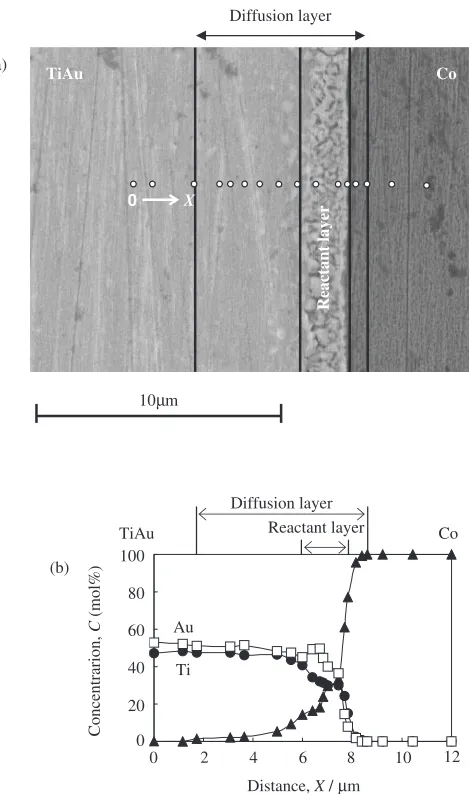
An entire cross-section view of a composite made by hot pressing at 1273 K for 10 h is shown in Fig. 3. It is seen that the TiAu and Co layers were uniformly bounded. Figure 4(a) shows a SEM image of the TiAu/Co interface after hot pressing at 1273 K for 10 h. Figure 4(b) is an enlarged SEM image obtained at a part of ‘‘Reactant layer 1’’ shown in Fig. 4(a). Figure 4(c) is a concentration profile evaluated by EDS analysis corresponding to Fig. 4(a). The points analyzed by EDS are shown in Fig. 4(a). The point of ‘‘zero’’ is the starting point of the EDS analysis. Similarly, Fig. 5(a) and (b) show a cross-section micrograph of the specimen hot pressed at 1173 K for 10 h and corresponding concentration profile by EDS, respectively. Hereafter, a ‘‘diffusion layer’’ is defined as the layer in which the Co is solved, and the areas of diffusion layers are shown in Figs. 4(c) and 5(b). It should be noted that ‘‘Reactant layer 1’’ shown in Fig. 4(b) seems to be two phase of bright part and dark part, and chemical compositions of these parts are different each other. The chemical composition of the bright part was 30–32 mol%Ti, 52–54 mol%Au and 15–17 mol%Co and insensitive to the distance. Thus, as the concentration profile at ‘‘Reactant layer 1’’ in Fig. 4(c), the chemical compositions of the bright
Ti Au
B2 B19
heating cooling
Fig. 1 Unit cells and lattice correspondence of B2 and B19
(aB19<bB19<cB19).
Martensitic Transformation Temperatures,
Ms
/ K
− 40K/mol%Co
Concentration of Co, CCo(mol%) 1000
800
600
400
200
0 5 10 15 20 25
Ms
Mf
As
Af
Fig. 2 Martensitic transformation temperatures as a function of Co
[image:2.595.53.279.74.165.2]areas were employed. The composition ratio of Ti and (Au, Co) was approximately 1:2. On the other hand, ‘‘Reactant layer 2’’ seemed to be single phase. In Figs. 4(c) or 5(b), two-stepwise concentration profiles were obtained as a function of distance. Such stepwise profiles stand for the formation of intermediate phases, and the corresponding layers are called ‘‘Reactant layer 1’’ and ‘‘Reactant layer 2’’, hereafter. The thickness of the diffusion layer and the reactant layers are summarized in Table 1.
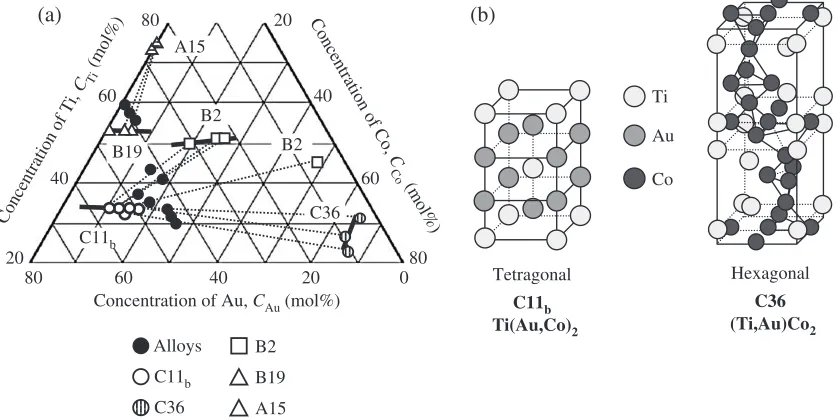
In order to identify the intermediate phases formed, the concentration profiles were compared to the Ti-Au-Co ternary phase diagram at 1173 K in Fig. 6.18)In the ternary
phase equilibrium, some intermetallic phases exist in relatively narrow composition ranges unlike the B2 phase. Then, Reactant layer 1 is considered to be an intermetallic compound of (Au,Co)2Ti with C11b structure. On the other hand, the composition of the dark part of Fig. 4(b) depended on the distance from the point of ‘‘zero’’ as shown in Fig. 4(a). In the dark part, Co-layer side is Co rich (50– 60 mol%) and the TiAu-layer side is Co poor (20–40 mol%). It is, therefore, believed that the dark part is a solid solution of B2 Ti(Au,Co). As for Reactant layer 2, the composition ratio between (Ti,Au) and Co is approximately 1:2 and the composition was insensitive to the distance from the point
5µm
TiAu side Co side
bright part dark part (b)
DL: Diffusion layer RL1: Reactant layer 1 RL2: Reactant layer 2
Concentrarion,
C
(mol%)
0 40 60 80 100
Ti Au
Co
Distance, X/ µm DL
RL1 RL2
TiAu Co
(c)
0 20 40 60 80 100
20µm
Reactant layer 1 Reactant layer 2
0 X
(a)
Diffusion layer
TiAu Co
analyzed point
20
Fig. 4 (a) A SEM image near the TiAu/Co interface of the specimen fabricated at 1273 K for 10 h, (b) an magnification Reactant layer 1
obtained at (a), and (c) a concentration profile corresponding to (a).
Co TiAu
TiAu 1mm
[image:3.595.82.515.154.588.2] [image:3.595.331.513.212.379.2]of ‘‘zero’’ as shown in Fig. 4(b). The composition of Reactant layer 2 was 24–26 mol%Ti, 9–11 mol%Au and 64–66 mol%Co. According to the phase diagram, the inter-mediate phase formed was identified to be Co2(Ti,Au) with C36 structure.
The diffusion path deduced from the experimental results and Ti-Au-Co ternary phase diagram is shown in Fig. 7 (indicated by the bold line). When we focus on Co element, Co atoms diffuse from the Co-layer towards TiAu-layer by passing through the C36 and C11b phases. Thus, the dif-fusion path near the TiAu/Co interface is TiAu/TiAu(Co)/ (Au,Co)2Ti/Co2(Ti,Au)/Co(Ti,Au)/Co.
3.2 The Growth of the diffusion layer
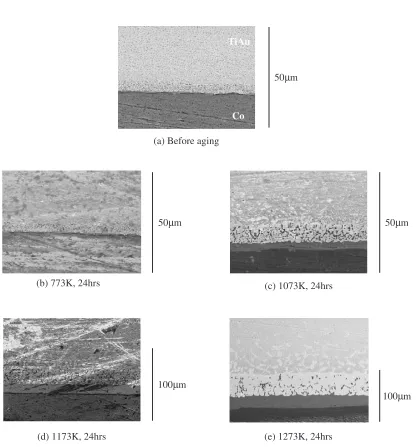
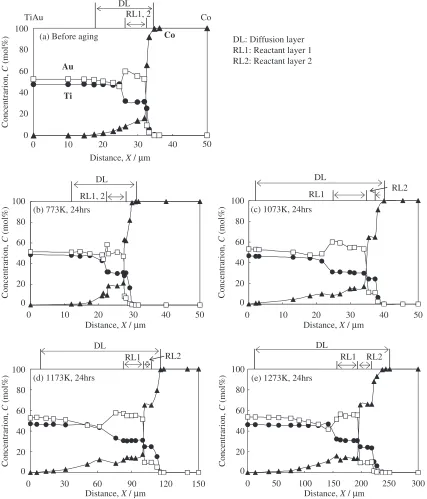
Intermetallic compounds with complex structures gener-ally brittle, hence, the suppression of formation and growth of the intermetallics is required to prevent the degradation of the bonding strength. In order to evaluate the growth of the diffusion layer, TiAu/Co composites hot pressed at 1173 and 1273 K for 10 h were cut into several pieces and they were aged at 773, 1073, 1173 and 1273 K for 24 h. Figure 8 shows SEM images near the TiAu/Co interface of the composite hot pressed at 1173 K before aging (a), after aging at 773 K (b), 1073 K (c), 1173 K (d) and 1273 K (e), respectively. Figure 9 shows the concentration profiles corresponding to Fig. 8. Table 2 shows the change in thickness of the diffusion layer due to the aging treatments. By comparing Fig. 8(a) and (b) or Fig. 9(a) and (b), the growth of the diffusion layer was not
TiAu Co
0 20 30 40
Ti Au
Co DL
RL1,2
Distance, X/ µm
Concentrarion,
C
(mol%)
0 20 40 60 80 100
(b)
10µm Diffusion layer
TiAu Co
Reactant layer 1
Reactant layer 2
0 X
(a)
10
Fig. 5 (a) A SEM image near the TiAu/Co interface of the specimen
[image:4.595.59.281.70.476.2]fabricated at 1173 K for 10 h, and (b) a concentration profile near the TiAu/Co interface corresponding to (a).
Table 1 Thickness of diffusion and reactant layers evaluated by
SEM-EDS.
Hot-pressing
condition Diffusion layer Reactant layer 1 Reactant layer 2
1273 K, 10 h 50mm 15mm 5mm
1173 K, 10 h 19mm 5mm 1mm
Ti
Au
Co
Tetragonal Hexagonal
C11b C36
Ti(Au,Co)2 (Ti,Au)Co2
(b)
Concentration of Ti,
CTi
(mol%)
80 60 40 20 0
20
40
60
80 20
40 60
80
C11b
C36 A15
B19
B2
B2
Alloys
C11b
C36
B2
B19
A15
(a)
Concentration of Au, CAu(mol%)
Concentration of Co,
C
Co
(mol%)
Fig. 6 (a) A portion of the Ti-Au-Co ternary phase diagram at 1173 K,18)and (b) Crystal structures of C11
b and C36 intermetallic
[image:4.595.304.549.96.147.2] [image:4.595.91.511.548.758.2]observed when the specimen was aged at 773 K. Then, it is expected that the composite must keep its properties during the service under 773 K at least for 24 h. However, as seen in Figs. 8 and 9, the thickness of the diffusion layer was increased with further increasing the aging temperature. Similar results were obtained for the composite hot pressed at 1273 K.
(d) 1173K, 24hrs (b) 773K, 24hrs
(e) 1273K, 24hrs
100µm 100µm
(c) 1073K, 24hrs
50µm 50µm
(a) Before aging TiAu
Co
50µm
Fig. 8 SEM images near the TiAu/Co interface before aging (a), after aging at 773 K (b), 1073 K (c), 1173 K (d) and 1273 K (e) for 24 h,
[image:5.595.59.285.71.283.2]respectively.
Table 2 The change of thickness of diffusion layer by the aging treatments.
It is noted that hot pressing was made at 1173 K for 10 h.
Before aging
773 K 24 h
1073 K 24 h
1173 K 24 h
1273 K 24 h
Diffusion
layer 19mm 19mm 38mm 109mm 240mm
Reactant
layer 1 5mm 5mm 10mm 17mm 37mm
Reactant
layer 2 1mm 1mm 2mm 6mm 21mm
Au Co
Ti
20 40
60 80
20
40
60
80 20
40 60
80
C36
C11b
Concentration of Ti,
CTi
(mol%)
Concentration of Au, CAu(mol%) Concentration of Co,
C C
o(mol%)
[image:5.595.304.549.94.191.2] [image:5.595.91.508.315.762.2]Based on these results, the growth of the diffusion layers was estimated as follows. The initial position of the TiAu/Co interface was not determined in this study. The width of the diffusion layer, X, was used to analyze the kinetics of the growth of the layer.X can be roughly expressed as,19,20)
X¼pffiffiffiffiffiffiffiffi2Dt ð1Þ
where D is the diffusion coefficient and t is the annealing time. The diffusion coefficientDat a temperatureTis given as,19,20)
D¼D0exp
Q RT
ð2Þ
whereQis the apparent activation energy for the growth of the diffusion layer,D0 is the diffusion constant andRis the gas constant. By using the results of the layer growth and eqs. (1) and (2), an Arrhenius plot of ln X vs. 1=T was made as shown in Fig. 10. QandD0 were estimated to be 28020kJ/mol and0:580:1m2s1, respectively.
3.3 Suppression of the reactant layer
In order to suppress the brittle failure during actuation, the thicknesses of the reactant layers must be sufficiently thin as well as the diffusion layer. By using the apparent activation energy for the growth of the diffusion layer, we can predict the growth of the diffusion layer. To suppress the reactant
0 20 40 60 80 100
0 50 100 150 200 250 300
DL
RL1 RL2
(e) 1273K, 24hrs
Concentrarion,
C
(mol%)
Distance, X/ µm 0
20 40 60 80 100
0 120 150
(d) 1173K, 24hrs DL
RL1 RL2
Distance, X/ µm
Concentrarion,
C
(mol%)
90 60
0 20 40 60 80 100
0 20 30 50
DL
RL2
(c) 1073K, 24hrs
Concentrarion,
C
(mol%)
Distance, X/ µm RL1
40
TiAu Co
0 20 40 60 80 100
0 10 30 50
Ti Au
Co
DL RL1, 2
Distance, X/ µm
Concentrarion,
C
(mol%)
DL: Diffusion layer RL1: Reactant layer 1 RL2: Reactant layer 2 (a) Before aging
0 20 40 60 80 100
0 30 40 50
(b) 773K, 24hrs DL
Distance, X/ µm
Concentrarion,
C
(mol%)
10 20
RL1, 2
20 40
30
10
Fig. 9 Concentration profiles near the TiAu/Co interface before aging (a), after aging at 773 K (b), 1073 K (c), 1173 K (d) and 1273 K (e)
[image:6.595.85.512.75.574.2]layers sufficiently, here, we believe that the thickness of the diffusion layer should be less than 10mm. By using the obtained Q and D0 and eqs. (1) and (2), an optimum hot pressing condition to make the thickness of the diffusion
layer less than 10mmwas estimated to be 1073 K for 10 h. Under the condition, the diffusion layer formed was calculated to be 12mm. According to this prediction, a TiAu/Co composite was actually made by hot pressing at 1073 K for 10 h. Figure 11(a) and (b) shows a SEM image and a corresponding concentration profile near the TiAu/Co interface, respectively. As shown in Fig. 11, the thicknesses of the diffusion layer and Reactant layer were around 7mm and 2mm, respectively. These values are in good agreement with the prediction, and it is calculated that the thickness of the diffusion layer is suppressed less than 10mmwhen the composite was hot pressed at 1073 K for 10 h.
4. Conclusions
(1) The thickness of the diffusion layer was increased with increasing the temperature for the hot-pressing: 19mm at 1173 K and 50mmat 1273 K.
(2) Two intermediate phases were formed near the TiAu/ Co interface, and they were identified to be C11b Ti(Au,Co)2and C36 (Ti,Au)Co2. Besides, the diffusion path near the TiAu/Co interface is determined as TiAu/ TiAu(Co)/(Au,Co)2Ti/Co2(Ti,Au)/Co(Ti, Au)/Co. (3) The growth of the diffusion layer was not observed
when aged at 773 K for 24 h. However, the thickness of the diffusion layer was increased with further increasing the aging temperature.
(4) The kinetics of the growth of the diffusion layer was quantitatively analyzed to control the thickness of the diffusion layer. The apparent activation energyQand the diffusion constant D0 were estimated to be Q¼ 28020kJ/mol and D0¼0:580:1m2s1, respec-tively. Based on these values, the optimum hot-pressing condition was determined to be the temperature of 1073 K and the duration of 10 h. The predicted thick-ness of diffusion layer (12mm) was in good agreement with the experimental value (7mm).
Acknowledgements
This work was supported by MEXT Grant-in-Aid for Fundamental Scientific Research on Priority Areas, No. 438 ‘‘Next-Generation Actuators Leading Breakthroughs’’ No. 17040014 (2005–2006) and No. 19016012 (2007–2008).
REFERENCES
1) G. S. Firstov, J. Van Humbeek and Yu. N. Koval: J. Intell. Mater. Syst.
Struct.17(2006) 1041–1047.
2) S. Miyazaki and K. Otsuka: ISIJ Intl.29(1989) 353–377.
3) W. Tang, B. Sundman, R. Sandstrom and C. Qiu: Acta Mater.47(1999)
3457–3468.
4) S. Miyazaki, V. H. No, M. Taniguchi and H. Suzuki: J. Phys. IV11
(2001) Pr8407.
5) K. Ullakko, J. K. Huang, C. Kantner, R. C. O’Handley and V. V.
Kokorin: Appl. Phys. Lett.69(1996) 1966–1968.
6) V. A. Chernenko: Scripta Mater.40(1999) 523–527.
7) A. Sozinov, A. A. Likhachev and K. Ulakko: IEEE Trans. Magn.38
(2002) 2814–2816.
8) M. Taya, T. Wada, M. Kusaka and C. C. Lee Ryan: Ind. Commercial
Appl. Smart Struct. Technol.5054(2003) 156–164.
9) Y. Furuya and T. Okazaki: J. JILM55(2005) 233–241.
8 7
1273 1173 1073
-8
-10
-12
Q = 280 ± 20kJ/mol
Reciprocal Temperature, 10-4 T-1/ K-1
Logarithm of distance, ln(
∆
X
/ m) hot pressed at 1173K
hot pressed at 1273K
T / K
[image:7.595.57.283.72.241.2]10 9
Fig. 10 Arrhenius plot ofln Xvs.1=T.
0 20 40 60 80 100
0 4 6 8 10 12
TiAu Co
Au
Ti
Diffusion layer Reactant layer
(b)
Concentrarion,
C
(mol%)
Distance, X/ µm
(a) TiAu Co
10µm
Reactant layer
Diffusion layer
0 X
2
Fig. 11 (a) A SEM image at the interface between TiAu and Co of the
[image:7.595.54.289.282.679.2]10) Z. G. Wei, R. Sandstrom and S. Miyazaki: J. Mater. Sci.33(1998) 3763–3783.
11) J. Van Humbeeck and G. Firstov: The forth Pacific Rim International Conference on Advanced Materials and Processing (PRICM4), eds.
S. Hanada, Z. Zhong, S. W. Nam and R. N. Wright:2(2001) p. 1871.
12) H. C. Donkersloot and J. H. N. Van Vucht: J. Less-Common Met.20
(1970) 83–91.
13) J. L. Murray: BINARY ALLOY PHASE DIAGRAMS, eds. T. B.
Massalski, J. L. Murray, L. H. Bernett and H. Baker: ASM (1986). 14) H. Hosoda, R. Tachi, T. Inamura, K. Wakashima and S. Miyazaki:
Mater. Sci. Forum561(2007) 1541–1544.
15) S. Miyazaki, S. Kimura, K. Otsuka and Y. Suzuki: Scr. Metall.18
(1984) 883–888.
16) T. Kawamura, R. Tachi, T. Inamura, H. Hosoda, K. Wakashima, K.
Hamada and S. Miyazaki: Mater. Sci. Eng. A438–440(2006) 383–386.
17) M. Ghosh, S. Chatterjee and B. Mishra: Mater. Sci. Eng. A363(2003)
268–274.
18) Y. Tsugane, T. Inamura, K. Wakashima and H. Hosoda: Advanced Intermetallic-Based Alloys, Materials Research Society Proceedings
980(2007) pp. II05-52-1.
19) P. G. Shewmon: Diffusion in Solids. Second Edition, (TMS,
Warrendale, PA 1989), Chapter 1, pp. 9–51.
20) P. G. Shewmon: Diffusion in Solids. Second Edition, (TMS,