Fracture Toughness Enhanced by Grain Boundary Shielding
in Submicron-Grained Low Carbon Steel
Masaki Tanaka
1;*, Naoki Fujimoto
2and Kenji Higashida
11
Department of Materials Science and Engineering, Kyushu University, Fukuoka 819-0395, Japan
2Graduate student: Department of Materials Science and Engineering, Kyushu University, Fukuoka 819-0395, Japan
The enhancement of toughness at low temperatures in fine grained low carbon steel was studied, basing on a shielding theory due to dislocations and grain boundaries. Fully annealed low carbon steel was subjected to an accumulative roll bonding (ARB) process for grain refining. The grain size perpendicular to the normal direction was found to be approximately 200 nm after the ARB process. The fracture toughness of low carbon steel ARB applied was measured at 77 K by four-point bending, comparing with the fracture toughness of those without the ARB process. It was found that the value of fracture toughness at 77 K was increased by grain refining due to the ARB, indicating that the ARB process enhances toughness at low temperatures as reported in interstitial free steel and phosphorus doped interstitial free steel. It also deduces that the brittle-ductile transition (BDT) temperature shifted to a lower temperature. The enhancement of toughness and the decrease of the BDT temperature due to grain refining cannot be explained completely by the dislocation pile-up model of dislocations at grain boundaries. Quasi-two-dimensional simulations of dislocation dynamics, taking into account of crack tip shielding due to dislocations, were performed to investigate the effect of a dislocation source spacing along a crack front on the BDT. The simulation indicated that the BDT temperature is decreased by decreasing the dislocation source spacing. In addition to the simulation, the authors suggest a new concept of accommodating stress intensity at the crack tip due to grain boundaries to explain the enhancement of toughness and the decrease of the BDT temperature in fine grained materials. [doi:10.2320/matertrans.ME200711]
(Received July 10, 2007; Accepted September 4, 2007; Published October 11, 2007)
Keywords: dislocations, shielding effect, poly-crystal, brittle-ductile transition, ultra-fine grained
1. Introduction
Grain refining is one of the powerful methods in order to enhance mechanical property, especially strength of the materials. Severe plastic deformation, such as equal-channel angular pressing (ECAP),1,2) shot peening,3,4) high pressure torsion (HPT),5,6) accumulative roll bonding (ARB)7,8) and so on, have attracted many interests to produce materials with ultrafine grained structures. Tsuji et al.9)reported that interstitial free (IF) steel and phosphorous doped IF steel gained high strength without losing much toughness at low temperatures by the ARB process. High ductility is seen in the materials after the ARB process even at low temperatures such as the liquid nitrogen temperature. This indicates that the brittle-ductile transition (BDT) temperature of IF steel is decreased to a lower temperature by grain refining.
In single crystals, the basic mechanism of the BDT and enhancement of toughness is now understood by an idea of stress accommodation due to dislocations at a crack tip, so-called ‘‘dislocation shielding’’.10,11) Many experimental works have been done for clarifying the theory, using silicon crystals as a model crystal.12–15)As a result, the BDT is found to be controlled by a thermal process of dislocation glide, which have been confirmed by the fact that the value of activation energy for BDT is the same as that for dislocation glide in many materials, such as semiconductors, bcc metals etc..15–18) In poly-crystals, the grain size dependence of strength has been explained by the pile-up model of dislocations at grain boundaries.19) However, no previous work, based on the shielding theory, has attempted to explain the grain size dependence of fracture toughness and the BDT. A simple application of the pile-up model into the shielding theory implies that fracture toughness would be rather
decreased and the BDT temperature would be increased as decreasing the grain size since the grain boundaries play a role as obstacles for dislocation glide, which prohibits continuous emissions of dislocations at the crack tip. There-fore, another explanation is required in order to understand the mechanism of the enhancement of the BDT in ultra-fine grained materials.
In the present study, the first step for understanding the mechanism of the enhancement of toughness at low temper-atures after the ARB process was attempted, basing on the crack tip shielding theory. Low carbon steel was firstly subjected to the ARB process in order to obtain a fine grained structure. Fracture toughness was measured by four-point bending tests, comparing with the results of fully annealed low carbon steel. Simulations of quasi-two-dimensional dislocation dynamics were also performed in order to discuss the effect of dislocation source spacing along a crack front on the BDT temperature. In addition to the simulation, a new concept of grain boundary shielding was suggested in this paper.
2. Experimental
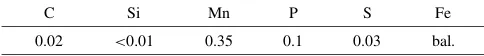
[image:1.595.304.546.747.775.2]Low carbon steel, the chemical composition of which is shown in Table 1, was employed. Since low carbon steel ex-hibits rather high ductility, P was slightly doped to reduce its ductility and to demonstrate a remarkable effect of grain-re-fining on the fracture toughness at low temperatures. Cold-rolled 2 mm thick sheets were annealed at 1023 K for 3.6 ks in
Table 1 Chemical composition of the material used.
C Si Mn P S Fe
0.02 <0:01 0.35 0.1 0.03 bal.
mass%
*Corresponding author, E-mail: masaki@zaiko.kyushu-u.ac.jp
Investigating Role of High-Density Lattice Defects
order to complete recrystallisation. The grain size of the fully annealed sheets was found to be 0.8 mm. The sheets were cold-rolled by 50% reduction in thickness for a subsequent ARB process. The cold-rolled252001mm sheets were provided to the ARB process for three cycles. The ARB proc-ess was performed at 773 K, though the detail is shown in elsewhere.9)The final equivalent strain was 2.93. Miniature size of four-point bending samples were cut out from the sheet after the ARB process. Figure 1 shows a schematic drawing of the four-point bending specimen, exhibiting the normal direction (ND), rolling direction (RD) and transverse direction (TD) of the sheet. Inner and outer beam distances were 4 mm and 10 mm, respectively. A notch with a depth of 100mm was introduced perpendicular to TD on the tensile surface of each specimen. The same size bending samples were also cut out from a sheet without the ARB process for comparison. The strain rate at the tensile surface was set to be 4:5104s1. Four point bending tests were carried out at
77 K to measure fracture toughness with six and seven speci-mens in fully annealed and ARBed samples, respectively.
3. Results
Figure 2 shows a TEM bright field image of a sample just after the ARB process, observed from TD. Some grains contain dislocations of high density. Grains are elongated to the direction parallel to RD. It was found that the grain size perpendicular to RD is approximately 200 nm, showing that ultra-fined grains actually developed in low carbon steel by the ARB process.
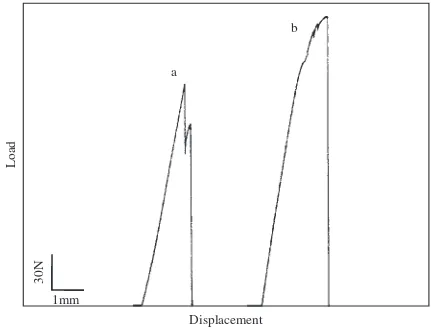
Figure 3 shows load-displacement curves obtained at 77 K at a strain rate of 4:5104s1. Curve (a) from an as
annealed sample indicates a curve of typical brittle fracture, where rapture took place without any applicable plastic deformation. Curve (b) from an ARBed sample shows slight plastic deformation just before it broke. It corresponds to the result shown by Tsujiet al.9)that the absorption energy of ARBed materials measured by Charpy impact tests at 77 K is higher than that for large grained.
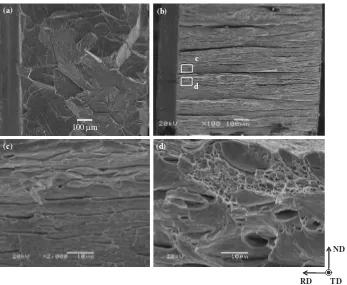
Figure 4(a) shows a SEM image from the as annealed sample cleaved at 77 K, indicating a typical transgranular fracture surface where a crack extended from the beneath of the notch (from left to right in the figure). This corresponds to Curve (a) in Fig. 3, where the specimen fractured without any applicable plastic deformation. Figure 4(b) shows a SEM
image from the ARBed sample fractured at 77 K. Six layers of about 100–200mmwidth are seen parallel to RD due to ARB process. Figure 4(c) shows an enlarged image of the area surrounded by a rectangle of (c) in Fig. 4(b), indicating a brittle fracture surface. Grains are elongated along RD due to the ARB process as seen in Fig. 2. Almost all the area of the fracture surface indicate the brittle fracture surface of this kind. Figure 4(d) shows an enlarged image of the area surrounded by a rectangle of (d) in Fig. 4(b), exhibiting dimples on the fracture surface. This indicates that local plastic deformation took place during crack advance, which corresponds to Curve (b) in Fig. 3.
Fracture toughness, Kf, in a four-point bending test is given by Ref. 20):
Kf ¼f
ffiffiffiffiffiffi c p
fðÞ with ¼c=h;
fðÞ ¼1:1121:40þ7:33213:083þ14:04; ð1Þ
wheref is the fracture stress,cis the crack length andhis the specimen height. The fracture toughness of as annealed and ARBed samples was measured at 77 K at a strain rate of 4:5104s1 on a tensile surface of the beam.
1 mm a
10mm
1 mm
4 mm TD RD
ND
Fig. 1 Schematic drawing of a miniature four-point bending sample. Inner and outer beam distances were set to be 4 mm and 10 mm, respectively. Normal direction (ND), rolling direction (RD) and transverse direction (TD) are exhibited in the figure.
Fig. 2 Bright field TEM image of a sample with the ARB process before four-point bending. Grains are elongated to the direction parallel to RD. The grain size parallel to the ND is found to be 200 nm.
1mm
30N
a
b
Displacement
Load
[image:2.595.307.547.72.246.2] [image:2.595.63.271.75.178.2] [image:2.595.318.535.304.469.2]Table 2 shows the values of fracture toughness of as annealed and ARBed samples fractured at 77 K as shown in Fig. 3. The measured values were statistically treated to show the average values with the standard deviations in the table. The values of the fracture toughness of ARBed and fully annealed samples are found to be38:52:2MPam1=2 and 22:52:9MPam1=2, respectively. The error ranges are much smaller than the difference in the two average values, indicating that the difference in fracture toughness is not due to the experimental error. The fracture toughness of low carbon steel was increased by the ARB process, that is, the toughness of the material was enhanced by such grain refinement. This is in good agreement with the result of Charpy impact tests obtained by Tsuji.9) Two kinds of mechanisms which enhance the ductility of fine grained materials at low temperatures will be discussed in the next session.
4. Discussion
4.1 Accommodation of stress intensity at a crack tip due to dislocations
When an external stress is applied on a specimen with a crack, the stress, ij, near a crack tip in the absence of dislocations is expressed by polar coordinates (r,):
ij¼
KI
ffiffiffiffiffiffiffiffi
2r
p fijðÞ; ð2Þ
where KI is the stress intensity factor given as KI¼ a=ð2rÞ1=2S (a: applied stress,a: crack length,S: speci-men shape factor), fijðÞis function of, andris the distance from the crack tip. When dislocations are emitted from the crack tip and stay around there, the intensified stress, ij, is modified by the superposition of the stress field due to the dislocations. The stress near the crack tip due to the dislocations,D
ij, is given by: ijD¼ kffiffiffiffiffiffiffiffiD
2r
p fijðÞ; ð3Þ
wherekDis the stress intensity factor caused by dislocations, given by the following equation:21,22)
kD¼
X
i
3bi
ð1Þ ffiffiffiffiffiffiffiffiffi2ri
p cosi
2sini
; ð4Þ
where is shear modulus, b is the scalar of the Burgers vector. When an applied stress and dislocations are present, the total stress near the crack,ijT, is derived from eqs. (1) and (2),
ijT ¼ijþijD¼ ðKIþkDÞfijðÞ= ffiffiffiffiffiffiffiffi
2r
p
kIfijðÞ= ffiffiffiffiffiffiffiffi
2r
p ;
ð5Þ
with kI ¼KIþkD: ð6Þ
HerekI is termed ‘‘local stress intensity factor’’.23,24) The crack extension force in the plane strain condition under a simple mode I stress field is given by:
(c) (d)
100µm
(a) (b)
c
d
RD ND
TD
[image:3.595.125.472.70.355.2]Fig. 4 SEM micrographs of fracture surfaces. (a) Fully annealed sample without the ARB process, indicating a typical brittle fracture surface. (b) ARB applied sample, indicating elongated grains parallel to RD. Almost all the areas exhibit brittle fracture surface shown in (c) while some local plastic deformation are observed as seen in (d). (c) and (d) are the enlarged image corresponding to the areas surrounded by rectangles in (b).
Table 2 Fracture toughness of the materials at 77 K.
As annealed ARB applied
Fracture toughness
[image:3.595.46.291.430.468.2]Fc¼
k2
I
E ð1
2Þ; ð7Þ
whereEis the Young’s modulus.
Opposing this elastic force is a resistive force due to the surface energy. The criterion for the crack extension is given with the surface energy,:25)
Fc¼
k2
I
E ð1
2Þ ¼2: ð8Þ
Replacing kI in eq. (6) with (8) gives the applied stress intensity factor for crack extension,
KIC ¼
ffiffiffiffiffiffiffiffiffiffiffiffiffi
2E
12
r
kD: ð9Þ
When dislocations are introduced by an external tensile load, the sign ofkDterm due to dislocations is negative to restrain the concentration of tensile stress around the crack tip, which was confirmed by direct TEM observations of dislocations around a crack tip.26,27)This means that the stress intensity due to the dislocations generated around the crack is compressive which is against the external applied stress. Therefore, the applied stress intensity factor increases, i.e., the fracture toughness increases. This idea is called ‘‘shield-ing effect’’ due to dislocations.
4.2 Model for two dimensional dislocation dynamics simulation
Hirsch and Roberts28)summarised the BDT temperature of single crystal silicon from several groups and plotted ln(strain rate), ln _"", against reciprocal BDT temperature, 1=TBDT, showing that each line from the collected data exhibits the same angle of slopes in the ln _""-1=TBDT diagram but shows different interceptions of the lines with the axis ofln _"". This indicates that the activation energy for the BDT is constant over the whole results used, being independent from the shape or measure of the experiment, however, the BDT temperature depends on the way of the experiment. Hirsch pointed out from the result that the BDT temperature depends on the number of dislocation sources and spacing along a crack front. Here, the effect of the dislocation source spacing is evaluated, using a following model of dislocation glide from a crack tip.
Figure 5 shows a schematic drawing of a quasi-two-dimensional model for dislocation dynamics simulation employed in this study, which is suggested by Roberts et al.29)A crack was loaded in a simple opening mode with a constant rate dKI=dt¼0:01MPam1=2s1. The other com-ponents of modes II and III were set to be zero. Dislocation sources, marked as S in Fig. 5, locate along a crack front at
the distance ofds¼10bfrom the crack front. The dislocation sources locate at intervals of2dcrit ahead and parallel to the crack front as shown Fig. 5. Dislocations emitted from each source and bow out on a slip plane with an angle of 45with respect to the crack plane, forming concentric loops. This geometry of the crack and slip plane corresponds to a system of ð010Þ½100crack and ð1110Þslip plane. The basic idea of this model is that dislocations need to travel a certain distance to shield the crack tip efficiently. When a dislocation loop travels a distance of dcrit, a segment of dislocation loop
perpendicular to the crack front meets another loop segment coming from the next source. Since they have the same Burgers vector but opposite dislocation line vector, they react and vanish. Then, only a loop segment parallel to the crack front remains at the distance of2dcritfrom the crack front. In the present study, the value of shielding at the positionZcriton the crack front in Fig. 5 is calculated.
The criterion for the first dislocation to emit was defined with a total force on the first dislocation, fd1, exceeds zero:
fd1>0 with fd1¼ faþfm; ð10Þ
where faand fmare the force due to applied stress intensity and mirror force, respectively. Once the first dislocation emitted, dislocation-dislocation interaction force, fdd, is also taken into account for the emission criterion, i.e., fdd was added in the right hand term in eq. (10).
Dislocations generated at the crack tip glide away from the crack tip on a slip plane with an angle of 45with respect to the crack plane as shown in Fig. 5, where dislocations do not cross slip in this model. The velocity of theithdislocation in iron is described by an Arrhenius type empirical low of the form:30)
vi¼vo
i d 0
m
exp Q
kT
; with id¼ f i d
b; ð11Þ
wherev0,0and m are constants,kis the Boltzmann constant,
T is the absolute temperature andQis the activation energy for dislocation glide. The values of the constant parameters used in Equation (11) are obtained from the result of the direct measurement of dislocation velocity in pure iron at 198 K in Ref. 30). The activation energy for dislocation glide used in this study was obtained by Burnner et al.31) as an activation enthalpy for a double kink nucleation along a screw dislocation in iron. The value is the same with that for BDT. Those parameters are listed in Table 3. The calculation was terminated when the local stress intensity factor, kI, exceeds 0.8 MPam1=2 which is calculated from a value of
surface energy and Yong’s modulus of iron.32)
4.3 Calculated BDT temperatures
Figure 6(a) and (b) show calculatedKa,kI andkDat 80 K plotted against time with dcrit of 5 nm and 50 nm, respec-tively. Ka, applied stress intensity factor, increases linearly
S
S 2dcrit
2dcrit
θ
Zcrit
KA
Fig. 5 Quasi-two-dimensional model for dislocation dynamics simulation after Robertset al.29)Dislocation sources locate at a crack tip where the
source spacing is 2dcrit. The local stress intensity factor at Zcrit was
calculated. Dislocations need to travel 2dcrit to shield the crack tip
[image:4.595.322.529.73.201.2]with increasing time with a slope of 0.01 MPam1=2s1. Since
shielding dislocations emitted from the crack tip, the sign of kD denotes negative value.kD drops every time when each segment of dislocation loops reaches2dcritfrom the crack tip, when the dislocation starts to shield the crack tip.kIincreases with the same increment with that of Ka until the first dislocation reaches 2dcrit from the crack tip, then kD drops from Ka due to shielding by dislocations. kI also oscillates due to the oscillation ofkD.Kf is obtained from the value of KawhenkIexceeds 0.8 MPam1=2, which is calculated from the surface energy of iron in eq. (9). Figure 6(b) shows a graph in such a case that 2dcrit is set to be 50 nm. When a dislocation source spacing increases,klreaches 0.8 MPam1=2 faster than in case of 2dcrit¼5nm, hence Kf for 2dcrit¼ 50nm is smaller than that for2dcrit¼5nm at 80 K.
Figure 7 shows calculated fracture toughness against temperature. Solid square, circle and triangle indicate results for2dcritof 5 nm 50 nm and 300 nm, respectively. The values of fracture toughness are much lower than those experimen-tally obtained in the present study. This is due to a usage of the simplified model in the simulation, where only a single source and slip plane are activated.
In this study, the BDT temperature is defined as a temperature at which fracture toughness increases from the value derived from Griffith level (0.8 MPam1=2:Dashed line in Fig. 7). It is to be noted here that the BDT curve shifts to right with increasing the value of2drict. It indicates the BDT temperature decreases with decreasing the dislocation source spacing. This result of simulation assumes that the enhance-ment of toughness of the material subjected to ARB is due to
decreasing the source spacing along the crack front. In this simulation, the effect of grain boundaries ahead of the crack tip is not taken into account. The effect will be considered in the next sub-session.
4.4 Grain boundary shielding
As pointed out previously in the present paper, the classical pile-up model cannot fully explain the enhancement of toughness of materials at low temperatures due to reducing the grain size. Since the volume fraction of grain boundaries is relatively higher than that of conventional grained materials, it is deduced that not only dislocations emitted at the crack tip but also grain boundaries accommodate the stress intensity at the crack tip, which can be termed ‘‘grain boundary shielding’’.
[image:5.595.319.530.70.227.2]Figure 8 shows a simplified concept of the grain boundary shielding, in which a crack is loaded under mode I tensile stress. Grain boundaries are shown by dashed lines. When the applied load is increased, the shear stress (dashed arrows in Fig. 8(a)) on a slip plane ahead of the crack tip is also increased, and then a dislocation is emitted from the crack tip. An edge dislocation, for instance, is emitted as shown in the figure. The dislocation has such a stress field that shown by solid arrows in Fig. 8(b), shielding the crack tip. It is the concept of ‘‘shielding effect’’ due to dislocations discussed in the previous sub-session. When the dislocation approaches a grain boundary, the dislocation is absorbed at the grain boundary (Fig. 8(c)). It is to be noted here that even though the dislocation is absorbed at the grain boundary, the stress field due to the dislocation still remains around the grain boundary. Actually, Shimokawaet al.calculated interactions between edge dislocations and a tilt grain boundary by quasi-continuum simulations,33) in which edge dislocations gen-erated from a crack tip and glide away to a title grain boundary under a shear stress. They indicate that the dislocations are absorbed at the grain boundary, remaining their stress around there. The result of the simulation deduces the existence of the stress which still accommodates stress intensity at the crack tip even though the dislocation is absorbed at the grain boundary. When the stress field in the next grain becomes high enough, another dislocation emit at the grain boundary in the next grain and glide away to the Table 3 Parameters used for dislocation dynamics simulation.
m v0[m/s] 0[MPa] Q [eV]
4.48 133:57103 1.0 0.33
(a) dcrit = 5 nm
(b) dcrit = 50 nm
Stress intensity f
actor / MP
a·m
1/
2
20 40 60 80
Time / s Ka
kI
Ka
kD
kD
kI
100
20 40 60 80 100
Stress intensity f
actor / MP
a·m
1/2
0.2 0.4 0.6 0.8 1.0
-0.2 0.0
0.2 0.4 0.6 0.8 1.0
-0.2 0.0
Fig. 6 Calculated stress intensity factors with dKa=dt¼0:01
MPam1=2s1 at 80 K.k
IandkD drop when each dislocation travel the
distance of2dcritfrom the crack tip. (a)2dcrit¼5nm, (b)2dcrit¼50nm.
Fractrue toughness, K
f
/ MPa·m
1/2
Temperature / K
5 nm 50 nm 300 nm Griffith level
60 70 80 90 100 110 120 130
0.4 0.6 0.8 1.0 1.2 1.4
Fig. 7 Calculated fracture toughness against temperature in case2dcritis
[image:5.595.50.289.80.369.2]next grain boundary (Fig. 8(d)), which is well explained in the Hall-Petch relation.
In polycrystalline materials, a crack front intersects with many grains. When the applied load increases, dislocations generate some of grains along the crack front and glide forward against the grain boundaries to be absorbed, remaining the stress field which accommodates the crack tip stress intensity. If the grain size is finer, absorption sites of dislocations and the distance between the sites and crack tip is closer, which can shield the crack tip more efficiently than one with large grains.
This model is so simplified in order to demonstrate the concept of ‘‘grain boundary shielding’’ that some problems need to be overcome, such as how many dislocations can be absorbed, or what kind of dislocation arrangement is the most stable at the grain boundary and so on, for the complete understanding of the mechanism. In addition, the effect of texture on toughness, which is developed after the ARB process,34)also needs to be taken into account.
5. Conclusion
The fracture toughness of low carbon steel was increased at 77 K by refining the grains down to sub-microns by the ARB. The ARBed sample showed local plastic deformation at 77 K at which the fully annealed sample cleaved without any plastic deformation. Quasi-two dimensional simulations of dislocation dynamics, basing on the dislocation shielding theory, indicate that the brittle-to-ductile transition temper-ature is decreased as reducing the dislocation source spacing. A new concept of grain boundary shielding was also
suggested to explain the enhancement of toughness in ultra-fine grained materials.
Acknowledgements
The authors appreciate Prof. N. Tsuji and Prof. N. Takata for sample preparations. This work was partly supported by Ministry of Education, Science, Sports and Culture, Grant-in-Aid for Scientific Research on Priority Areas (18062002).
REFERENCES
1) V. M. Segal, V. I. Reznikov, A. E. Drobyshevskiy and V. I. Kopylov: Russ. Matall.1(1981) 99–105.
2) Z. Horita, M. Furukawa, M. Nemoto and T. G. Langdon: Mat. Sci. Tech.16(2000) 1239–1245.
3) K. Lu and J. Lu: J. Mater. Sci. Technol.15(1999) 193–197. 4) Z. G. Liu, H. J. Fecht and M. Umemoto: Mater. Sci. Eng.A375–377
(2004) 839–843.
5) N. A. Smirnova, V. I. Levit, V. I. Pilyugin, R. I. Kuznetsov, L. S. Davydova and V. A. Sazonova: Fiz. Met. Metalloved.61(1896) 1170– 1177.
6) G. Sakai, Z. Horita and T. G. Langdon: Mat. Sci. Eng.A393(2005) 344–351.
7) Y. Saito, N. Tsuji, H. Utsunomiya, T. Sakai and P. G. Hong: Scripta Mater.39(1998) 1221–1227.
8) N. Tsuji, Y. Saito, H. Utsunomiya and S. Tanigawa: Scrpita Mater.40 (1999) 795–800.
9) N. Tsuji, S. Okuno, Y. Koizumi and Y. Minamino: Mater. Trans.45 (2004) 2272–2281.
10) J. R. Rice and R. Thomson: Phil. Mag.29(1974) 73–97. 11) S. Majumdar and S. J. Burns: Acta. Met.29(1981) 579–588. 12) C. St. John: Philos. Mag.32(1975) 1193–1212.
13) K. Higashida, M. Tanaka, A. Hartmaier and Y. Hoshino: Mater. Sci. Eng. A,in press(doi:10.1016/j.msea.2006.12.174)
14) A. George and G. Michot: Mater. Sci. Eng.A 164(1993) 118–134. 15) P. B Hirsch, S. G. Roberts and J. Samuels: Proc. R. Soc. London A421
(1989) 25–53.
16) P. Gumbsch, J. Riedle, A. Hartmaier and H. F. Fischmeister: Science 282(1998) 1293–1295.
17) A. Giannattasio, M. Tanaka, T. D. Joseph and S. G. Roberts: Physica ScriptaT128(2007) 87–90.
18) F. C. Serbena and S. G. Roberts: Acta Metall. Mater.42(1994) 2505– 2510.
19) E. O. Hall: Proc. Phys., Ser. B64(1951) 747–753.
20) W. F. Brown Jr. and J. E. Srawley: ASTM STP410(1966) pp. 1–65. 21) R. Thomson:Physics of fracture in solid state physics, (H. Ehrenreich
& D. Turnbull (Eds.), Academic, New York, 1986) pp. 1–129. 22) K. Higashida and N. Narita: JJAP Ser.2, Latice Defects in Ceramics
(1989) 39–43.
23) I.-H. Lin and R. Thomson: Acta. Met.34(1986) 187–206.
24) N. Narita, K. Higashida and S. Kitano: Scripta Met.21(1987) 1273– 1278.
25) A. A. Griffith: Phil. Trans. Roy. Soc. Lond.A221(1920) 163–198. 26) K. Higashida, N. Narita, M. Tanaka, Y. Miura and R. Onodera: Philo.
Mag.A82(2002) 3263–3273.
27) M. Tanaka and K. Higashida: Mater. Sic. Eng.A400(2005) 426–430. 28) P. B. Hirsch and S. G. Roberts: Philos. Trans. R. Soc. London, A355
(1997) 1991–2002.
29) S. G. Roberts, P. B. Hirsch, A. S. Booth, M. Ellis and F. C. Serbena: Physica ScriptaT49(1993) 420–426.
30) A. P. L. Turner and T. Vreeland: Acta Metall.18(1970) 1225–1235. 31) D. Brunner and J. Diehl: Phys. Stat. Sol. (a)124(1991) 455–464. 32) B. Mutasa and D. Farkas: Surface Science415(1998) 312–319. 33) T. Shimokawa, T. Kiritani and S. Shintaku: Phys. Rev.B75(2007)
144108.
34) N. Kamikawa, N. Tsuji and Y. Minamino: Sci. Tech. Advanced Mat.5 (2004) 163–172.
Crack
Grain boundary
Crack
Dislocations absorbed Crack Shear stress on a slip plane
Crack
Shear stress due to a dislocation Crack tip shielding stress
due to a dislocation
Dislocation emissions at the next grain (b)
(a)
(c) (d)
[image:6.595.65.270.74.291.2]