Measurement of Thermal Conductivity of Magnesia Brick
with Straight Brick Specimens by Hot Wire Method
Yoshitoshi Saito
1, Kinji Kanematsu
2and Taijiro Matsui
11
Refractory Ceramics R&D Division, Environment & Process Technology Center, Technical Development Bureau, Nippon Steel Corporation, Futtsu 293-8511, Japan
2Nippon Steel Technoresearch, Futtsu 293-8511, Japan
As a result of a revision of the JIS system, the application of the hot wire method for determining thermal conductivity has been expanded from heat-insulating bricks to refractories with higher heat conductivity. In this regard, focusing on magnesia bricks, which are used in the safety lining of converters and a wide variety of other applications, the authors studied the possibility of applying the non-stationary hot wire method in the determination of thermal conductivity up to the high-temperature range by using straight brick specimens. To perform measurements on magnesia bricks, whose thermal conductivity is higher than that of heat-insulating bricks, a set of measurement equipment including a high-capacity electric furnace was constructed, and as a result, it was possible to confirm the linear relationship between the increase in temperature
of the hot wire and the logarithm of timelogtby using straight brick specimens. It is possible to determine the thermal conductivity accurately by identifying the critical point where thelogtrelationship ceases to be linear and calculating the thermal conductivity of the target material on the basis of the linear relationship. [doi:10.2320/matertrans.M2009098]
(Received March 19, 2009; Accepted August 11, 2009; Published October 25, 2009)
Keywords: straight bricks, magnesia brick, thermal conductivity, hot wire method, converters
1. Introduction
Energy conservation is becoming increasingly important, and as a consequence, the enhancement of the thermal efficiency of industrial furnaces used in the production of steel and in other industries is becoming essential. Heat loss through furnace walls can be effectively reduced by lowering the thermal conductivity of the refractories and the heat-insulating materials used for lining the inside of the furnaces. While there has been an increased awareness of the importance of accurately calculating the thermal conductiv-ity of refractory and heat-insulating materials for furnace design, these values fluctuate considerably depending on the method and the measurement conditions.1–4) In this regard,
the method of stationary heat flow and the hot wire method have been used for determining the thermal conductivity of heat-insulating bricks under JIS R 2616. However, the Standardization Committee of the Technical Association of Refractories, Japan, has promoted the expansion of the application of these methods to more heat-conductive refractory materials, such as oxide systems. As a result, in 2007 the hot wire method was defined in the JIS system (R 2251-1) as a method for measuring the thermal conductivity of refractories in the range of 10 Wm1K1and lower.
Even before the revision, Hayashi et al.5,6) pursued the
possibility of applying the hot wire method not only to materials with low thermal conductivity, such as heat-insulating bricks, but also to refractories and ceramics with high thermal conductivity, and studied the measurement conditions for these materials. In performing measurements with the hot wire method, there are certain assumptions in using the theoretical equations related to the process of calculating the relevant thermal conductivity.7) One of the assumptions is that the specimen size is regarded as infinite during the measurement. This suggests that it is necessary to finish the measurements before the heat flow from the hot wire reaches the outer surfaces of the specimen. The time
required for the heat flow to reach the specimen surface depends on the thermal diffusivity, the specific heat capacity and the thermal conductivity of the material, where the specimen size is of particular importance in the application of the hot wire method to materials with high thermal conductivity.8)Aiming at expanding the field use of the hot wire method for determining the thermal conductivity of not only heat-insulating bricks, but also other types of refractory materials, Haupin reported that materials with higher con-ductivity require proportionally larger specimens.9)Hayashi et al.6,8) studied and defined the minimum specimen size
required for accurately determining the value of the thermal conductivity. Moreover, according to Van der Held and Van Drunen,10) materials with higher conductivity require
pro-portionally larger specimens. They point out that thermal diffusivity affects the shape of the curve in plotting the temperature against the log of the time. More specifically, the first part of the plot is curved and gradually becomes linear with time until the size of the specimen becomes a factor, which is the point where the relation ceases to be linear again. Therefore, they limited the analysis to the linear portion of the plot and obtained an equation for the thermal conductiv-ity. Another necessary condition for measuring the thermal conductivity with the hot wire method is that the temperature of the specimen should be uniform in the material and should be maintained at a predefined level.11) Although this is
bricks, and baked and fused mullite bricks for temperatures between room temperature and 1473 K. The thermal con-ductivity of these materials is around 2.0 Wm1K1 or
lower. They have not measured the thermal conductivity of materials with higher thermal conductivity using straight bricks or larger specimens.
On the other hand, an advantage of the hot wire method is that it is not necessary to form specimens into specific shapes by preprocessing, and various materials can be measured as industrially manufactured. When evaluating the quality of refractory materials, straight bricks or small test pieces cut from such bricks are usually used as specimens, and thus it is appropriate that any quality aspects can also be evaluated using straight bricks as specimens. In this respect, the hot wire method can be applied by utilizing straight bricks as specimens without the need for pre-processing. Using this method, two straight bricks are used without pre-processing to form a specimen set, with a heating wire and a thermo-couple placed between the two bricks. The size of the set
is as large as 230114130mm, and to measure the
thermal conductivity at high temperatures with this specimen configuration, it is necessary to use the isothermal zone of a sufficiently large furnace. In this regard, although Hayashi et al.extensively studied the conditions and the measurement error with simple and small furnaces, they did not examine the conditions, the accuracy, and other parameters in the measurement of the thermal conductivity at high temper-atures with straight brick specimens.
For ease of measurement and simplicity of equipment with regard to refractories, where measurements at high temper-atures are more important than measurements at room temperature, it is desirable to obtain reliable values for the thermal conductivity by using the hot wire method with straight brick specimens. Thus, it will be possible to utilize this method for straight brick specimens without the need to form the specimens into a specific shape or any other preprocessing. In consideration of the above, the authors focused their attention on magnesia bricks, which are used for safety lining of converters and various other applications, and studied a method for determining the value of the thermal conductivity on the basis of measurements with the non-stationary hot wire method using straight brick specimens. This paper reports the findings of this study.
2. Experiment
2.1 Specimens
As the hot wire method is not applicable to electrically conductive bricks such as carbon blocks, we chose magnesia bricks as an example of the extension of the hot wire method to refractory materials with high heat conductivity. Table 1 shows the chemical composition of the target bricks. The specimens are straight bricks 23011465mm in size, in accordance with JIS R 2101 standard. To verify the suitability and the accuracy of the equipment used for measuring the thermal conductivity based on the hot wire method, which the authors constructed specifically for this study, heat-insulating bricks were used for comparison as specimens representing the heat-insulating bricks as specified in JIS. For the same purpose, heat-insulating brick specimens
were also measured with the stationary heat flow method in accordance with JIS R 2616 by using HC-51 (ceramics application type, EKO Instruments Co., Ltd).
2.2 Test equipment and measurement method
2.2.1 Hot wire method
Figure 1 shows a schematic outline of the structure of the test equipment for the hot wire method. The measurement equipment proper consisted of two sections of electrical circuits, namely a power supply and a temperature measure-ment section. Connected to this measuremeasure-ment equipmeasure-ment proper were a heating furnace for measurements at high temperatures, a digital multimeter (34420A, Agilent Tech-nologies), a DC power source unit (EX-375L2, Takasago Ltd.), an interface unit for automatic measurement, calcu-lation and control (Spectra Inspection Laboratory Co., Ltd. (SPEIN Lab.)), and a PC. To measure the thermal con-ductivity in the temperature range between room temperature and 1500C (1773 K), an electric heating furnace (Taiho
Denki Seisakusho Co., Ltd.) was equipped with six silicon carbide heating elements arranged horizontally on each side of the furnace, for a total of twelve elements. The inner
dimensions of the furnace were200400300mm, with
an effective inner volume of150300130mm, which is sufficiently large to accommodate a specimen with a size of
114230130mm composed of two straight bricks which have not been pre-processed in any way. The temperature in the furnace was controlled by an automatic temperature controller (Chino DZ1000) connected to three independent electric circuits for the heating elements corresponding to HIGH, MEDIUM, and LOW. The bottom-loading design of the furnace considerably simplified the process of loading the specimen set with the hot wire and the thermocouple.
A Pt13%Rh wire with a diameter of 0.3 mm (hereinafter referred to as the hot wire), with a temperature measurement junction consisting of a Pt-Pt13%Rh thermocouple with a diameter of 0.2 mm welded onto it, was placed between the center of the faces of two straight brick specimens, and the bricks were tightly fastened to each other with Pt wires with a diameter of 1 mm at two positions near the ends. The specimen set was placed inside the furnace and was heated to prescribed measurement temperatures. The optimal timings for commencing the measurements are determined as follows. After confirming that the temperature of the speci-men had not fluctuated by more than0:1C over 5 min at
[image:2.595.305.548.95.135.2]that temperature, a predefined current was passed through the hot wire. By continuously maintaining a uniform temper-ature inside the furnace at a predefined level and applying different currents to the hot wire, the increase in temperature of the hot wire was measured three times at each current level. The measurement results for thelogtrelation were plotted, and the value of the thermal conductivity was calculated.
Table 1 Chemical composition of magnesia brick and insulating bricks (mass%).
MgO SiO2 TiO2 Al2O3 Fe2O3 CaO ZrO2
Magnesia brick 94.13 1.99 0.11 0.55 1.19 1.83 0.07
2.2.2 Stationary heat flow method
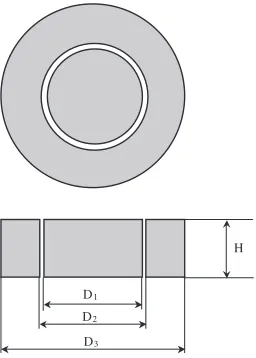
The dimensions and the shape of the samples used in the stationary heat flow method as provided in JIS R2616 are shown in Fig. 2 (D1¼50mm, D2¼54mm, D3¼90mm,
H¼20mm). Figure 3 shows a schematic outline of the structure of the test equipment for the stationary heat flow method. The heat source, which consists of Kanthal wires and platinum wires, was placed on the test piece. The test piece was placed on the heat receiving rod. It is most important to avoid side-flow of the heat and to correctly measure the heat
flux Q. In this stationary heat flow method, the guard ring,
which is made of the same brick as the test piece, is placed around the test piece. Therefore, the temperature gradient in the test piece becomes the same as in the guard ring when they are heated by the heat source, by which the side-flow of the heat from the test piece is avoided. After the heater produced by the heat source was inserted and the average temperature between the upper and the lower surface of the sample reached 350C, the current was in a steady-state. This
steady-state condition was achieved when the temperature of the upper and lower surfaces of the test piece had remained constant for 30 min or longer. The heat transmitted through the test piece was transferred through the heat receiving rod which was made of copper with its high thermal conductivity.
The temperature of the water cooling plate equaled to that of the heat receiving rod by controlling the amount of water flowing in the water cooling plate. The heat transferred to the heat receiving rod was absorbed by the flowing water used for measurements. Denoting the heat passing through the sample withQ, the following equation is derived for the stationary state:
Q¼ð12Þ
A
L ð1Þ
Here, is the thermal conductivity of the sample,A andL are the cross-section area and the length of the sample, 1
is the temperature at the upper surface of the sample, 2 is
the temperature at the lower surface of the sample, and the temperature used in the stationary heat flow method is ¼ ð1þ2Þ=2. Therefore, if the change in temperature for
the water between the upper and the lower surface of the sample is measured at the steady state, it is possible to calculate the thermal conductivity of the sample from the above equation. The difference in temperature between
H
D1
D2
D3
Fig. 2 Structure and dimensions of the specimen used in stationary heat flow method.
Heat source
Specimen Guard ring
Heat receiving rod
Microvolt meter
Differential thermocouple
Water Water
Water cooling plate
Compensating heater
Fig. 3 Structure of the experimental equipment in stationary heat flow method.
Power supply/Constant current type EX-375L2
Interface unit HWM-15
Digital multimeter
Agilent 34420A Personal computer PC
Specimen
Thermocouple
Hot wire Electric furnace
[image:3.595.134.462.75.233.2] [image:3.595.105.233.273.452.2] [image:3.595.312.537.273.501.2]the water inlet and the water outlet with a steady flow of water (100 mlmin1) is measured with a T type differential
thermocouple. This difference in the temperature was converted to the voltage by the microvoltmeter capable of detecting miniscule differences in voltage. To correctly measure the heat flux Q, Q is determined by proportional calculation with a water calorimeter incorporating a com-pensating heater made of nichrome wire. The relation between the temperature difference in water and heat Q is calibrated with a compensating heater:
Q¼W T1
T2T1
ð2Þ
T1: The difference in temperature between the water inlet
and the water outlet
T2: The difference in temperature between the water inlet
and the water outlet when a compensating heater adds the heat ofW.
As a result, the thermal conductivity of the sample was calculated from the following equation:
¼WL
A
T1
ðT2T1Þð12Þ
ð3Þ
3. Measurement Results and Discussion
3.1 Comparison of measurement results of
heat-insulat-ing bricks with hot wire and stationary heat flow methods
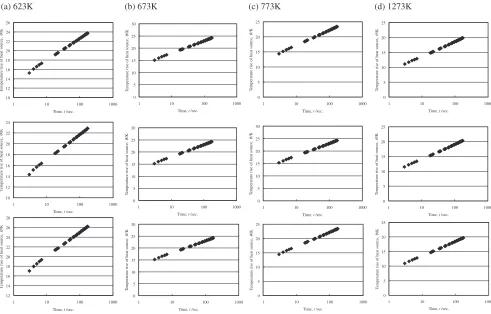
First, Fig. 4 shows the changes in the temperatureof the hot wire versus the logarithm of time logt as measured at
different temperatures with the hot wire method using the
insulating brick specimens. The relation between and
logt was linear at every measurement temperature without deviation from linearity, satisfying the following theoretical equation for the method:7,9,10,13)
¼0:183I2R
logT2
T1
21
ð4Þ
whereIis the current (A) through the hot wire,Rthe electric resistance (m1) of the hot wire at the measurement
temperature, is the increase in temperature (K) of the hot wire from between T1 and T2, and is the thermal
conductivity of the specimen brick (Wm1K1). The values of the thermal conductivity at different temperatures were calculated using this equation.
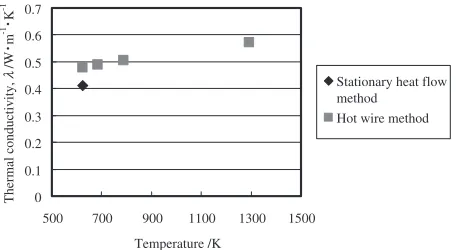
Next, the values of the thermal conductivity of the heat-insulating bricks at 350C (623 K) as obtained with the
two methods were compared. As seen in Fig. 5, the results obtained with the hot wire method in accordance with JIS R 2618 were higher by about 10% than those obtained with the stationary heat flow method in accordance with JIS R 2616. A number of researchers have reported that the thermal conductivity as measured with the hot wire method is often different from that measured with the stationary heat flow method.2,14)One of the reasons for this result is that the temperature measured with the former method does not correspond to that measured with the latter method in addition to that the thermal conductivity changes depending on the temperature. Whereas the temperature measured with the stationary heat flow method is the average of the values 10 12 14 16 18 20 22 24 26
1 10 100 1000
Time, t /sec.
T
emperature rise of heat source,
θ /K 10 12 14 16 18 20 22 24
1 10 100 1000
Time, t /sec.
T
emperature rise of heat source,
θ /K 12 14 16 18 20 22 24 26 28
1 10 100 1000
Time, t /sec.
T
emperature rise of heat source,
θ /K 0 5 10 15 20 25 30
1 10 100 1000
Time, t /sec.
T
emperature rise of heat source,
θ /K 0 5 10 15 20 25 30
1 10 100 1000
Time, t /sec.
T
emperature rise of heat source,
θ /K 0 5 10 15 20 25 30
1 10 100 1000
Time, t /sec.
T
emperature rise of heat source,
θ /K 0 5 10 15 20 25
1 10 100 1000
Time, t /sec.
T
emperature rise of heat source,
θ /K 0 5 10 15 20 25 30
1 10 100 1000
Time, t /sec.
T
emperature rise of heat source,
θ /K 0 5 10 15 20 25
1 10 100 1000
Time, t /sec.
T
emperature rise of heat source,
θ /K 0 5 10 15 20 25
1 10 100 1000
Time, t /sec.
T
emperature rise of heat source,
θ /K 0 5 10 15 20 25
1 10 100 1000
Time, t /sec.
T
emperature rise of heat source,
θ /K 0 5 10 15 20 25
1 10 100 1000
Time, t /sec.
T
emperature rise of heat source,
θ
/K
(a) 623K (b) 673K (c) 773K (d) 1273K
[image:4.595.52.543.72.386.2]for the upper and the lower surface of the specimen, in the former method it represents the temperature at a single point of the specimen. The thermal conductivity obtained by the stationary heat flow method will therefore correspond to that by the hot wire method if the relation between the tem-perature and the thermal conductivity follows the linear equation. However, it is difficult to decide this single point of the temperature in the hot wire method. In this study, the thermal conductivity of the insulating brick as obtained with the hot wire method shows a tendency to increase as the temperature increases. The relation between the temperature and the thermal conductivity does not follow the linear equation. The thermal conductivity as measured with the stationary heat flow method, in which the average of the temperature of the upper and the lower surface is 350C (623 K), is higher than that measured with the hot wire method at room temperature. This suggests that the results obtained with the two methods might be closer to each other depending on the temperature at the upper and the lower surface of the specimen in the measurement performed with the stationary heat flow method. Furthermore, if the temper-ature rise changing the condition of the hot wire method, reducing the amount of the temperature rise, it is possible to bring it close to the average temperature in the stationary heat flow method. In that case, the sensitivity decreases when the temperature rise is reduced, and there is a possibility that the accuracy of the thermal conductivity requested by the hot wire method lowers. As mentioned above, it follows that the absolute values of thermal conductivity and its dependence on temperature as obtained with the two methods might not be exactly the same even for specimens made of the same material.
Tsukino et al.15) compared the values of the thermal
conductivity of lightweight and dense castable refractories as obtained with the two methods, and reported that the value obtained with the hot wire method was higher by 5 to 25% than that obtained with the stationary heat flow method, regardless of its absolute value. In addition, based on the measurement results for heat-insulating bricks, Hayakawa et al.2) reported that the values obtained with the hot wire
method tended to be approximately 30% higher than those with the stationary heat flow method. Daviset al.16)measured the thermal conductivity of heat-insulating bricks with the two methods, compared the obtained results and explained that the value of the thermal conductivity as obtained with the hot wire method was the average of those in two directions,
as well as that the difference between the results of the two methods is attributable to the thermal anisotropy of the specimens. A conceivable reason for the difference between the results obtained with the two methods is the thermal anisotropy of the specimens due to factors such as uneven-ness of the brick material and the direction of compression during forming. While it is possible to clearly show the thermal anisotropy of a specimen with the stationary heat flow method, this is not possible in the case of the hot wire method since the stationary heat flow method assumes unidirectional heat flow, and the direction of measurement can be chosen beforehand at the time of cutting the specimens for measurement. In contrast, the hot wire method assumes two-directional heat flow, and the obtained result is the average of the thermal conductivity in the two directions.
Although it is difficult to perform estimation, in the present study, to determine the factor which exerts the strongest influence in causing the difference between the results of the two methods, the difference was maintained well within the range reported in past papers which compared the two methods. Therefore, the authors believe that the values of the thermal conductivity for heat-insulating bricks as obtained using the new measurement equipment for the hot wire method are reasonably reliable. However, to clarify the differences between the methods and to use the findings as feedback for improving the interpretation of the measure-ment results, it is necessary to accumulate more measuremeasure-ment results with the two methods for various materials with different thermal anisotropy and different characteristics of dependence of the thermal conductivity on the temperature.
3.2 Measurement of thermal conductivity of magnesia
bricks
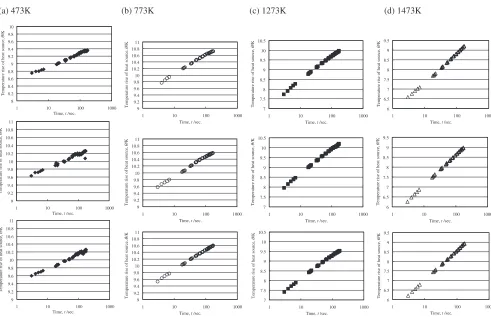
Figure 6 shows the change in temperatureof the hot wire versus the logarithm of time logt as measured at different temperatures with the hot wire method using magnesia brick specimens. In all graphs, the relation between and logt became linear after approximately 10 s of the measurement time. In the graphs for 473 and 773 K, the logt curves deviated from linearity at about 120 s and thereafter. Deviation from linearity was observed to a small extent at temperatures higher than 773 K. A number of past reports have discussed the reasons why thelogtcurves are not linear at the beginning of the measurement.5,17)Apart from the fact that thelogtrelationship forms a curve for small t, the hot wire has a certain mass, and part of the energy supplied to it is consumed for heating that mass. In addition, the difference in heat capacity between the hot wire and the brick specimens and the existence of layers of air between the wire and the bricks might influence thelogtrelationship. Considering the combined effects of these factors, it is not appropriate to use thevalues in this region of the present test for the calculation of the thermal conductivity.
The theoretical equation for the hot wire method (eq. (4)) mentioned in a number of studies is valid when thelogt relationship is linear. In the region where increases non-linearly, it appears that the heat flow from the hot wire reaches the surfaces of the specimen brick and subsequently dissipates into the surrounding atmosphere. After this, the temperature at the center of the specimen changes following 0
0.1 0.2 0.3 0.4 0.5 0.6 0.7
500 700 900 1100 1300 1500
Temperature /K
Thermal conductivity,
λ
/W
m
-1
K
-1
Stationary heat flow method
Hot wire method
[image:5.595.56.284.73.198.2]the changes in the temperature distribution inside the specimen. Therefore, it is not appropriate to use thevalues in this non-linear region for the calculation of the thermal conductivity. The usable values of are only those in the linear portion.
When the thermal conductivity of a specimen is high and its size is small, the heat flow from the hot wire reaches the surfaces quickly, and for this reason the heat either dissipates into the environment through the surfaces or accumulates near the surfaces, thus notably affecting the changes in temperature distribution with time inside the specimen. Since this also influences the rate of increase in temperature of the hot wire, the value of the thermal conductivity as calculated from the values obtained in this way will inevitably include an error. For this reason, the hot wire method is not suitable for determining the thermal conductivity of materials with high thermal conductivity where the heat can quickly reach the outer surfaces. In this regard, Hayashiet al.8)pointed out
that the most important factor for expanding the applicability of the hot wire method to such materials is the size of the specimens. In other words, the specimens should be as large as possible to increase the time necessary for the heat to flow from the hot wire to the outer surfaces of the specimens. Based on this, Hayashi et al. proposed suitable specimen sizes for different target materials which take into account the level of thermal conductivity. In addition, using specimens of various materials with different levels of thermal conduc-tivity, such as polyester resins, gypsum, graphite-clay and SiC-clay composites, heat-insulating and chamotte bricks, they examined the relationship between the point where the
curve deviated from linearity and the value of the thermal conductivity. As a result, they derived the following empirical equation governing the relation between the point Td(s) at whichbegins to deviate from the linear relation, the radiusr(cm) of the specimen and its thermal conductivity (calcm1s1C1):
Td¼ r
2
10: ð5Þ
In SI units, this equation is as follows:
Td¼4:18106 r
02
100; ð6Þ
wherer0is in units of m and0is in units of Wm1K1. In actual measurements with the hot wire method, the size of the sample is not infinite. In this regard, Horrockset al.18)
theoretically considered the effect of the diameter of the sample and reported that the error margin decreases ast=r2
decreases (radius r, thermal diffusivity ). The thermal conductivityis proportional to the thermal diffusivityif it is assumed that the changes in specific heat and density at high temperatures are not substantial since¼Cp, which
becomest¼Cr2= ift=r2¼Cis taken as an index (Cis a
constant). This relation between the radius rof the sample and the thermal conductivity at time t is similar to the empirical eq. (5). Hayashiet al.8)reported that a minimum radius obtained from the empirical eq. (5) corresponds to that from the findings obtained by Horrocks.
We applied the above eq. (5) to the three measurement results for magnesia bricks at different temperatures. Here, 8 8.2 8.4 8.6 8.8 9 9.2 9.4 9.6 9.8 10
1 10 100 1000
Time, t /sec.
Temperature rise of heat source,
θ /K 9 9.2 9.4 9.6 9.8 10 10.2 10.4 10.6 10.8 11
1 10 100 1000
Time, t /sec.
Temperature rise of heat source,
θ /K 9 9.2 9.4 9.6 9.8 10 10.2 10.4 10.6 10.8 11
1 10 100 1000
Time, t /sec.
Temperature rise of heat source,
θ /K 9 9.2 9.4 9.6 9.8 10 10.2 10.4 10.6 10.8 11
1 10 100 1000
Time, t /sec.
Temperature rise of heat source,
θ /K 9 9.2 9.4 9.6 9.8 10 10.2 10.4 10.6 10.8 11
1 10 100 1000
Time, t /sec.
Temperature rise of heat source,
θ /K 9 9.2 9.4 9.6 9.8 10 10.2 10.4 10.6 10.8 11
1 10 100 1000
Time, t /sec.
Temperature rise of heat source,
θ /K 7 7.5 8 8.5 9 9.5 10 10.5
1 10 100 1000
Time, t /sec.
Temperature rise of heat source,
θ /K 7 7.5 8 8.5 9 9.5 10 10.5
1 10 100 1000
Time, t /sec.
Temperature rise of heat source,
θ /K 7 7.5 8 8.5 9 9.5 10 10.5
1 10 100 1000
Time, t /sec.
Temperature rise of heat source,
θ /K 6 6.5 7 7.5 8 8.5 9 9.5
1 10 100 1000
Time, t /sec.
Temperature rise of heat source,
θ /K 6 6.5 7 7.5 8 8.5 9 9.5
1 10 100 1000
Time, t /sec.
Temperature rise of heat source,
θ /K 6 6.5 7 7.5 8 8.5 9 9.5
1 10 100 1000
Time, t /sec.
Temperature rise of heat source,
θ
/K
(a) 473K (b) 773K (c) 1273K (d) 1473K
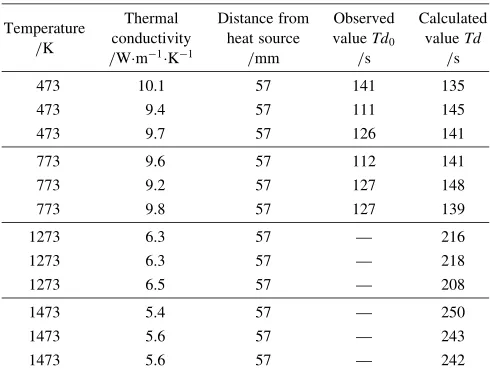
[image:6.595.52.543.68.385.2]the thermal conductivity was calculated based on the portion of the curves describing the increase in temperature between 18 and 90 s, where all of them were clearly linear at any of the measurement temperatures. The position of Td was calcu-lated by substitutingrwith the shortest distance from the heat source (hot wire) to the outer surface. Table 2 compares the calculated values of Td calculated with those of Td0 as
obtained from Fig. 6. All measurements at 473 K deviated from linearity at about 120 s, while the measurement results agreed well with the calculations performed in accordance with the empirical eq. (5). Furthermore, as seen in Fig. 6, regarding the conditions of the present study, the changes in did not deviate from linearity at 1273 and 1473 K. Some researchers have reported that the thermal conductivity of magnesia bricks fell drastically as the temperature increas-ed5,19) due to an increase in phonon scattering. As seen in
Fig. 7, the value of thermal conductivity for the magnesia bricks used in the present study tended to decrease from that at 473 K as the temperature increased. For this reason, the position of Td as calculated from the equation exceeded 180 s at 1273 and 1473 K. This indicates that the curves do not deviate from linearity, at least for the conditions of the present study, and thus the calculated result and the test result are in agreement. For reference purposes, we also measured and studied in the same manner the changes in temperature with time at different temperatures by using heat insulation
brick specimens with a thermal conductivity within the range specified in JIS R 2616. The result was that none of the logtcurves deviated from linearity in the test conditions for the present study. In fact, the heating curves of the hot wire obtained through actual measurements did not deviate from linearity, thus agreeing with the estimation based on eq. (5).
Next, we measured the thermal conductivity as obtained from analysis of the linear portions of the curves, as well as the dependence of the thermal conductivity on the temper-ature. The obtained values of the thermal conductivity were equal to or lower than 10 Wm1K1, which is within the
applicable range of the recently established JIS R 2251-1. The analysis is fundamentally the same as the determination of the thermal conductivity of heat-insulating bricks men-tioned in the previous subsection 3.1. Our aim was to compare the results of measuring the thermal conductivity of magnesia bricks with the hot wire method to the results obtained with the stationary heat flow method. However, it is not straightforward to obtain reliable values for the thermal conductivity of magnesia brick with the stationary heat flow method, especially in the temperature range of its use in converters, that is, between room temperature and 1273 K. In addition, there are different views regarding the interpreta-tion of the measurement results of the thermal conductivity of magnesia bricks obtained with the hot wire method, and as a result there are ambiguities in the results. For instance, Mittenbu¨hler20) found two linear portions with different slopes in alogtcurve for magnesia bricks. He attributed the existence of the region with the smaller slope in the first 4 min to the poor contact between the hot wire and the specimen bricks, and more specifically to the specimen configuration, whereby the hot wire is placed in a groove cut into the brick surface and the gap is filled with magnesia brick powder, which produces a difference in porosity between the bricks and the packed layer around the hot wire. Assuming, as above, that Mittenbu¨hler ignored the first linear portion of the curve and based his measurements on the later linear portion, he determined the value of the thermal conductivity to be 5.93 kcalm1h1C1. On the other
hand, Hayashi et al.8)questioned this interpretation, main-taining that it is unlikely for a small gap between the hot wire and the bricks to exert an effect on the measurement for a period of time as long as 4 min. In fact, the heating curves of hot wires which they obtained with other types of bricks in the same packing conditions began to behave linearly after about 12 s, which indicates that differences in packing condition do not affect the heating curve for as long as 4 min. Therefore, with respect to the interpretation provided by Mittenbu¨hler, Hayashiet al.considered that the point where the slope changes is the point of deviation from linearity Td, and therefore, based on the linear portion in the first 4 min, determined the thermal conductivity to be 13.5 kcalm1h1C1. In all curves at different
temper-atures obtained in the present study, we confirmed linear regions 18 s after the beginning of the measurement, which is considerably shorter than the 4 min that Mittenbu¨hler reported and closer to the value reported by Hayashi et al. Figure 7 presents a comparison between the thermal con-ductivity of magnesia bricks as calculated by the authors 0
2 4 6 8 10 12 14 16 18 20
0 200 400 600 800 1000 1200 1400 1600
Temperature, T/K
Thermal Conductivity,
λ
/W
m
-1
K
-1
Ref.(5) Ref.(19) Measured
[image:7.595.46.291.93.279.2]Fig. 7 Thermal conductivity of magnesia bricks.
Table 2 Deviation point Td0 as observed in Figs. 4 and 6, andTd as calculated from eq. (5).
Temperature /K
Thermal conductivity /Wm1K1
Distance from heat source
/mm
Observed valueTd0
/s
Calculated valueTd
/s
473 10.1 57 141 135
473 9.4 57 111 145
473 9.7 57 126 141
773 9.6 57 112 141
773 9.2 57 127 148
773 9.8 57 127 139
1273 6.3 57 — 216
1273 6.3 57 — 218
1273 6.5 57 — 208
1473 5.4 57 — 250
1473 5.6 57 — 243
1473 5.6 57 — 242
[image:7.595.55.285.319.434.2]from the linear portions and those obtained by Hayashi et al. with the hot wire method by using small specimens of cylindrical and other shapes. The results are close to each other in terms of absolute value and show a similar dependence on temperature, namely decrease at higher temperatures.
As stated above, the thermal conductivity of magnesia bricks tends to decrease as the temperature increases, and as a result the point of deviation from linearity Td shifts away from the zero point, thus making the linear portion longer and the hot wire method more suitable at higher temperatures. In industrial applications, magnesia bricks are used mainly as safety lining of converters, and since the brick temperature is lower during the initial stage of heating the converter and after tapping than during the stage of oxygen blowing, the most important property of magnesia bricks in actual use is their thermal conductivity over a wide temperature range. However, the thermal conductivity of magnesia bricks might fluctuate depending on the type and the distribution of impurities, the difference in porosity, the existence of glassy phases, and so on, even when the purity of its constituent MgO is essentially the same. For this reason, to measure the thermal conductivity of magnesia bricks accurately in the temperature range of their industrial use with the hot wire method, it is important to be able to predict and examine the point where thelogtcurve deviates from linearity, and it is necessary to closely examine the measurement readings in order to identify the point of deviation correctly and avoid erroneous final results.
4. Conclusion
In view of the revision of the JIS system regarding the thermal conductivity of refractory materials and its incorpo-ration into the ISO system, the application of the hot wire method in the measurement of the thermal conductivity of a wide variety of materials is under evaluation. In this regard, the authors have studied the conditions for measurement of the thermal conductivity by focusing on bricks made of magnesia, which is a commonly used material with high thermal conductivity among non-carbon materials.
To measure the thermal conductivity of refractory bricks at high temperatures, the authors constructed a high-capacity electric furnace capable of accommodating a specimen set composed of straight bricks without preprocessing. Subse-quently, the increase in temperature of the hot wire was measured and the linear relationship between the increase in temperatureand the logarithm of timelogtwas investigated together with the relationship between the timeTdat which thelogtcurve ceases to behave linearly and the shortest distance between the hot wire and the outer surface of the specimen. Consequently, as reported previously, Td was found to be proportional to the square of the shortest distance.
In actual measurements of the thermal conductivity of the refractory material, if its approximate value is known, these relationships provide guidelines for the time range on which the analysis should focus and a criterion for estimating the adequacy of the measurement results. The present study indicates that the thermal conductivity of bricks with high heat conductivity, such as magnesia bricks, can be deter-mined accurately even when using straight brick specimens
if the point where the logt curve ceases to behave
linearly is identified and the value of the thermal conductivity is calculated only on the basis of the linear relationship.
Acknowledgement
The authors would like to express their gratitude to Dr. Kunio Hayashi, former professor at Kyoto Institute of Technology, and Mr. Naoki Inamoto, Director of Spectra Inspection Laboratory Co., Ltd., for their guidance and assistance in the construction and automation design of the equipment for measuring the thermal conductivity with the hot wire method. The authors would also like to thank Kurosaki Harima Corporation for supplying brick specimens for the present study.
REFERENCES
1) A. Maezono: Ceramics29(1994) 421–430.
2) Y. Hayakawa and Y. Saito: J. Tech. Assoc. Refract. Japan25(2005) 139–142.
3) Y. Saito: J. Tech. Assoc. Refract. Japan25(2005) 143–150. 4) Y. Saito, K. Kono and T. Kayama: J. Tech. Assoc. Refract. Japan21
(2001) 131–140.
5) K. Hayashi, M. Fukui and I. Uei: J. Ceramic Assoc. Japan83(1975) 18–22.
6) K. Hayashi, M. Fukui and I. Uei: J. Ceramic Assoc. Japan82(1974) 202–208.
7) K. Hayashi, M. Fukui and I. Uei: J. Ceramic Assoc. Japan81(1973) 534–542.
8) Saishin Netsusokutei: ed. by Ulvac Riko Inc. under Ichiro Hatta as supervising editor, (Agne Gijutsu Center, 2003) pp. 211–222. 9) W. E. Haupin: J. Am. Ceram. Soc.39(1960) 139–141.
10) E. F. M. Van der Held and F. G. Van Drunen: Phys.XV(1949) 865– 881.
11) K. Hayashi and M. Fukui: J. Ceramic Assoc. Japan85(1977) 605–607. 12) K. Hayashi and I. Uei: J. Tech. Assoc. Refract. Japan22(1970) 496–
501.
13) J. H. Blackwell: J. Appl. Phys.25(1954) 137–144.
14) E. Takekoshi, S. Imura, Y. Hirasawa and T. Takenaka: Trans. Japan Soc. Mech. Eng. B47(1981) 1307–1316.
15) M. Tsukino, E. Motoki and H. Yamamoto: J. Tech. Assoc. Refract. Japan33(1981) 391–393.
16) W. R. Davis and A. Downs: Trans. J. Br. Ceram. Soc.79(1980) 44–52. 17) I. Uei, M. Fukui and K. Hayashi: Reports of the Asahi Glass
Foundation for Industrial Technology13(1967) pp. 363–375. 18) H. K. Horrocks and E. McLaughlin: Proc. Roy. Soc. Ser. AD393
(1963) 259–274.
19) K. Matsushita: Taikabutsu54(2002) 634–641.