Mechanical Properties of Ti–50(Pt,Ir) High-Temperature Shape Memory Alloys
Yoko Yamabe-Mitarai
1, Toru Hara
1, Seiji Miura
2and Hideki Hosoda
3 1National Institute for Material Science, Tsukuba 305-0047, Japan2Materials and Process Design Division of Materials Science and Engineering, Hokkaido University,
Sapporo 060-0813, Japan
3Precision & Intelligence Laboratory (P&I Lab.), Tokyo Institute of Technology, Yokohama 226-8503, Japan
To develop high-temperature shape memory alloys, Ti–50(Pt,Ir)mol% compounds are noted because of their martensitic transformation from B2 to B19(2H) or 4H(4O) structures above 1273 K. A thermal expansion measurement and loading-unloading compression test were performed for Ti–50(Pt,Ir) to determine if the shape memory effect or superelasticity was shown. The thermal expansion measurement indicated the shape recovery in some of the compounds. The maximum shape recovery was about 4% by reheating at the above martensite transformation temperature after a loading-unloading compression test. Superelasticity was also observed in ternary compounds. The potential of Ti–50(Pt,Ir) as a high-temperature shape memory alloy is discussed.
(Received August 22, 2005; Accepted November 7, 2005; Published March 15, 2006)
Keywords: high-temperature shape memory alloys, TiPt, TiIr, B2, B19, martensitic transformation
1. Introduction
Applications of high-temperature shape memory alloys for gas turbines, rocket engines, automotive engines, and nuclear reactor environments can be envisioned. However, only a limited number of alloys have potential as high-temperature shape memory alloys. Some of those are NiAl [for example Ref. 1)], Ti(Ni,Pt),2–4) Ti(Ni,Pd),5–10) and RuX (X¼Ta, Nb).11,12)Among them, the martensitic temperature related to the shape memory effect exceeds 1273 K in only TiPt and RuX (X¼Ta, Nb). Intermetallics, including platinum group metals (PGMs), have been noted as high-temperature shape memory alloys that can work above 1273 K. The high-temperaturephase with an ordered B2 structure transforms to the distorted tetragonal phase, the0phase, in RuTa and
RuNb.13,14)Upon further cooling, an additional
transforma-tion to the monoclinic 00 phase occurs.15) The equiatomic
compositions of RuTa and RuNb indicated a highly twinned microstructure, and the bended samples showed 5 or 4% shape recoveries at the tensile surface.11) The
high-temper-ature-ordered cuboidal B2 phase has been reported to transform to the orthrombic B19 phase in TiPt.16,17) The investigation of the phase transformation in TiPt suggested a martensitic transformation and its high potential as a high-temperature shape memory alloy.18,19)
As shown above, some intermetallics, including PGMs, show a high martensitic transformation temperature. How-ever, there is very limited research on these intermetallics. In a previous study, we investigated the phase transformation of Ir-added TiPt.20) The addition of Ir to TiPt is expected to
increase the martensitic transformation temperature of TiPt because, as has been reported, Ir-rich TiIr also transforms from the B2 phase to the low-temperature phase above 1873 K, although the phase structure at low temperature is still under debate.16,17)Ternary Ti–50(Pt,Ir) compounds also have a phase transformation from the high-temperature phase to the low-temperature phase. The low-temperature phase of Ti–12.5Pt–37.5Ir alloy was investigated and revealed that the low temperature phase is composed of the mixture of B19(2H) and 4H structures.21)It has the possibility that the
ternary systems of other compositions are not simple B19(2H) structure. By the addition of Ir, the phase trans-formation temperature increased from 1323 to 1423 K, as expected.20)The surface relief of Ti–50(Pt,Ir) observed using
a confocal scanning laser microscope suggested that this phase transformation is also a martensitic transformation.22) In this study, the mechanical properties of TiPt and Ti– 50(Pt,Ir), such as the shape memory effect or superelasticity, were investigated using a high-temperature loading-unload-ing compression test and a thermal expansion measurement. The potential of these compounds as high-temperature shape memory alloys is discussed.
2. Experimental Procedure
Fifteen-gram alloy ingots with a nominal composition of Ti–50Pt, Ti–37.5Pt–12.5Ir, Ti–25Pt–25Ir, and Ti–12.5Pt– 37.5Ir (mol%) were prepared by the arc melting method. Samples with sizes of338and336mm were cut from the alloy ingots for the thermal expansion measurement and the compression test, respectively. Cylindrical samples with a diameter of 3 mm and a length of 4 mm were also cut for the microstructure observation under transmission elec-tron microscopy. These samples were sealed together in a vacuum with a small amount of Ar gas in a silica tube and heat-treated at 1523 K, a higher temperature than the trans-formation temperature of all tested alloys for 24 h in the furnace; this was followed by ice water quenching.
The thermal expansion measurement was performed for non-deformed and deformed samples using a dilatometer (Rigaku dilatometer TMA8140C). Deformation was con-ducted until the reorientation of martensite variants occurred. The temperature was measured and controlled by a Pt/Pt– 13 at% Rh thermocouple inserted in a blind hole in a reference alumina sample. Thermal expansion tests were conducted over the temperature range from 300 up to 1600 K at a heating rate of 0.167 K/s in an Ar atmosphere.
The loading-unloading compression test was carried out at temperatures below the Martensitic transformation start temperature (Ms), between the Austenite transformation start
Special Issue on Shape Memory Alloys and Their Applications
temperature (As) and the Austenite transformation finish
temperature (Af), and aboveAf with an initial strain rate of 3104/s in Shimadzu AG-I. To investigate the shape
memory effect, the sample was cooled down to room temperature from the testing temperature after the compres-sion test was performed, and the sample length was measured. Then, the sample was again heated above the phase transformation temperature in the high-temperature furnace. The final sample length was measured after quenching.
Sliced samples with a thickness of 0.2 mm were cut from heat-treated cylindrical samples with a diameter of 3 mm. The sliced samples were polished mechanically with SiC paper, dimpled, and then ion-milled. The microstructures of
these heat-treated samples were observed using Philips CM200 transmission electron microscopy (TEM).
3. Results
The typical microstructures of Ti–50(Pt,Ir) are shown in Fig. 1 Typical microstructure of (a) Ti–50Pt, (b) Ti–37.5Pt–12.5Ir, (c) Ti–25Pt–25Ir, and (d) Ti–12.5Pt–37.5Ir heat-treated at 1523 K for
[image:2.595.97.499.71.459.2]24 h followed by ice water quenching.
Table 1 Phase transformation temperature of Ti–50Pt and Ti–50(Pt,Ir) determined by the DTA (K).
As Af Ms Mf
Ti–50Pt 1273 1330 1262 1236
Ti–37.5Pt–12.5Ir 1309 1376 1273 1251 Ti–25Pt–25Ir 1394 1463 1383 1341 Ti–12.5Pt–37.5Ir 1448 1491 1457 1442
Fig. 2 Phase transformation temperature as a function of the Ir concen-tration.
[image:2.595.324.527.507.663.2] [image:2.595.46.291.533.599.2]Fig. 1. All compounds exhibited a highly twinned micro-structure. This twined microstructure consists of coarse twins with various widths depending on the alloy composition and the observed area. Each coarse twin has a finely twinned internal structure. In the compounds with high Ir contents, twins intersected in two directions, and then different types of
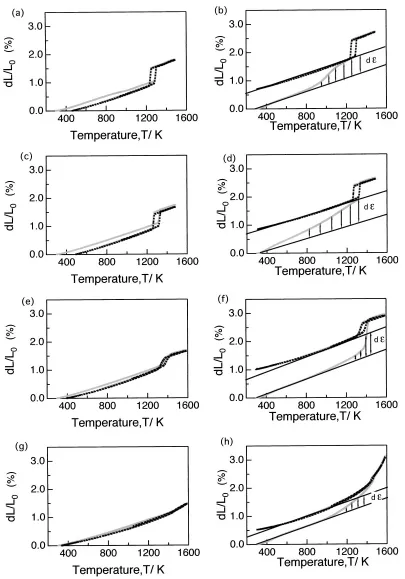
twin interfaces appeared [Figs. 1(c) and (d)]. For example, areas A and B, B and C, C and D, and D and A have a twin relationship in Ti–12.5Pt–37.5Ir [Fig. 1(d)].21)Judging from diffraction patterns, most of finely induced twin is Type I twin which is mirror-related to each side of crystals. Coarsely induced compound twin is also found, for example, shown in Fig. 3 Thermal expansion behavior of (a, b) Ti–50Pt, (c, d) Ti–37.5Pt–12.5Ir, (e, f) Ti–25Pt–25Ir, and (g, h) Ti–12.5Pt–37.5Ir. The
[image:3.595.97.502.67.646.2]Fig. 1(b). Twinning morphology in these alloys is typical one that was often observed in thermoelastically transformed martensite.
Before the mechanical properties are shown, details of the martensitic transformation temperature investigated using differential thermal analysis are presented in Table 1 and Fig. 2 because only the average transformation temperatures, AandM, were shown in our previous paper;20)taking those
parameters into account, the testing condition was decided. As,Af,Ms, and the Martensitic transformation finish
temper-ature (Mf) are plotted as a function of the concentration of Ir
in Fig. 2. All transformation temperatures increased with increasing Ir contents, while the temperature difference betweenMs andAsdecreased with increasing Ir contents.
The thermal expansion behaviors of Ti–50(Pt,Ir) are shown in Fig. 3. The left-hand-side diagrams, Figs. 3(a), (c), (e), and (g), indicate the thermal expansion behavior of non-deformed samples. The non-deformed samples gradually expanded with increasing temperature and shrank with decreasing temperature, expect for the one discontinuous length change. The expansion and shrinkage behavior were almost the same in the first and second cycles. The discontinuous length change was accompanied with the phase transformation because the transformation temperature
observed in the thermal expansion measurement was almost consistent with the phase transformation determined by the DTA. This change was very clear in TiPt and Ti–37.5Pt– 12.5Ir (Figs. 3(a) and (c), respectively) but became small and was not clear in Ti–25Pt–25Ir and Ti–12.5Pt–37.5Ir [Figs. 3(e) and (g), respectively]. This behavior is consistent with the DTA curves in our previous study.20) The peaks
[image:4.595.326.528.297.436.2]corresponding to the phase transformation in the DTA curves were very strong and sharp in TiPt and Ti–37.5Pt–12.5Ir, but those in Ti–25Pt–25Ir and Ti–12.5Pt–37.5Ir were very weak and broad in the DTA curves. The right-hand-side diagrams, Figs. 3(b), (d), (f), and (h), show the thermal expansion behavior of the compressively deformed samples. Larger expansion than that in non-deformed samples was observed in all compounds. On the other hand, the shrinkage of compounds was smaller than the expansion. Furthermore, the expansion behavior in the second cycle was smaller than that
Table 2 Shape recovery of Ti–50Pt and Ti–50(Pt,Ir) investigated using the thermal expansion test.
Shape recovery (%)
Ti–50Pt 0.6
Ti–37.5Pt–12.5Ir 0.9
Ti–25Pt–25Ir 0.9
Ti–12.5Pt–37.5Ir 0.4 Fig. 4 Shape recovery of Ti–50Pt and Ti–50(Pt,Ir) measured by the thermal expansion test.
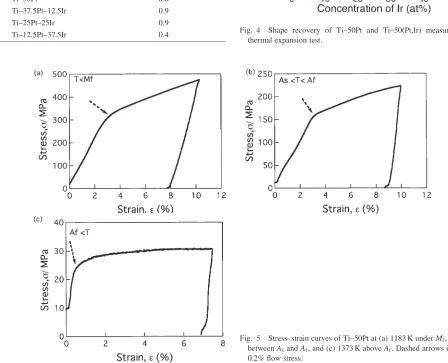
Fig. 5 Stress–strain curves of Ti–50Pt at (a) 1183 K underMf, (b) 1293 K
betweenAsandAf, and (c) 1373 K aboveAf. Dashed arrows indicate the
0.2% flow stress.
[image:4.595.65.513.422.785.2] [image:4.595.310.498.491.633.2]in the first cycle and almost the same as the shrinkage behavior in the first cycle. This indicates that the initial expansion in the first cycle corresponds to the shape recovery. In detail, the expansion behavior in the first cycle was different in each compound. For example, deformed TiPt started to show extra expansion, which was larger than non-deformed samples, i.e., around 800 K below the phase
transformation temperature. Ti–37.5Pt–12.5Ir and Ti– 12.5Pt–37.5Ir gradually showed extra expansion as well, which started from a lower temperature, around 400 K, than that in TiPt. The reason for the gradual recovery below the phase transformation temperature is not clear. In Ti–25Pt– 25Ir, a large discontinuous expansion near the phase trans-formation was also observed.
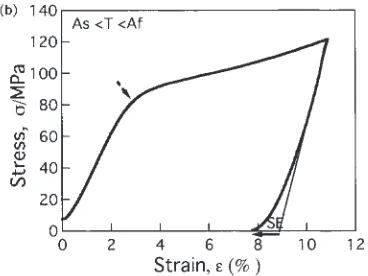
Fig. 6 Stress–strain curves of Ti–37.5Pt–12.5Ir at (a) 1201 K underMf,
(b) 1342 K between As and Af, and (c) 1383 K aboveAf. The shape
recovery by reheating above the phase transformation temperature and the superelasticity are represented by SM and SE, respectively. Dashed arrows indicate the 0.2% flow stress. An arrow in (a) indicates the stress of reorientation of the martensite variants.
Fig. 7 Stress–strain curves of Ti–25Pt–25Ir at (a) 1291 K under Mf,
(b) 1428 K between As and Af, and (c) 1483 K aboveAf. The shape
[image:5.595.314.498.71.209.2] [image:5.595.309.497.379.521.2]The shape recovery was estimated from the thermal expansion curves in Fig. 3. The estimated shape recovery is summarized in Table 2 and plotted in Fig. 4. The highest shape recovery, 0.85%, was found in Ti–37.5Pt–12.5Ir and
Ti–25Pt–25Ir.
The stress–strain curves of the loading-unloading com-pression test are shown from Figs. 5 to 8. In Ti–50Pt, the reorientation of the martensite variants during elastic deformation, shape recovery by heat treatment above Af
after deformation, or superelasticity during unloading, these phenomena which are often observed in various shape memory alloys, was not clearly observed for the samples tested at various temperatures (Fig. 5). For Ti–37.5Pt–12.5Ir, the curvature change that corresponds to the reorientation of the martensite variants clearly appeared, as shown by an arrow under Mf [Fig. 6(a)]. Then, the stress shown by a
dashed arrow is considered to be the critical stress of plastic deformation of the martensite phase. The shape recovery of 2% was found by heat treatment aboveAf after deformation.
At a temperature aboveAs, a small shape recovery was found
Fig. 8 Stress–strain curves of Ti–12.5Pt–37.5Ir at (a) 1392 K underMf, (b)
1469 K betweenAsandAf, and (c) 1503 K aboveAf. The shape recovery
[image:6.595.100.288.70.366.2]by reheating above the phase transformation temperature and the superelasticity are represented by SM and SE, respectively. Dashed arrows indicate the 0.2% flow stress. An arrow in (a) indicates the stress of reorientation of the martensite variants.
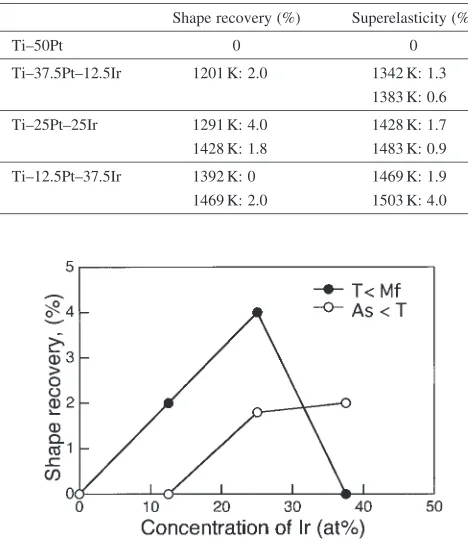
Table 3 Shape recovery by reheating after the loading-unloading com-pression test and superelasticity observed using the comcom-pression test during unloading aboveAsin Ti–50Pt and Ti–50(Pt,Ir).
Shape recovery (%) Superelasticity (%)
Ti–50Pt 0 0
Ti–37.5Pt–12.5Ir 1201 K: 2.0 1342 K: 1.3 1383 K: 0.6
Ti–25Pt–25Ir 1291 K: 4.0 1428 K: 1.7 1428 K: 1.8 1483 K: 0.9
Ti–12.5Pt–37.5Ir 1392 K: 0 1469 K: 1.9 1469 K: 2.0 1503 K: 4.0
Fig. 9 Shape recovery of Ti–50Pt and Ti–50(Pt,Ir) measured by reheating aboveAfafter the loading-unloading compression test.
Fig. 10 Superelasticity of Ti–50Pt and Ti–50(Pt,Ir) measured by the loading-unloading compression test. The closed and open symbols represent the results at temperatures between As andAf and aboveAf,
respectively.
[image:6.595.306.497.73.214.2] [image:6.595.324.528.381.526.2] [image:6.595.47.281.414.686.2]during unloading [Figs. 6(b) and (c)]. This shape recovery is considered to be superelasticity by reverse transformation from martensite to parent phases. However, the incomplete superelastic strain indicates that plastic deformation also occurred during the test at temperatures aboveAs. The stress–
strain curves of Ti–25Pt–25Ir are similar to those of Ti– 37.5Pt–12.5Ir (Fig. 7). Under Mf, the reorientation of the
martensite variants as shown by an arrow was clearly observed. Although plastic deformation occurred as shown by a dashed arrow, strain of 4%, which is larger than that in Ti–37.5Pt–12.5Ir, was recovered [Fig. 7(a)]. One different result is that the shape recovery of 1.8% was clearly found by reheatingAfafter the loading-unloading test at a temperature
between As and Af [Fig. 7(b)]. Superelasticity was also
clearly found above As [Figs. 7(b) and (c)]. In Ti–12.5Pt–
37.5Ir, although the reorientation of the martensite variants was observed, shape recovery was not observed in the sample tested underMf [Fig. 8(a)]. Shape recovery was identified in
the sample tested between As and Af [Figs. 8(a) and (b)].
Superelasticity clearly appeared aboveAsin this compound
[Figs. 8(b) and (c)]. No shape recovery under Mf and
incomplete superelasticity indicates that plastic deformation occurred during the test. The shape recovery and super-elasticity obtained with the loading-unloading compression test are summarized in Table 3 and plotted in Figs. 9 and 10, respectively. The highest shape recovery was obtained in Ti– 25Pt–25Ir tested below Ms. On the other hand, among the
samples tested aboveAs, the ternary compounds with Ir over
25 mol% indicated a high shape recovery. The superelasticity increased with increasing Ir contents under both conditions, betweenAsandAf and aboveAf.
4. Discussion
The martensitic transformation from the B2 to B19 phases in TiPt is the same type as that in TiPd, whoseMsis at 823,
500 K lower than that in TiPt. Good shape memory strain has been reported in Ti–50Pd at room temperature, but the recovery of strain decreased with increasing testing temper-ature and was finally lost.5) It is considered that the poor
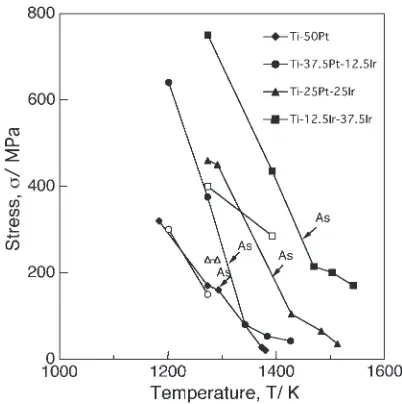
shape memory characteristics at high temperature were due to the rapid decrease of the critical stress for slip at high temperature. In the case of TiPt, no shape recovery was found at 1183 K by the loading–unloading compression test. Although the shape recovery after deformation at room temperature has not been investigated in TiPt yet, the thermal expansion measurement indicated a small shape recovery in TiPt. It is considered that the shape recovery of TiPt also shows temperature dependence. The 0.2% flow stress caused by plastic deformation and the stress of reorientation of martensite variants were estimated from the compressive stress–strain curves and are plotted in Fig. 11. As indicated in results, the critical stresses represented by a dashed arrow in Figs. 5–8 are caused by plastic deformation. This 0.2% flow stress are plotted by solid symbols in Fig. 11. In the some of the test conditions, the stress of reorientation of martensite variants shown by an arrow is clearly observed. The stress of reorientation of martensite variants is plotted by open symbols. The 0.2% flow stress of TiPt was the lowest among the tested compounds, and the 0.2% flow stress increased
with increasing Ir contents. This suggests that the rapid decrease of the critical stress for slip caused the loss of the shape memory effect in TiPt at high temperature, as it happens in TiPd.
The poor shape recovery effect of TiPd was improved by expansion to the ternary Ti–Pd–Ni system as well as by attempting thermomechanical treatment or precipitation hardening by TiB2 for the ternary Ti–Pd–Ni. In the case of
TiPt, the ternary system by addition of Ir was investigated. Despite the lack of thermomechanical treatment or precip-itation hardening, shape recovery and superelasticity were clearly observed in the ternary Ti–Pt–Ir. This indicates that the addition of Ir is effective to improve the shape memory effect and superelasticity of TiPt. Since there seemed to be no large difference in microstructure between TiPt and Ti– (Pt,Ir), as shown in Fig. 1, it is not clear if the microstructure change by Ir addition improved the shape memory effect. Further investigation is necessary to understand the Ir effect on the microstructure. Another advantage of the Ir addition is that it increases both the stress for reorientation of martensite variants and the 0.2% flow stress at high temperature, as shown in Fig. 11. This suggests that the critical stress due to the slip of dislocation increases by the addition of Ir at high temperature. This is because Ir is an element with a high melting temperature of about 2720 K that forms the B2 type structure with Ti at high temperature. Attempting on thermomechanical treatment and/or precipitation hardening is also effective for further improvement of the shape memory effect of Ti–Pt–Ir.
In ternary Ti–Pt–Ir compounds, although the 0.2% flow stress decreases with increasing temperature, the slope of the temperature–stress curve changed above Asin Fig. 11. At a
temperature above As, both martensite and parent phases
[image:7.595.325.526.70.272.2]coexist since the martensite phase started to transform into the parent phase by the reverse martensitic transformation. However, stress-induced martensite is also formed during loading at this temperature. The flow stress was changed due to the coexistence of the two phases.
As high-temperature shape memory alloys, RuTa or RuNb are very promising materials because of their high marten-sitic transformation temperature. In detail, both RuTa and RuNb have a B2 structure at high temperature and transform to a slightly distorted tetragonal structure. The tetragonal structure again tranformed into a monoclinic structure depending on the alloy composition. The transformation temperature depended on the Ta or Nb concentration.16,17)
The highest transformation occurred at 44 at% Ta at around 1627 K in RuTa and decreased to room temperature with increasing Ta concentration (up to 63). In the case of RuNb, the highest transformation temperature appeared at 45 at% Nb at about 1373 K and decreased to room temperature with increasing Nb concentration (up to 58). This drastic change in the transformation temperature was also found in TiIr.16,17)It is interesting to compare these Ru-based intermetallics and Ti–(Pt,Ir) because the phase transformation temperatures of Ru–50Ta and Ru–50Nb are about 1473 and 1223 K, respectively, and are almost the same as those of Ti–50Pt and Ti–50(Pt,Ir). The shape recovery of Ru–50Ta and Ru– 50Ta by the three-point bending test at 1073 and 1173 K following reheating at the above transformation temperature was 5 and 4% of the strain on the tension surface, res-pectively.11) In the case of the Ti–Pt system, although no
shape recovery was found in binary Ti–50Pt by reheating after the loading-unloading compression test, the shape recovery in Ti–25Pt–25Ir was almost the same as those of Ru-based intermetalllics. On the other hand, the shape recovery of Ru–50Ta by deformation dilatometry was 2% after the sample was compressed to about 4% strain at 1173 K and reheated to 1523 K in the machine. In the case of Ti–50Pt and Ti–50(Pt,Ir), the highest shape recovery obtained using dilatometry was 0.85% in the ternary Ti–50(Pt,Ir), smaller than that in binary Ru–50Ta. These results indicate that Ru-based intermetallics have a better shape memory effect than Ti–(Pt,Ir). However, one disadvantage of Ru-based interme-tallics is their brittleness. On the other hand, good ductility is expected in Ti–(Pt,Ir) because Pt is a very ductile material.
5. Conclusions
Shape recovery and superelasticity are first demonstrated by thermal expansion measurement and loading-unloading compression tests in Ti–50Pt and Ti–(50x)Pt–xIr (X¼
12:5, 25, and 37.5). The shape recovery is due to the high-temperature martensitic transformation, which occurs at tem-peratures from 1273 in Ti–50Pt to 1448 K in Ti–12.5Pt– 37.5Ir. The highest shape recovery, about 4% was found in Ti–25Pt–25Ir using loading-unloading compression test. Better superelasticity was obtained in the compounds with
higher Ir contents. These results suggest that TiPt and Ti– 50(Pt,Ir) have a high potential to be high-temperature shape memory alloys.
Acknowledgement
This work was partially supported by Grants-in-Aid for Fundamental Science Research, (Kiban C: No. 16560620 and Priority Areas 438, No. 17040014) from the Ministry of Education, Culture, Sports, Science and Technology, Japan.
REFERENCES
1) K. Enami and S. Nenno: Metall. Trans.2(1971) 1487–1490. 2) H. Hosoda, M. Tsuji, M. Mimura, Y. Takahashi, K. Wakashima and
Y. Yamabe-Mitarai: MRS753(2003) BB5-51-1–BB5-51-6. 3) Y. Takahashi, T. Inamura, J. Sakurai, H. Hosoda, K. Wakashima and
S. Miyazaki: Trans. MRS-J.29(2004) 3005–3008.
4) T. Inamura, Y. Takahashi, H. Hosoda, K. Wakashima, T. Nagase, T. Nakano, Y. Umakoshi and S. Miyazaki: MRS842(2004) 347–352. 5) K. Otsuka, K. Oda, Y. Ueno, M. Piao, T. Ueki and H. Horikawa: Scr.
Metal.29(1993) 1355–1359.
6) D. Golberg, Y. Xu, Y. Murakami, S. Morito, K. Otsuka, T. Ueki and H. Horikawa: Scr. Metal.30(1994) 1349–1354.
7) Y. Xu, K. Otsuka, E. Furubayashi, T. Ueki and K. Mitose: Mater. Lett.
30(1997) 189–197.
8) Y. Xu, S. Shimizu, Y. Suzuki, K. Otsuka, T. Ueki and K. Mitose: Acta Mater.45(1997) 1503–1511.
9) Y. Suzuki, Y. Xu, S. Morito, K. Otsuka and K. Mitose: Mater. Lett.36
(1998) 85–94.
10) S. Shimizu, Y. Xu, E. Okunishi, S. Tanaka, K. Otsuka and K. Mitose: Mater. Lett.34(1998) 23–29.
11) R. W. Fonda, H. N. Jones and R. A. Vandermeer: Scr. Mater.39(1998) 1031–1037.
12) R. W. Fonda, H. N. Jones and R. A. Vandermeer: Advances in Twinning, Ed. by S. Ankem and C. S. Pande, (TMS, 1999) pp. 279–285. 13) B. H. Chen and H. F. Franzen: J. Less-Common Met.153(1989) L13–
L19.
14) B. H. Chen and H. F. Franzen: J. Less-Common Met.157(1990) 37– 45.
15) R. W. Fonda and R. A. Vandermeer: Philos. Mag A76(1997) 119–133. 16) T. B. Massalski:Binary Phase Diagrams, (ASM, Ohio, USA, 1987)
p. 2361.
17) T. B. Massalski:Binary Phase Diagrams, (ASM, Ohio, USA, 1987) p. 3142.
18) T. Biggs, M. J. Witcomb and L. A. Cornish: Mater. Sci. Eng. A273– 275(1999) 204–207.
19) T. Biggs, M. B. Cortie, M. J. Witcomb and L. A. Cornish: Mater. Trans. A32A(2001) 1881–1886.
20) Y. Yamabe-Mitarai, T. Hara and H. Hosoda: Mater. Sci. Forum426– 432(2003) 2267–2272.
21) T. Hara and Y. Yamabe-Mitarai: Collected Abstracts of the 2003 Autumn Meeting of the Japan Inst. Metals (2003) 87.
22) Y. Yamabe-Mitarai, T. Hara, S. Miura and H. Hosoda: J. Jpn. Inst. Met.
69(2005) 634–642.