Solubility and Activity of Oxygen in Pb–Bi Melts
A. Kishimoto
1;*1, A. Wada
1;*2, T. Michimoto
1;*3, T. Furukawa
2, K. Aoto
2and T. Oishi
1 1Faculty of Engineering, Kansai University, Suita 564-8680, Japan2Advanced Material Technology Group, Japan Atomic Energy Agency, O-arai 311-1393, Japan
In order to obtain the solubility and activity of oxygen in Pb–Bi melts, the research for oxygen analysis and oxygen partial pressure measurement in a lead–bismuth eutectic alloy (LBE) was performed. The analytical condition of oxygen in low melting metals by an inert gas fusion-infrared absorption method was established using Pb or Bi equilibrated with its corresponding oxide at 973 K as a standard sample for the oxygen analysis. After establishing the analytical condition, oxygen analysis in liquid LBE in equilibrium with solid PbO at various temperatures was done. The temperature dependence of oxygen solubility in liquid LBE was expressed by the following equation,
logðCO=mass ppmÞ ¼ 4:74103=Tþ7:06ð0:03Þ ð8785T=K51073Þ
Oxygen partial pressure in LBE–(PbO and/or PbOþBi2O3) equilibrium was measured using an oxygen sensor of a zirconia solid electrolyte (ZrO2Y2O3), and obtained as a function of temperature as
logðpO2=PÞ ¼10:962:259104=T ð7205T=K51098Þ
logðpO2=PÞ ¼2:491:330104=T ð10985T=K51252Þ From the results, the oxygen potential in LBE at the oxygen unsaturated region was estimated as,
RTlnðpO2=PÞ=(J/mol)¼ 58:59T2:510105þ38:29T logðCO=mass ppmÞ
The activity coefficient of oxygen in liquid LBE obtained using Blander’s oxygen dissolution model was compared with these experimental data and those of other investigators.
(Received June 22, 2005; Accepted October 23, 2005; Published January 15, 2006)
Keywords: solubility of oxygen, lead–bismuth, nuclear coolant, oxygen analysis, oxygen partial pressure, activity coefficient, solution model
1. Introduction
In recent years, the development of a candidate coolant to take the place of sodium has been focused on in order to improve the safety of nuclear reactors.
The boiling point of LBE is higher and its reactivity with water and air is lower than those of sodium. However, if LBE is used as a coolant, the problem of the pipe corrosion, which originates in the dissolution of the metal into LBE, occurs. According to the IPPE report,1)it may be possible to prevent
this corrosion by controlling the oxygen concentration in LBE and forming an oxide protection film on the inner wall of the cooling pipe. To do this, it is necessary to construct a potential diagram of the LBE–oxygen system.
In this study, the solubility of oxygen in LBE in equilibrium with PbO was obtained by a quenching and analyzing method, and then the equilibrium oxygen partial pressure in LBE–PbO equilibrium was measured using an oxygen sensor of zirconia solid electrolyte (ZrO2þY2O3). From the results, an oxygen potential and temperature diagram in liquid LBE at the oxygen unsaturated region was estimated.
2. Experimental
2.1 Materials
A lead sheet of 99.99 mass% and bismuth grains of
99.99 mass% pure, both from Mitsubishi Metal. Co., were used. PbO, Bi2O3, copper powder and copper(II) oxide powder were all guaranteed reagent grade supplied by Wako Pure Chemical Ind. Ltd.
2.2 Quenching method
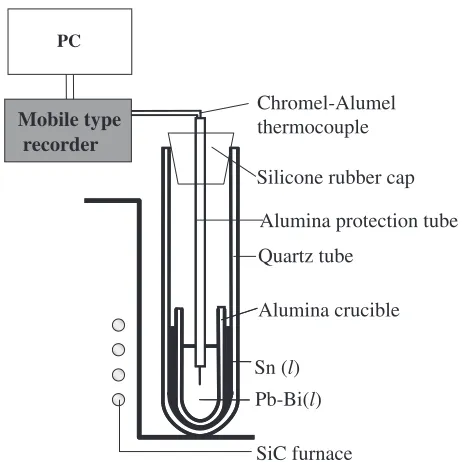
To prepare a sample of uniform oxygen concentration in the metal, three melting methods were tried using 25 g of LBE.
Chromel-Alumel thermocouple
Alumina crucible Quartz tube
PC
Mobile type recorder
Silicone rubber cap
Alumina protection tube
SiC furnace Pb-Bi(l) Sn (l)
Fig. 1 Schematic apparatus to check the cooling rate of the Pb–Bi eutectic alloy (LBE).
*1Graduate Student, Kansai University. Present address: Kobe Steel Ltd.
Shinko Building, Kobe 651-8585, Japan
*2Graduate Student, Kansai University. Present address: Daido Steel Co.,
Ltd., Nagoya, 460-8581, Japan
*3Graduate Student, Kansai University. Present address: Osaka
Namari-suzu Seirensho Co., Ltd., Osaka, Japan
[image:1.595.311.542.525.756.2]‹ LBE was melted directly in one closed end silica glass tube (22 mm OD, 100 mm L).
› LBE was melted in an alumina crucible (15 mm OD, 12 mm ID and 100 mm L) placed in a silica glass tube.
fi LBE was melted in an alumina crucible placed in a silica glass tube with tin between the alumina and the silica glass to accelerate the cooling rate as shown in Fig. 1.
After melting, the silica glass tube was quenched in water. The sample temperature of the cooling process was measured continuously by a thermocouple dipped in the metal and recorded by a mobile type recorder (Keyence NR1000).
2.3 Oxygen analysis
The analytical condition of oxygen in low melting metals, using the inert gas fusion method, was established using Pb or Bi equilibrated with its corresponding oxide at 973 K as a standard sample for oxygen analysis. A schematic diagram of preparing sample for oxygen analysis is shown in Fig. 2. About 25 g of lead in contact with 1.5 g of PbO pellet was held in an alumina crucible placed in a silica glass tube at 973 K and 25 g of bismuth in contact with a Bi2O3pellet of 1.5 g was held directly in the one closed end of a silica glass tube. Pb was held at 973 K for 54 ks and Bi for 36 ks at the same temperature. The holding times, 54 and 36 ks, were decided from the result between holding time and oxygen content in liquid LBE in equilibrium with solid PbO, as shown in Fig. 3. The silica glass tube was quenched in water. Each metal ingot was cut into pieces of about 0.2–0.8 g. Just before the oxygen analysis, the sample was washed with nitric acid (1þ4) for Pb and hydrochloric acid (1þ3) for Bi, dipped in ethanol, then acetone, and dried.
All samples from the present experiment were analyzed by inert gas fusion and infrared absorbing methods (Horiba Co. Ltd., type EMGA620W).
A tin bath (mol fraction: 0.6) was used to lower the vapor pressure of Pb and Bi, and the oxygen extraction temperature of the oxygen analyzer was set to 1873 K.
2.4 Oxygen partial pressure measurements
Galvanic cells used in this study can be represented as follows:
Pt{LaCrO3jPb, PbOjO¼jCu, Cu2OjPt [I]
Pt{IrjBi, Bi2O3jO¼jCu, Cu2OjPt [II]
Pt{LaCrO3jLBE, (PbO or PbO
+ Bi2O3)jO¼jCu, Cu2OjPt [III]
A schematic diagram of the cell arrangement is shown in Fig. 4. About 60 g Pb or Bi with 3 g of PbO or Bi2O3, or about 100 g of LBE with 6 g of PbO was held in an alumina crucible (40 mm OD, 35 mm ID and 100 mm H) at a constant temperature zone in a mullite reaction tube (70 mm OD) closed at one end. In the temperature region where PbO melted, ZrO2þMgO crucible instead of alumina was used. The cell, consisting of a ZrO2Y2O3(8 mm OD, 6 mm ID and 80 mm L) solid electrolyte tube, contained a mixture of
Quartz tube
Bi2O3(s)
Bi (l)
Chromel-Alumel thermocouple Metal head
ZrO2
Rubber tube Gas Inlet Gas Inlet
Rubber tube
Chromel-Alumel thermocouple
Quartz tube
Alumina weight Alumina crucible
SiC furnace Pb (l) or Pb-Bi(l) Sn (l)
PbO (s)
Fig. 2 Schematic apparatus to prepare samples for oxygen analysis.
0
20
40
60
80
0
100
200
Holding time, t/ ks
Oxygen content, C
O
/ mass ppm
973 K
878 K
[image:2.595.136.463.74.297.2] [image:2.595.328.522.337.521.2]Cu and CuO as a reference electrode. At the experimental temperature, Cu reacts with CuO, changing to CuþCu2O equilibrium. The spiral end of a platinum lead wire was pushed into the reference electrode using an alumina protection tube for the platinum lead, thus good contact being obtained between the reference electrode and the electrolyte.
[image:3.595.57.281.69.335.2]Two kinds of electrical lead dipped in the melt were used for the melt. LaCrO3 rod (2 mm dia. and 10 mm long) was used as an electrical contact for cells [I] and [III], and Ir wire (0.5 mm dia. and 10 mm long) was for cell [II]. The LaCrO3 rod was placed at the end of the alumina protection tube, electrical contact being made via a platinum lead wound round one end and iridium was spot welded at the tip of the Pt wire. Both contact parts were covered by alumina cement to prevent the contact of Pt lead with the melt, as shown in Fig. 4.
The upper end of the mullite reaction tube was sealed with a water-cooled stainless cap provided with openings for evacuation and protection tubes for the lead wire of the cell and a thermocouple.
A silicon carbide resistance furnace was used, and its temperature was controlled within 1K using a PID controller.
After the cell was assembled, the reaction tube was evacuated and heated slowly to about 500 K to ensure gas tightness and dehydration. Ar gas was introduced into the reaction tube and then heated to the temperature for emf measurement under a stream of Ar.
3. Results and Discussion
3.1 Cooling rate
Figure 5 shows a comparison of the cooling rate among the
three different melting methods,‹,›andfi. As is clear from the figure, it took 15 s from 1000 to 400 K for method‹, and 40 s for methodfi.
According to these results, method‹was adopted for Bi, and methodfifor Pb and LBE to avoid reaction between PbO and SiO2.
3.2 Solubility of oxygen in Pb, Bi and LBE
Table 1 shows oxygen concentrations in liquid Pb and Bi equilibrated with the respective oxide at 973 K with the results of other investigators.2–9)Oxygen concentrations in Pb and Bi at 973 K in this study agree well with those of other investigators, although the agreement among the references for Bi is not good.
From this result, the analytical condition of oxygen using the inert gas fusion-infrared absorption method was found to be suitable for low melting metals.
Figure 6 demonstrates the XRD pattern of PbO equili-brated with LBE at 873, 923, 973, 1023 and 1073 K for 36 ks. Only PbO (yellow + red) was identified; it seemed that the yellow PbO was generated during cooling. Furthermore, ICP analysis proved that the Bi content in PbO was 0.01– 0.2 mol%. From this fact, the oxide equilibrated with LBE was determined to be a solid solution of PbO below 1098 K, with a very small amount of Bi2O3.
The logarithms of oxygen concentration in liquid LBE equilibrated with PbO at 878, 973, 1023 and 1073 K against the reciprocal of absolute temperature are plotted in Fig. 7 together with the data of Gromov et al.1) Their oxygen
solubilities show fairly low compared with our data. The straight line of log(Co/mass ppm) against 1/T in this study can be expressed by eq. (1).
logðCO=mass ppmÞ ¼ 4:74103=Tþ7:06ð0:03Þ
ð8785T=K51073Þ ð1Þ
3.3 Oxygen partial pressures in Pb/PbO, Bi/Bi2O3and LBE/(PbO and/orPbOþBi2O3) equilibria
Emf measurements were carried out using cells [I], [II] and [III], respectively. A steady emf was obtained several hours after reaching the desired temperature. When the
ZrO2(+MgO) crucible
SiC furnace LaCrO3or Ir
Pb or Bi
Cu-Cu2O
Chromel-Alumel
thermocouple Silicone rubber plug
O-ring
Ar gas
Mullite tube Water-cooled
copper tube
Zirconia solid electrolyte Zirconia tube
Alumina crucible or
Alumina cement
PbO or Bi2O3
Pt lead
Mullite tube
Alumina brick
Fig. 4 Schematic arrangement of the cell for EMF measurements.
0
100
200
300
400
500
300
400
500
600
700
800
900
1000
Time, t/ s
Temperature, T/ K
[image:3.595.326.524.72.259.2]temperature was changed, a new steady emf was obtained after 10.8 ks.
Figure 8 shows the temperature dependencies of emf values for cells [I], [II] and [III]. The break point in the emf of
cell [II] corresponds to the transformation of solid Bi2O3, and that for cell [III] to the melting of PbO and making PbOþ
Bi2O3 melt.
Least square linear regression analyses gave eqs. (2) to (4) for cells [I], [II] and [III], respectively.
E=mV¼262:80:1416T=K ð0:21Þ
ð7095T=K5970Þ ð2Þ
E=mV¼131:40:1251T=K ð0:12Þ
ð7715T=K51012Þ
¼74:310:0687T=K ð0:06Þ
ð10125T=K51067Þ ð3Þ
E=mV¼256:30:1792T=K ð0:18Þ
ð7205T=K51098Þ
¼ 204:5þ0:2406T=K ð0:86Þ
ð10985T=K51252Þ ð4Þ
10
20
30
40
50
Diffraction angle, 2
θ
/deg.
Intensity (a.u.)
923 K 973 K 1023 K
878 K
PbO (yellow) PbO (red)
1073 K
Fig. 6 XRD patterns of the oxide equilibrated with LBE.
0.8 0.9 1.0 1.1 1.2
1 1.5 2 2.5
312001100 1000 900 800
10 100 1000
Reciprocal temp., ((1/T) 103)/ K-1
log (C
O
/ mass ppm)
Temperature, T/ K
This study Gromov et al.1)
Oxygen content, C
O
/mass ppm
Fig. 7 Relationship between oxygen content in LBE and temperature.
600 800 1000 1200 0
50 100 150
200200 400 600 800 1000
EMF, E/ mV
Temperature, t/
Temperature, T/ K
Pb - PbO
Bi -Bi2O3
LBE - [PbO - Bi2O3]
[image:4.595.50.313.91.470.2]Fig. 8 EMF of cells (I), (II), and (III). Table 1 Oxygen solubility limit in Pb and Bi.
log(Co/mass ppm)
= A=TþB Co/mass ppm Temp.
(K) References
A B T=K¼973
Pb 5201 7.34 98.8 601–1073 Otsuka and Kozuka2Þ
5240 7.44 113 600–1153 Alcock and Belford3Þ
5000 7.20 115 673–973 Gromov1Þ
5443 7.60 101 — Charle and Osterwald4Þ
5062 7.23 107 773–1773 Richardson and Webb5Þ
4884 7.03 102 — Risold, Nagata, and Suzuki6Þ
— — 91 973 This study
Bi 4820 7.26 202 545–979 Otsuka and Kozuka2Þ
4660 7.02 170 — Risold, Hallstedt and
Gauckler7Þ
3400 5.48 96.8 673–1023 Griffith and Mallett8Þ
4388 6.70 155 — Isecke and Osterwald9Þ
[image:4.595.328.540.93.538.2] [image:4.595.327.525.304.531.2] [image:4.595.72.264.512.702.2]The standard Gibbs energy of formations of PbO and Bi2O3 can be obtained by combining the Gibbs energy of formation of Cu2O according to Charette and Flengas.10)
Gf(PbO)=kJmol1¼ 217:5þ0:0986T
ð7095T=K5970Þ ð5Þ
Gf(Bi2O3)=kJmol1¼ 576:5þ0:2863T
ð7715T=K51012Þ ð6Þ
¼ 543:4þ0:2537T
ð10125T=K51067Þ ð7Þ
TheGf(PbO) andGf(Bi2O3) of this study agreed very well with those of other investigators.3,9–16)
Equations (8) and (9) show the relation between loga-rithms of partial pressure of oxygen and reciprocal temper-ature for cell [III].
logðpO2=PÞ ¼11:062:259104=T
ð7205T=K51098Þ ð8Þ
logðpO2=PÞ ¼2:601:330104=T
ð10985T=K51252Þ ð9Þ
wherePis 101325 Pa.
By combining eqs. (1) and (8) and assuming that Sieverts’ law is obeys up to the solubility limit of oxygen in LBE, the oxygen potential at the oxygen unsaturated region was estimated as a function of oxygen concentration and temper-ature as,
RTlnðpO2=PÞ=(J/mol)
¼ 58:59T2:510105
þ38:29TlogðCO=mass ppmÞ ð10Þ
To evaluate the formation of an oxide protection film on the inner wall of the cooling pipe in the lead–bismuth cooled fast reactor, which is basically made of the Fe–Cr alloy, the potential diagram of Pb–Bi–O and Fe–Cr–O systems was constructed in Fig. 9. The relation in eq. (10) can be seen in Fig. 9 together with the oxygen potentials of H2–H2O, Fe– FeO, FeO–Fe3O4, Fe–FeCr2O4–Cr2O3 and Cr–Cr2O3 equi-libria, when considering the equilibrium between LBE and
Fe–Cr alloy containing about 10 mass% chromium. The oxygen potential of Fe–FeCr2O4–Cr2O3 equilibrium was obtained by extrapolating the data of Jacobet al.17)down to
the temperature region in Fig. 9.
The relation between the oxygen contents in LBE and oxide species, which may be expected to precipitate on the surface of the Fe–Cr alloys at a given temperature, can be seen in Fig. 9.
Table 2 shows the relationship between the oxygen contents in LBE and oxides expected to precipitate on the surface of the Fe–Cr alloy at 873 K, which is within the operating temperature.
3.4 Solution model
Several theories and models have been proposed to describe the compositional variation of the activity coef-ficient of oxygen, O, in liquid binary alloys. In 1973,
Wagner18)derived an equation for activity coefficient using a
chemical approach. The basic assumptions underlying this model are that the solvent atoms exhibit ideal solution behavior and the dissolved oxygen atoms occupy quasi-interstitial sites. In 1981, Blander19)described the dissolution
of a solute atom in a binary solvent in terms of four types of atomic interactions. By applying Blander’s model to the system Pb–Bi–O, eq. (11) may be derived forO.
O¼ XZ
i¼0
Z!
i!ðZiÞ!
xBiBit
O(Bi)1=Z
!Zi
xPbPbt
O(Pb)1=Z
!i
exp g
E i
RT
( )1
ð11Þ
gEi ¼iðZiÞhb=2 ð12Þ
Where
O: Activity coefficient of oxygen T: Temperature of the sysytem
Z: Coordination number of dissolved solute atom
i: Number of B atom in coordination cluster
Zi: Number of A atom in coordination cluster
t: Geometric parameter
xBi: Molar fraction of component Bi xPb: Molar fraction of component Pb
Bi: Activity coefficient of Bi in Pb–Bi binary alloy
600 800 1000 1200
200 400 600 800 1000
Fe-Fe3O4 Fe-FeO
Temperature ,T/ K
LBE - PbO H2/H2O=10 -2
H2/H2O=10 -1
H2/H2O=1
H2/H2O=10
H2/H2O=10 2 -200
-400
100 ppmO
RTln(
pO2
/
P
o ) (kJ/ mol)
FeO-Fe
3O4 Temperature, t /
Fe-FeCr2
O4-Cr2O 3
Cr - Cr2O3 -600 -300 -500 -700 10 ppmO 1 ppmO 10-1 ppmO 10-2 ppmO
H2/H2O=10 3
H2/H2O=10 4
H2/H2O=10 5 10-3 ppmO 10-4 ppmO 10-5 ppmO 10-6 ppmO 10-7 ppmO 10-8 ppmO 10-9 ppmO
[image:5.595.305.550.106.262.2]Fig. 9 Potential diagram of Pb–Bi–O and Fe–Cr–O systems.
Table 2 Relationship between oxygen contents in LBE and oxides expected to precipitate on the surface of the Fe–10 mass%Cr alloy at 873 K.
Oxygen content in LBE, Co/mass ppm
Oxides expected to
precipitate H2/H2O ratio
4109 None 3105
4109
Cr2O3
3105 3107 3:6103
3107 Cr
2O3þFeCr2O4(spinel) 3:6103
3107
FeCr2O4(spinel)
3:6103
3104 3:6
3104
FeOþFeCr2O4(spinel) 3:61 1103
110343 FeCr
[image:5.595.73.268.596.767.2]Pb: Activity coefficient of Pb in Pb–Bi binary alloy
O(Bi): Activity coefficient of oxygen in pure Bi
O(Pb): Activity coefficient of oxygen in pure Pb
gE
i: Excess free energy
hb: Enthalpy of solute for coordination cluster
Otsukaet al.20)applied eq. (12) to oxygen in liquid Pb–Bi alloys at 1073 K withhb¼ 1:60kJ,t¼0:33andZ ¼6and
confirmed that the value O(Pb–Bi) obtained by the above
model agreed very well with that from their experimental data. Saboungi21)pointed out that the temperature
depend-ence ofhbmay be ignored. According to his proposal,O(Pb–
Bi) at 973 K in this study was calculated usinghb,tandZto
be1:60, 0.33 and 6, respectively, and Moser’s experimental data22) for the activity values of Pb–Bi alloys. Figure 10
shows the results together with those of other investiga-tors.4,9,20,23)The curves in the figure, from this study at 973 K
and from Otsukaet al.at 1073 and 1173 K, showOobtained
[image:6.595.75.234.70.240.2]using Blander’s model. It seems that the agreement between the experimental points and curves from the model calcu-lation is good because the Pb–Bi system is regarded to obey the regular solution behavior.
Figure 11 shows the compositional dependence ofpO2for the equilibrium between Pb–Bi alloys and PbO with the experimental data of Sugimotoet al.,24)and of Kapoor and
Mehrotra.25)The results of this study agreed very well with
those of other investigators. Logarithms of pO2 were ex-pressed as follows.
logðpO2=PÞ ¼1:70x2Pb4:09xPb10:66
ð973KÞ ð13Þ
logðpO2=PÞ ¼1:19x2Pb3:33xPb8:74
ð1073KÞ ð14Þ
Combining the pO2 values and O(Pb–Bi) calculated by
Blander’s coordination cluster theory, a model calculation of composition dependence of solubility limit of oxygen in a Pb–Bi melt was performed and is shown in Fig. 12.
4. Summary
In order to obtain the solubility and activity of oxygen in Pb–Bi melts, research for oxygen analysis and oxygen partial pressure measurement in lead–bismuth eutectic alloy (LBE) was performed. The analytical condition of oxygen in low melting metals was established using Pb or Bi equili-brated with its corresponding oxide at 973 K as standard samples.
The temperature dependence of oxygen solubility in liquid LBE was expressed by the following equation,
logðCO=mass ppmÞ ¼ 4:74103=Tþ7:06ð0:03Þ
ð8785T=K51073Þ
Oxygen partial pressure in LBE–(PbO–Bi2O3) equilibrium was measured using an oxygen sensor of a zirconia solid electrolyte (ZrO2Y2O3), and obtained as a function of temperature as
0 0.2 0.4 0.6 0.8 1
-10 -9 -8 -7 -6 -5 -4 -3
x
Pbln
γ
O973 K 1073 K 1173 K
Pb Bi
This study Isecke et al.9) Charle et al.4)
Otsuka et al.2), 20) Taskinen23)
[image:6.595.330.524.70.261.2]Calculated using eq.s (11) and (12) and Otsuka's experimental value. Calculated using eq.s (11) and (12) and this experimental value.
Fig. 10 Compositional dependence of the activity coefficient of oxygen, O, in liquid Pb–Bi alloys.
0 0.2 0.4 0.6 0.8 1 -14
-12 -10 -8
This study Sugimoto24)
kapoor and Mehrotra25)
x
Pb973 K
log(
p
O2/ p
)
1173 K
1073 K
Bi Pb
Fig. 11 Compositional dependence of oxygen partial pressure in liquid Pb–Bi alloys.
0 20 40 60 80 100 100
200
at% Pb
Mass ppm
O
This study Otsuka et al.2) Charle and Osterwald4) Risold, Nagata, and Suzuki6) Griffith and Mallett8)
973 K
Gromov et al.1) Alcock and Belford3) Richardson and Webb5) Risold, Hallstcdt, and Gauckler7)
Isecke and Osterwald9)
Bi Pb
[image:6.595.326.523.310.523.2]logðpO2=PÞ ¼11:062:259104=T
ð7205T=K51098Þ
logðpO2=PÞ ¼2:601:330104=T
ð10985T=K51252Þ
From the results, the oxygen potential in LBE at the oxygen unsaturated region was estimated as,
RTlnðpO2=PÞ=(J/mol)¼ 58:59T2:510105
þ38:29TlogðCO=mass ppmÞ:
Oxide species expected to precipitate on the Fe–Cr alloy were discussed when considering the equilibrium between LBE and Fe–Cr alloy from the relationship between oxygen partial pressure and oxygen content in LBE.
Compositional dependencies of the activity coefficient of oxygen, oxygen partial pressure and solubility of oxygen in LBE were calculated and compared with the literature data.
REFERENCES
1) B. F. Gromovet al.:The Problems of Technology of the Heavy Liquid Metal Coolants(Lead–Bismuth, Lead) (1998).
2) S. Otsuka and Z. Kozuka: Trans. JIM22(1981) 558–566.
3) C. B. Alcock and T. N. Belford: Trans. Faraday Soc.60(1964) 822– 835.
4) H. Charle and J. Osterwald: Z. Phys. Chem.99(1976) 199–208. 5) F. D. Richardson and L. E. Webb: Trans. Ins. Min. Metall.64(1954–
55) 529–564.
6) D. Risold, J.-I. Nagata and R. O. Suzuki: J. Phase Equilibria19(1998)
213–233.
7) D. Risold, D. Hallstedt, L. J. Gauckler, H. L. Lukas and S. G. Fries: J. Phase Equilibria16(1995) 223–234.
8) C. B. Griffith and M. W. Mallett: J. Am. Chem. Soc.75(1953) 1832– 1834.
9) B. Isecke and J. Osterwald: Z. Phys. Chem. Neue Folge115(1979) 17– 24.
10) G. G. Charette and S. N. Flengas: J. Electrochem. Soc.115(1968) 796– 804.
11) K. T. Jacob and J. H. E. Jefles: Trans. Inst. Min. Metall.80(1971) C32– 41.
12) A. Roine: Outokumpu HSC Chemistry for Windows, Chemical Reaction and Equilibrium Software Extensive Thermochemical Data-base (2000).
13) O. Knacke, O. Kubaschewski and K. Hesselmann: Thermochemical Properties of Inorganic Substances, 2nd ed. (Springer Verlag, 1991). 14) J. P. Coughlin: Bull. 542, Bureau of Mines, Contributions to the data on
theoretical metallurgy (1954) 27.
15) K. Kameda, K. Yamaguchi and T. Kon: J. Japan Inst. Metals56(1992) 900–906.
16) R. Ganesan, T. Gnanasekaran and R. S. Srinivasa: J. Chem. Thermodyn.35(2003) 1703–1716.
17) K. T. Jacob and C. B. Alcock: Metall. Trans. B6B(1975) 215–221. 18) C. Wagner: Acta Met.21(1973) 1297–1303.
19) M. Blander, M.-L. Saboungi and P. Cerisier: Metall. Trans. B10B (1979) 613–622.
20) S. Otsuka, Z. Kozuka and Y. Kurose: Metall. Trans. B15B(1984) 141– 147.
21) M.-L. Saboungi, P. Cerisier and M. Blander: Metall. Trans. B13B (1982) 429–437.
22) Z. Moser: Z. Metallk.64(1973) 40–46. 23) A. Taskinen: Z. Metallk.73 (1982) 163–168. 24) E. Sugimoto: Ph. D. thesis, Osaka University, 1983.