of merit (ZT) had the maximum atRRu/Ca¼1:1, and the highest ZT value was 0.034 at 1020 K. [doi:10.2320/matertrans.MRA2007055]
(Received March 7, 2007; Accepted April 9, 2007; Published May 25, 2007)
Keywords: calcium ruthenate, thermoelectric, spark plasma sintering
1. Introduction
Perovskite-type alkaline-earth metal ruthenium oxides, SrRuO3 (SRO) and CaRuO3 (CRO), have been known as
excellent electrical conductors. These materials have been applied as buffer layers in a superconductor-normal metals-superconductor (SNS) Josephson junction1)and as electrical conducting pastes.2) ARuO3 (A = Ca and Sr) compounds
show metallic electrical conductivity,1–3)associating with d-electrons from the three-dimensional network corner-sharing RuO6 octahedra. SRO can be ferromagnetic below 165 K
whereas CRO has not been confirmed to be either para- or ferro-magnetic material.3) The electrical conductivity of
CRO4,5) and SRO4–6) single crystals were around 4105
Sm1 and 5105Sm1at room temperature, respectively.
The magnetic and electrical properties of SRO and CRO may be related to their crystal structures, which are orthorhombi-cally distorted GdFeO3 type with Pnma and Pbnm space
group, respectively.7)CRO has much more distorted structure
than SRO,7,8)and therefore some characteristic properties of CRO may be expected.
Since ARuO3 is a good electrical conductor with specific
crystallographic characteristics, they might be potential thermoelectric materials. Recently, Tsuchida et al.9)reported that the thermoelectric power factor of CRO increased with increasing temperature showing the highest value among perovskite-structure oxides (330106Wm1K2 at
1023 K). Several researchers have investigated the electrical property of CRO thin films prepared by sol-gel,10)
sputter-ing11) and pulsed laser ablation.12) Scotti di Uccio et al.11)
proposed that CRO films prepared by sputtering would contain excess Ca resulting in the increase in unit cell volume. The excess Ca might have also resulted in the decrease in electrical conductivity. However, the measure-ment of electrical properties and crystallographic analysis of dense bulk materials would be more reliable than those of thin films. Therefore, dense CRO bulk body should be investigated to understand the intrinsic nature of CRO.
The thermoelectric property of CRO body has not been
studied in detail because dense CRO sintered body cannot be obtained by conventional sintering mainly due to the evaporation of RuO3.13) It is known that spark plasma
sintering (SPS) can be available to obtain dense bodies by using non-sinterable powder in conventional sintering proc-ess. In the present study, dense CRO body was prepared by spark plasma sintering (SPS), and the effect of Ru/Ca ratio on the crystal structure, electrical properties and thermo-electric properties was investigated.
2. Experimental
CaRuO3 powder was synthesized by solid state reaction
using CaCO3(99.99%) and RuO2(99.99%) in the molar ratio
of Ru to Ca (RRu/Ca) between 0.5 and 1.4. The powder mixtures were calcined at 1273 K for 43.2 ks in air. The calcined powder was compacted in a graphite die and sintered by SPS at 1523 K for 0.3 ks in a vacuum at 80 MPa. The sintered body was cut to2210mm for measuring electrical conductivity by a d.c. 4-probe method and Seebeck coefficient by a thermoelectric power (E)-temperature difference (T) method. Specimens of 10 mm in diameter and 1 mm in thickness were employed to measure thermal conductivity by a laser flash method (ULVAC TC-7000). All electrical and thermal measurements were conducted from room temperature (RT) to 1023 K. The phase and crystal structure were examined by X-ray diffraction (Rigaku Geigerflex). The density (d) was determined by an Archi-medes method.
3. Results and Discussion
Figure 1 shows the XRD patterns of Ca-Ru-O compounds at RRu/Ca¼0:5 to 1.4. At RRu/Ca¼1:0, CRO in a single phase was obtained. Second phases of CaO and RuO2 were
identified atRRu/Ca¼0:8and 1.2, respectively. The volume fraction of second phases, CaO and RuO2, increased with
detaching from RRu/Ca¼1:0. Although Ca2RuO4 and
were not identified in the present study. These phases would have formed at a higher sintering temperature.14)
Figure 2 shows the relationship between the relative density andRRu/Ca. The density atRRu/Ca¼0:5to 1.0 ranged between 80 and 85%, and slightly increased with increasing
RRu/Ca. At RRu/Ca>1:0 the density significantly increased with increasing RRu/Ca. The second phase of RuO2 might
cause the increase in density.
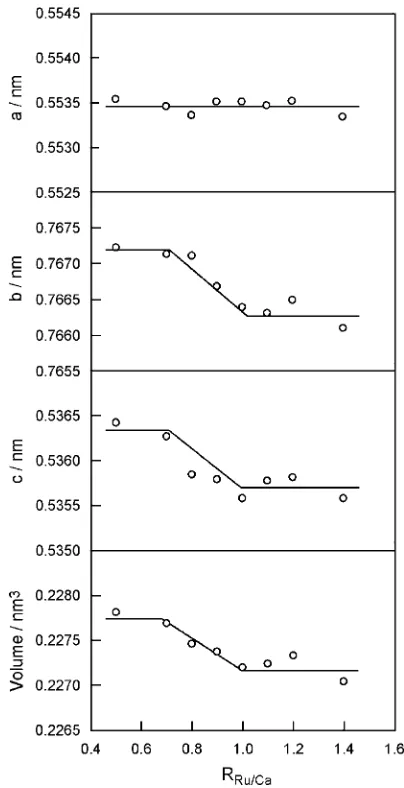
Figure 3 demonstrates the effect of RRu/Ca on the lattice
parameters and unit cell volume. The length of a axis was independent of RRu/Ca, and was almost constant value of
0.5535 nm. The lengths of b and c axes decreased from 0.7672 to 0.7663 nm and from 0.5364 to 0.5356 nm with increasing RRu/Ca from 0.7 to 1.0, respectively. The lattice parameters were constant with further increasingRRu/Ca. The unit cell volume also changed withRRu/Ca, suggesting a solid solution range betweenRRu/Ca¼0:7and 1.0. The unit cell volume atRRu/Ca¼0:5 was 0.26% greater than that at the stoichiometric composition. The trend of increase in the unit cell volume with increasing Ca content was similar to that of thin film reported by Scotti di Uccio.11)However, the unit cell volume change of thin film was around 8% atRRu/Ca¼0:5. The lattice parameters of bulk materials can be intrinsic
behavior whereas thin films may be significantly stressed mainly from the thermal expansion mismatch between film and substrate. The chemical composition of bulk materials would be more precise than that of thin films because of large volume. Therefore, the trend of lattice parameter change as the function ofRRu/Cawould be more reliable than that of thin films.
Figure 4 shows the temperature dependence of electrical conductivity () of Ca-Ru-O compounds at various RRu/Ca.
The electrical conductivity decreased with increasing tem-perature, implying metallic conduction. The slightly decreased with increasing temperature at RRu/Ca<1:0,
whereas the decrease in was significant atRRu/Ca>1:1.
Theof stoichiometric CRO was1:8105Sm1at 293 K.
The of stoichiometric SRO was higher than that of stoichiometric CRO but lower than CRO at RRu/Ca>1:1. Theincreased with increasingRRu/Ca. AtRRu/Ca>1:1, the
was much higher than that atRRu/Ca<1:0. This might be caused by the second phase of RuO2 because of its high
conductivity (1:4106Sm1 at 293 K). Raming et al.15)
reported that YSZ (Y2O3-stabilized ZrO2)-RuO2 composite
had high electrical conductivity due to agglomerated RuO2.
However, the second phase of CaO in CRO atRRu/Ca<1:0
Fig. 1 XRD pattern of sintered Ca-Ru-O compounds with different
RRu/Ca¼0:8(a), 1.0 (b) and 1.2 (c).
Fig. 2 Effect ofRRu/Caon the relative density of Ca-Ru-O compounds.
[image:2.595.324.526.70.464.2] [image:2.595.62.280.70.244.2] [image:2.595.70.272.292.473.2]may result in the decrease inbecause CaO is an insulating material (<108Sm1 at 293 K).16)The change of unit cell
volume of CRO at RRu/Ca¼0:5 to 0.9 might be also associated with the decrease in.
Figure 5 exhibits the relationship between the unit cell
volume (V) and electrical conductivity at room temperature in the Ca-rich region (RRu/Ca¼0:5 to 0.9). The ratio of the unit cell volume in the Ca-rich region (V) to that atRRu/Ca¼
1:0 (V0) increased with decreasing RRu/Ca from 1.0 to 0.7
(Fig. 5(a)). The loglinearly decreased with increasing V/ V0(Fig. 5(b)). This trend was consistent with that reported in
the CRO thin film by Scotti di Uccio et al.11)However, the change of in the present bulk CRO body was more significant than that of CRO thin film. Since the electrical conduction of CRO may be closely related with the connection of RuO6 octahedra, the increase in unit cell
volume could cause the less electrical conductivity.
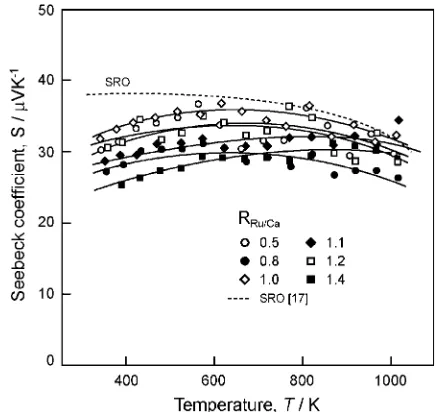
Figure 6 represents temperature dependence of Seebeck coefficient (S) of CRO at variousRRu/Ca. The value of SRO was included as comparison. All specimens showed positive Seebeck coefficient, implying a p-type conduction. The S of CRO was 25 to 35VK1, almost independent ofRRu/Caand
temperature from RT to 1020 K. The CRO at RRu/Ca¼1:0
had the highest S in the whole temperature range. The S of SRO was around 30 to 40VK1,17) which was slightly
higher than that of CRO.
Figure 7 shows the temperature dependence of power factor (P = S2) of CRO and SRO. The P of CRO at the stoichiometric composition decreased from 165 to
110106Wm1K2 with increasing temperature from
RT to 1020 K. This value was lower than that of SRO. The P of CRO atRRu/Ca¼1:1was almost the same as that of SRO.
The P of CRO and SRO both similarly decreased with increasing temperature. On the other hand, the P of CRO reported by Tsuchida et al.9) increased with increasing
temperature. This trend might not be the intrinsic nature of CRO because theof ARuO3would generally decrease with
increasing temperature and the S would be independence of temperature. Since CRO cannot be fully densified by conventional sintering, some grain boundary effects might have affected to the unusual trend.
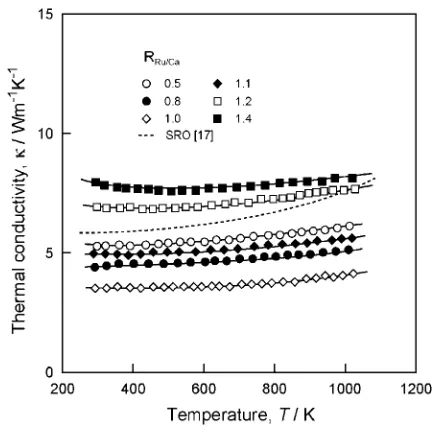
Figure 8 shows temperature dependence of thermal con-ductivity () of CRO with variousRRu/Caand SRO.17)The
Fig. 4 Temperature dependence of electrical conductivity of Ca-Ru-O compounds.
Fig. 5 (a) Effect ofRRu/Caon unit cell volume change and (b) relationship between unit cell volume change and logat room temperature of Ca-Ru-O compounds. (Vodenotes the volume of CaRuO3atRRu/Ca¼1:0).
[image:3.595.63.280.68.266.2] [image:3.595.316.537.71.277.2] [image:3.595.69.267.314.660.2]of CRO increased slightly with increasing temperature. The lowestranged around 3.5 to 4.0 Wm1K1at theRRu/Ca¼
1:0 from 293 to 1020 K. The decreased from 5.3 to 3.5 Wm1K1 with increasing RRu/Ca from 0.5 to 1.0, and
increased from 6.6 to 8.0 Wm1K1 with further increasing
RRu/Caat RT. This might be resulted from the effect of second phase of RuO2and CaO because their thermal conductivities
would be several times greater than that of CRO as shown in Table 1. The of SRO slightly increased with increasing temperature around 6 to 8 Wm1K1 from RT to 1200 K. These values were less than that of CRO at RRu/Ca>1:2
whereas higher than that ofRRu/Ca<1:1.
Table 1 summarizes the lattice parameters and thermo-electric properties of CRO and SRO prepared by different methods. A tolerance factor (t) is defined to evaluate the geometric distortion of crystal structure. The t of crystal structure without distortion is 1. Thetof CaRuO3is 0.88 and
that of SrRuO3 is 0.95. Kobayashi et al.8)reported that the
electrical conductivity decreased with decreasing the t. The lattice parameters of CRO prepared by SPS were slightly higher than that of single crystal. Furthermore, with decreas-ing RRu/Ca from 1.0 to 0.7 the lattice parameters of CRO increased and the decreased. The increase in lattice parameter might result in the increase in the distortion degree (t). The crystal structures of Bi2-xLnxRu2O7 and
Pb2-xLnxRu2O7-d(Ln = Y, Pr-Lu) pyrochlores are known to
be similar to the GdFeO3-type perovskite structure having a
framework of corner-sharing RuO6octahedra. Kanno et al.18)
reported that the of the pyrochlores decreased with increasing x, suggesting the increase in the distortion of the RuO2 octahedra and the increase in the length of the Ru-O
bonds and RuO6zigzag chains. Therefore, the decrease in the
of CRO at RRu/Ca<1:0 may be associated with the distortion of crystal structure and the increase in the Ru-O bond length and the RuO6zigzag chains. So far, no reports on
the Seebeck coefficient and thermal conductivity of CRO have been published. The S and of CRO were slightly smaller than these of SRO. However, thewas almost a half of SRO, resulting in the higher thermoelectric figure of merit than that of SRO.
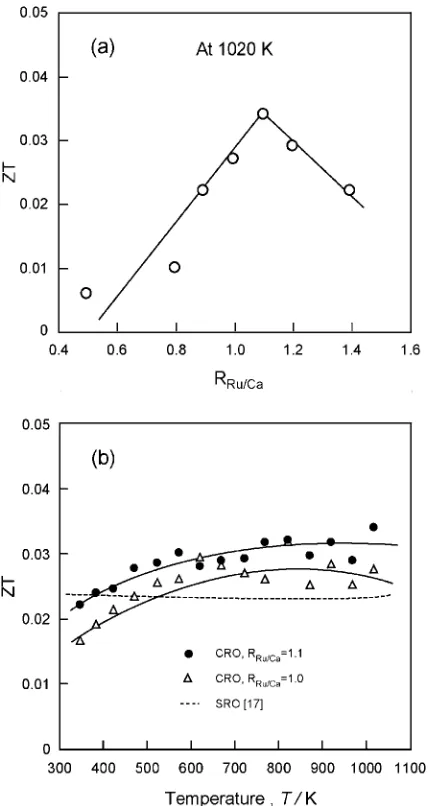
Figure 9 shows the temperature dependence of dimension-less thermoelectric figure of merit (ZT) calculated from eq. (1).
ZT ¼S2T= ð1Þ
The ZT values of CRO at RRu/Ca¼1:0 and 1.1 slightly increased with increasing temperature, and were greater than
Fig. 8 Temperature dependence of thermal conductivity of Ca-Ru-O compounds.
[image:4.595.61.279.68.257.2]Fig. 7 Temperature dependence of power factor of Ca-Ru-O compounds.
Table 1 Characteristics and physical properties of CaRuO3and SrRuO3.
Structure/
Lattice parameters (nm)
Tolerance (Sm1) Seebeck Thermal
space group a b c factors at RT coefficient conductivity Method/Ref (VK1) (Wm1K1)
CaRuO3 0.5535 0.7663 0.5355 0.888Þ 1:8105 25–35 3.5–4.0 SPS
Orthorhombic/ 0:210519Þ — — Pressureless19Þ
Pnma7Þ
0.5528 0.7660 0.53554Þ 4:01054;5Þ — — Single crystal4;5Þ
SrRuO3 0.557 0.555 0.78717Þ 0.958Þ 2:610518Þ 30–4021 6.0–8.021 SPS21
Orthorhombic/ 0:710520Þ — — Pressureless20Þ
Pbnm7Þ
0.5572 0.5531 0.78494Þ 5:01054;6Þ — — Single crystal4{6Þ
RuO2 14:0105 — 13.0–23.0 SPS
CaO <108 — 14.84 (RT) 16Þ
[image:4.595.317.534.69.283.2] [image:4.595.47.551.631.776.2]that of SRO17)from 600 to 1020 K. The CRO had higherZT
than SRO because of the lower thermal conductivity. TheZT
value at 1020 K increased with increasing RRu/Ca up to 1.1 and showed maximum value of 0.034, and then decreased to 0.023 with increasingRRu/Cato 1.4 (Fig. 9(a)). The CRO at
RRu/Ca¼1:1 had the highest ZT in the whole temperature range (Fig. 9(b)).
4. Conclusion
Ca-Ru-O compounds in various molar ratios of Ca to Ru (RRu/Ca) from 0.5 to 1.4 were prepared by SPS. CaRuO3
(CRO) in a single phase was obtained at RRu/Ca¼1:0, whereas second phases of CaO and RuO2 were identified at
RRu/Ca<0:8 and RRu/Ca>1:1, respectively. The relative
The authors are grateful to JSPS-KOSFF Asian CORE program and Furuya Metal Co., Ltd. for financial support.
REFERENCES
1) K. Char, M. S. Colclough, T. H. Geballe and K. E. Myers: Appl. Phys. Lett.62(1993) 196–198.
2) K. Gurunathan, N. Vyawahare and D. P. Amalnerkar: J. Mater. Sci.: Materials in Electronics16(2005) 47–56.
3) I. Felner, I. Nowik, I. Bradaric and M. Gospodinov: Phys. Rev. B62
(2000) 11332–11335.
4) R. J. Bouchard, J. L. Gillson and E. I. du Pont de Nemours: Mater. Res. Bull.7(1972) 873–878.
5) L. Capogna, A. P. Mackenzie, R. S. Perry, S. A. Grigera, L. M. Galvin, P. Raychaudhuri and A. J. Schofield: Phys. Rev. Lett. 88 (2002) 076602-1–076602-4.
6) P. B. Allen, H. Berger, O. Chauvet, L. Forro, T. Jarlborg, A. Junod, B. Revaz and G. Santi: Phys. Rev. B53(1996) 4393–4398.
7) M. V. Rama Rao, V. G. Sathe, D. Sornadurai, B. Panigrahi and T. Shripathi: J. Phys. Chem. Solids62(2001) 797–806.
8) H. Kobayashi, M. Nagata, R. Kanno and Y. Kawamoto: Mater. Res. Bull.29(1994) 1271–1280.
9) K. Tsuchida, Y. Tanaka, T. Ifuku, Y. Nakao, T. Matsuda, S. Nagashima, H. Maeda and A. Kato: Korean J. Chem. Eng.13(1996) 478–481.
10) S. Yamada, N. Fukuoka, T. Taniguchi, T. C. Ozawa, Y. Nagata, T. Uchida and H. Samata: Thin Solid Films478(2005) 1–5.
11) U. Scotti di Uccio, F. Bevilacqua, G. G. Condorelli, G. Mascolo, F. Ricci and F. Miletto Granozio: Europ. J. Phys. B41(2004) 3–9. 12) S. G. Lee, K. Park, Y. K. Park and J.-C. Park: Appl. Phys. Lett.64
(1994) 2028–2030.
13) W. E. Bell and M. Tagami: J. Phys. Chem.67(1963) 2432–2436. 14) K. T. Jacob, K. T. Lwin and Y. Waseda: J. Electrochem. Soc.150
(2003) E227–E232.
15) T. P. Raming, W. E. van Zyl and H. Verweij: Chem. Mater.13(2001) 284–289.
16) H. H. Glascock, Jr. and E. B. Hensley: Phys. Rev.131(1963) 649–652. 17) T. Maekawa, K. Kurosaki, H. Muta, M. Uno and S. yamanaka: J. Alloy
and Compd.387(2005) 56–59.
18) R. Kanno, Y. Takeda, T. Yamamoto, Y. Kawamoto and O. Yamamoto: J. Solid State Chem.102(1993) 106–114.
19) F. P. de la Cruz, N. E. Massa, V. M. Nassif, S. L. Cuffini, R. E. Carbonio and H. Salva: Phys. Stat. Sol. (b)220(2000) 603–607. 20) J. J. Neumeier, A. L. Cornelius and J. S. Schilling: Physica B198
(1994) 324–328. Fig. 9 Effect ofRRu/Caat 1020 K (a) and temperature (b) on ZT of
[image:5.595.62.277.70.473.2]