Defect Detection in Thick Weld Structure Using Welding In-Process
Laser Ultrasonic Testing System
Setsu Yamamoto
1,+, Takeshi Hoshi
1, Takahiro Miura
1, Jun Semboshi
1,
Makoto Ochiai
1, Yoshihiro Fujita
2, Tsuyoshi Ogawa
2and Satoru Asai
21Power and Industrial Systems Research and Development Center, Toshiba Corporation, Yokohama 235-8523, Japan 2Keihin Product Operations, Toshiba Corporation, Yokohama 230-0045, Japan
A new approach of non-destructive testing for thick welded structural materials based on laser-ultrasonic technique is investigated. In this study, weld part of structural materials, which should be conventionally inspected after welding, is inspected during welding process in order to save time and cost of manufacturing. The laser-ultrasonic is a method to generate and detect ultrasonic signals by laser beams and has potential to be applied to remote inspection/monitoring of materials under welding at elevated temperature. Bulk longitudinal acoustic wave generated by a Q-switched Nd:YAG laser irradiation and detected as surface vibration by laser interferometer coupled with a long pulse detection laser is used to detect defects around the weld. To overcome the lack of sensitivity of laser-ultrasonic testing on thick welded part having a thickness of more than 100 mm at higher temperature, we have originally developed a modified synthesis aperture focus signal processing technique (m-SAFT). The in-process testing with actual piping weld having a thickness of 150 mm with high temperature more than 200 degrees C. was demonstrated. By using m-SAFT, an actual weld defect of 1.5 mm in diameter at 106 mm depth in the specimen was clearly observed. The measurement result well agreed with the result of conventional ultrasonic testing conducted after weld process and also the cross-sectional observation of the specimen. [doi:10.2320/matertrans.I-M2014809]
(Received August 12, 2013; Accepted January 23, 2014; Published April 18, 2014)
Keywords: lase ultrasonic testing, thick welding, welding in-process, synthesis aperture focus technique (SAFT)
1. Introduction
Laser-ultrasonic testing (LUT) that uses lasers as an alternate use of conventional contact transducers has been established.13) Thermal expansion or ablation induced by
short pulse laser irradiation to target surface are used as transmitters. As receivers, laser Doppler vibration measure-ment is used. This combination was originally limited for non-contact measurement in laboratory due to low sensitivity. A long pulsed laser with enhanced peak power and an interferometer applicable to rough surface (ex. Fabry-Perot interferometer) have brought LUT into industrial applica-tion.46) LUT has two significant advantages over conven-tional ultrasonic testing (UT) with contact piezoelectric transducers. First one is applicability to inspection at limited narrow space. To inspect a target, LUT requires only laser irradiation area that sizes are about º1 mm. Using that advantage, authors have developed surface inspection technique using surface acoustic waves which can detect and measure cracks at narrow space. The technique has been applied to structure inspection of inside of the narrow tube
with º10 mm internal diameter in nuclear power plants.79)
The other LUT advantage is applicability to inspection of high temperature target. LUT has been adopted as a thickness measurement method in a process of manufacturing steels or pipes.6) Furthermore, LUT has been applied to weld inspection. However, its use is limited only to thin welding, e.g., spot welding, buildup welding, etc.10,11)because of lack of sensitivity. Weld defects such as blowholes, incomplete fusions, slag inclusion, detection technique for targets thicker than 100 mm has not been established.
On the other hand, in the manufacturing domain, remarkable progress of welding technique enables thick
structure fabrication.12) However, welding thick structures
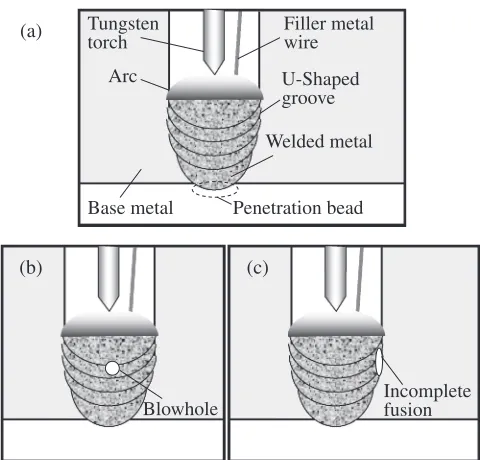
has high probability of defect generation. A schematic diagram of defect generation in thick welding is shown in Fig. 1. Figures 1(a), 1(b) and 1(c) show normally welded area of thick welding at a narrow U-shaped groove, a defect image of blowhole and an incomplete fusion respectively. If these defects were detected after weld, even full re-welding, rather than partial repairing, would be required at worst. Re-working cost would increase depending on the thickness of the welded area. Thus, the inspection technique which can detect defects at early phase and apply to thick weld parts has been strongly required.
Filler metal wire Tungsten
torch
Penetration bead
Arc U-Shaped
groove
Welded metal
Base metal
Blowhole Incompletefusion
(a)
(b) (c)
Fig. 1 Schematic diagrams of the thick welding. (a) Normally welded area. (b) Blowhole image. (c) Incomplete fusion image.
+Corresponding author, E-mail: setsu.yamamoto@toshiba.co.jp
Special Issue on Laser Ultrasonics and Advanced Sensing 2013
[image:1.595.307.547.368.598.2]Thus authors have been proposing welding in-process testing technique.13) In-process testing means conducting
welding and testing simultaneously. Using in-process testing technique, defects can be detected at early phase in welding. To apply the in-process testing to thick target, synthesis aperture focusing technique (SAFT)14,15)have been adopted for improving the signal to noise ratio (SNR) of LUT.
In this study, principles of in-process testing will be offered and experimental results of defect detection which was conducted using 150 mm thick specimen at over 200 degrees C. will be also shown.
2. Principles of In-Process Testing
2.1 Experimental setups
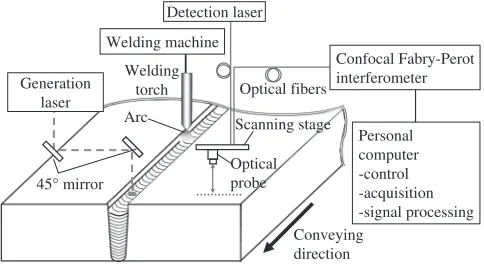
Figure 2 shows a schematic diagram of an in-process testing system. A welding machine for thick welding and lasers are depicted. LUT inspection area was moving behind the welding torch. Giant pulsed Nd:YAG laser (=1064 nm) was used as a generation laser that generates ultrasonic waves. The pulse width was shorter than 10 ns and the energy was 700 mJ/pulse. Long pulsed Nd:YAG laser (=1064 nm) was adopted as a detection laser. The pulse width was about 100 µs and the energy was 15 mJ/pulse. The detection laser was transmitted by optical fibers and irradiated using optical probe which could conduct irradiation and reception with a same object lens. A scanning stage which connected to an optical probe enabled multi point signal detection. For ultrasonic signal extraction, confocal Fabry-Perot interfer-ometer (CFPI) was adopted.1,2)Combination of a long pulsed
laser with CFPI gave high sensitivity and was applicable to rough surfaces. Obtained signals were recorded and used for signal processing by a personal computer.
Irradiated generation laser induced ablation at the target surface and ultrasonic waves were generated. The generated ultrasonic wave, especially bulk wave, propagated inside the welded area and diffracted from defects. Diffracted waves were detected at surface points which were also detection laser irradiation points.
2.2 Principle of signal processing
Echo intensity which was diffracted from defects was inferior to that diffracted from the bottom for use in thick measurement. Simple application of conventional LUT is not
sufficient to achieve required detectability. Several improve-ment methods for SNR of LUT have been proposed, for example, averaging, frequency filtering and SAFT.14,15) To reduce effects of mode conversion echo and enhance spatial resolution, modified-SAFT was adopted in this system.13) Basic SAFT technique for LUT used scanned signals whose generation and detection point was the same. In this system, the generation and detection points were separated like the time of flight diffraction (TOFD).16,17) The generation point
would be definedflexibly. For example, surface of matrix and welding bead. In this paper the surface of welding bead was defined as the generation point. It could excite ultrasonic at a defect which was located just below the bead surface. The detection point was set away from the welding bead where detection laser reflection at the surface was likely to be stable.
In this paragraph, the coordinates for our SAFT system is defined. Scanning direction of detection laser isx-axis which is perpendicular to the welding direction. The welding direction is defined as y-axis and depth direction is defined as z-axis, respectively. Figure 3 shows coordinates for our SAFT system. Illustrated horizontal axis means orthogonal direction of welding and vertical axis means depth direction. The original position of the x-axis is the groove center,yis the welding start point andz=0 is the surface of the target. The generation laser irradiation point is TðXt; ZtÞ, the detection laser irradiation point isRiðXi; ZiÞ(i=1, 2, 3,+,
n), where i means the index of the detection point. In this system, the irradiation point of the generation laser isfixed at the welding bead surface, meaning that Tð0; ZtÞ ¼TðZtÞ.
And the detection laser is irradiated only on the target surface giving, in the same analogy, RiðXi;0Þ ¼RiðXiÞ. If the
coordinates of the meshes assumed in the xz section, where the ultrasonic wave propagates, is written by ðX; ZÞ, the propagation time from the generation pointT, to the detection point Ri, is given by
ti¼
ffiffiffiffiffiffiffiffiffiffiffiffiffiffiffiffiffiffiffiffiffiffiffiffiffiffiffiffiffiffiffi
X2þ ðZZtÞ2
p
þ ffiffiffiffiffiffiffiffiffiffiffiffiffiffiffiffiffiffiffiffiffiffiffiffiffiffiffiffiffiffiffiðXXiÞ2þZ2 p
VL
ð1Þ
Here,VLis the velocity of the longitudinal wave in the testing
target. The received signal atRiissiðtÞ. Using eq. (1), signal
intensities of each mesh are given
Welding torch
Conveying direction Welding machine
Confocal Fabry-Perot interferometer Optical fibers
Personal computer -control -acquisition -signal processing Detection laser
Scanning stage
Optical probe Arc
45° mirror Generation
laser
Fig. 2 Experimental setup of an in-process testing system.
)
,
(
X
tZ
tT
R1 Ri Rnz
Defect
)
,
(
X
iZ
iRi
Ri Rn R1
x
[image:2.595.307.544.69.229.2] [image:2.595.49.291.71.205.2]UiðX; ZÞ ¼ Z tiþt
ti SiðtÞdt: ð2Þ
Here,¦tis the width of the time window for signal intensity extraction from siðtÞ. According to eq. (2), an echo from a scattering source is plotted as an ellipse of which the focal points are Tand Ri. In Fig. 3, ellipse with solid line means
intensity plot of asiðtÞ. Applying eq. (2) to allsiðtÞ(i=1, 2, 3,+,n), conclusive summation is given
UðX; ZÞ ¼Xn
i¼1
UiðX; ZÞ: ð3Þ
According to eq. (3), all signals are plotted and each ellipse is crossed at a point of scattering source. In Fig. 3, ellipse with dotted line means intensity plot of s1ðtÞ and dashed line shows intensity plot of snðtÞ. Signal intensity of mesh is strengthened at the intersection and weakened at other area. So, the localized signal shows the location and the size of defect.
Here, right-hand side of eq. (3) is equal to the phase matching summation where, according to each delay time¸i,
signals siðtÞ are shifted and summed at each XZ position. Using variable transformation, t¼tiþ¸ and dt¼d¸, and
considering the integral range, eq. (2) is transformed to
UiðX; ZÞ ¼
Zt
0
Sið¸þtiÞd¸ ð4Þ
Substituting eq. (4) into the eq. (3)
UðX; ZÞ ¼
Zt
0
Xn
i¼1
Sið¸þtiÞd¸ ð5Þ
is obtained. SAFT result atxzplane given by eq. (3) or (5) is named B-Scope. By obtaining B-Scope along y-axis on the welding groove, welded area is three-dimensionally visual-ized. SAFT ofyz region is named D-Scope.
2.3 Inspection arrangement at welding in-process
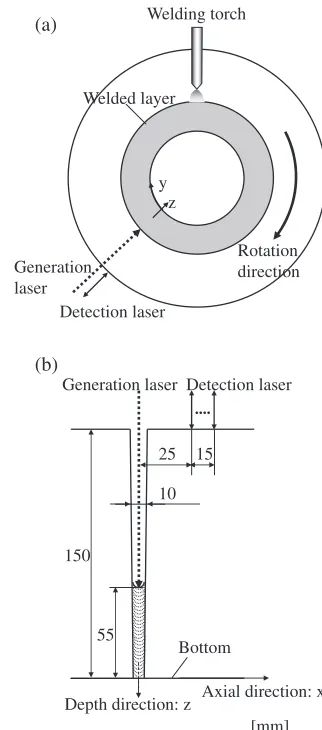
Figure 4 means inspection arrangement at welding in-process. Here, welding target was thick walled pipes and two pipes were welded by butt welding. Material of the pipes was CrMoV steel and the thickness was 150 mm. Figure 4(a) shows a cross-section image of the welded area at the original point of axial direction of pipes. Figure 4(b) is a cross-sectional diagram of the welded area at the original point of circumferential direction and shows an arrangement of inspection. Figures 4(a) and 4(b) mean midstream of the butt welding. The groove was U-shaped narrow and the gap was narrower than 10 mm. To conduct welding, the torch position wasfixed and the pipes were rotated. The temperature of the target was above 300 degrees C. so the applied wave velocity (5750 m/s) was measured using well-known bottom echo propagation time. Here, the original position of y was the welding start point. Generation and detection laser were located about y=240 degrees. Scanning the detection laser along the axial direction, B-Scope image was obtained. Here horizontal axis, x, represents the axial direction and the vertical axis,z, was the depth direction. In a D-Scope image, horizontal axis, y, is in the circumferential direction and vertical axis, z, the depth direction. Generation laser was irradiated at the surface of bead and detection laser was
scanned fromx=25 mm tox=40 mm at 0.1 mm pitch. The number of the detection points was 150 and all waveforms obtained were used for SAFT processing.
3. Experimental Results
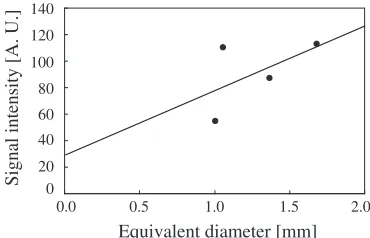
Using above condition, LUT was conducted at welding in-process. To confirm a detectability of this system, welding condition was inappropriately selected. Figure 5 shows testing result of the defect which was located at the deepest area of all detected defects. Figure 5(a) is D-Scope; Fig. 5(b) is B-Scope. Significant echo was observed at 106 mm in depth; 170 degree. At this time, bead surface was about 95 mm in depth, so it means that defect was detected at 11 mm below from the welding surface. Intensity analysis showed obvious echo from the defect. Figure 5 shows a relationship between the equivalent diameter and the signal intensity of LUT. The black marks represent measured echo value and the line is approximated sensitivity. Comparing defect echo intensity of Fig. 5 with sensitivity line of Fig. 6, defect size was evaluated as aboutº1.0 mm.
10
(b)
25
55 150
Bottom Generation laser Detection laser
15 ....
Axial direction: x Depth direction: z
[mm]
(a) Welding torch
Welded layer
Rotation direction Generation
laser
Detection laser z y
[image:3.595.342.503.70.435.2]4. Verification of Inspection Result
4.1 Result comparison with conventional UT
Firstly, to verify the detectability of in-process testing, the result was compared with result of conventional after-welding UT. Inspection method was TOFD which used 2 piezoelectric probes.17) The two probes were placed at the
opposite regions of target across the weld area. The probes were moved along the circumferential direction with keeping relative position. This inspection was conducted after welding so the target was fully welded and cooled to the room temperature (20 degrees C.). Figure 7 presents measurement results of D-Scope. Figure 7(a) is result of LUT at in-process testing and Fig. 7(b) is result of conven-tional UT after welding. Obvious echo was observed in each result and the locations of the defect so measured were almost the same. Especially in TOFD result, locus curve was clearly observed. As a result of signal intensity analysis, estimated equivalent diameter was º1.0 mm at in-process testing and º1.1 mm at after welding testing, respectively.
4.2 Result comparison with cross-sectional observation
Secondly, verification of in-process testing was conducted by comparison with cross-sectional macroscopic observation of the welded area. The welded target was cut at 175 degrees of circumferential direction. After cutting, the specimen was polished and etched. Photos of the specimen are shown in Fig. 8. Figure 8(a) is the overall view and Fig. 8(b) is a detailed view of the specimen. The horizontal axis means
155
205
105
115
95
85
180
Bead surface
Depth direction: z [mm]
Circumferential direction:
y [deg]
Defect
105
115
95
85
Depth direction: z [mm]
Axial direction:
x [mm]
-20
0
20
[image:4.595.118.479.71.249.2] [image:4.595.76.261.297.416.2]Intensity
[A.U.]
0
100
Defect
echo
Defect
Bead surface
(a) (b) (c)
Fig. 5 Measurement result of a blowhole in thick weld. (a) D-Scope image. (b) B-Scope image. (c) Intensity analysis of B-Scope image. Solid lines in eachfigure mean welding bead surface of the specimen.
0.0 0.5 1.0 1.5 2.0 20
40 60 80 100 120 140
0
Equivalent diameter [mm]
Signal in
ten
sity [A. U.]
Fig. 6 Relationship between equivalent diameter and signal intensity. The black marks represent measured echo value and the line is approximated sensitivity.
155
205
105
115
95
85
180
Bead Surface
Depth direction: z [mm]
Circumferential
direction: y [
°
]
Defect (
φ
1.0mm)
155
180
205
Circumferential
direction: y [
°
]
Defect (
φ
1.1mm)
105
115
95
85
Depth direction: z [mm]
(a) (b)
[image:4.595.132.465.584.760.2]axial direction,x, of the pipes and the vertical axis means the depth direction, z. Blowhole was observed at 105.5 mm in depth and the size was almostº1.5 mm. the observed location and size were almost the same as in-process and after welding testing.
The actual blowhole size was slightly bigger than in-process measurement. The scale between the equivalent diameter and echo intensity was obtained by measurements using flat bottom holes. However, an actual defect has a spherical shape; so echo from an actual defect was highly likely to be smaller than that fromflat bottom holes, giving a possibility of underestimation.
5. Conclusions
In this paper, in-process testing technique which can drastically save a re-work cost at manufacturing process was reported. Sensitivity of LUT is inferior to conventional UT. However, this problem was improved by using SAFT processing, and an in-process testing system was developed. The system is applicable to 150 mm thickness welded area and over 200 degrees C. target. Using the system, ability confirmation test was conducted under the in-process condition and º1.5 mm blowhole which was smaller than original criteria (º1.6 mm) was successfully detected.
This technique is applicable to general purpose of manufacturing process and can save a large amount of re-work costs. Furthermore it ultimately plays an important role at fully automated welding sequence which requires weld-test-analyze-repair cycles. In the future, improving quantita-tive defect evaluation and automated defect screening techniques, the use of this system will be more expanded.
Acknowledgement
The authors acknowledge that at writing of this paper, we were technically advised by Prof. Kazushi Yamanaka of Department of Materials Processing, Tohoku University.
REFERENCES
1) C. B. Scruby and L. E. Drain: Laser Ultrasonic: Techniques and Applications, (Adam Hilger, Bristol, 1990).
2) J.-P. Monchalin:IEEE Trans. Ultrason. Ferroelectr. Freq. Control33
(1986) 485499.
3) M. Hercher:Appl. Opt.7(1968) 951966.
4) J.-P. Monchalin:Appl. Phys. Lett.47(1985) 1416.
5) D. Levesque, M. Choquet, C. Padioleau, C. Neron, C. Corbeil, R. Talbot, A. Bendada, J.-P. Monchalin, R. V. Kolarik, II and G. V. Jeskey:
J. Acoust. Soc. Am.112(2002) 2350.
6) J.-P. Monchalinet al.:Rev. Progr. Quant. Nondestr. Eval. 22(2003) 264272.
7) M. Ochiai:J. Phys.: Conf. Ser.278(2011) 012009.
8) M. Ochiai, T. Miura and S. Yamamoto:AIP Conference Proc. 975
(2008) 231238.
9) M. Ochiai, T. Butsuen, T. Miura, H. Kuroda, S. Soramoto and S. Kanemoto:J. At. Energy Soc. Japan43(2001) 275281.
10) M. Ochiai, T. Butsuen, J. Senboshi, K. Kubo and S. Asai:Q. J. Japan Weld. Soc.17(1999) 426431.
11) M. Kinoshita, M. Ebina, M. Ohsawa, R. Hibino, H. Kadoura and K. Akihama:Trans. Japan Soc. Mech. Eng. Part C78(2012) 28242836.
12) A. Kitagawa, S. Asai and Y. Makino:J. Japan Weld. Soc.72(2003) 44 48.
13) Y. Fujita, T. Ogawa, S. Asai, S. Yamamoto, T. Ohdake and M. Ochiai:
Weld. World56(2012) 1525.
14) A. Blouin, D. Lévesque, C. Néron, D. Drolet and J.-P. Monchalin:Opt. Express2(1998) 531539.
15) M. Ochiai, D. Lévesque, R. Talbot, A. Blouin, A. Fukumoto and J.-P. Monchalin: Materials Evaluation62(2004) 450459.
16) T. Mihara, Y. Otsuka, H. Cho and K. Yamanaka:Key Eng. Mater.261 263(2004) 987992.
17) J. P. Charlesworth and J. A. G. Temple: Engineering Applications of Ultrasonic Time-of-Flight Diffraction, Second Edition, (Research Studies Press Ltd., 2001).
Depth direction: z
Blowhole
106
Axial direction: x
1.5
1.9 1.7
[mm]
Depth direction: z
Axial direction: x
(a)
(b)
[image:5.595.49.291.65.248.2]