Examination of the Tensile Deformation Resistance and Ductility of Friction Stir
Processed Al-Cu 2218 Alloy at Elevated Temperatures
Ssu-Ta Chen
*1, Truan-Sheng Lui
*2and Li-Hui Chen
Department of Materials Science and Engineering, National Cheng Kung University, Tainan 70101, Taiwan, R. O. China
Tensile properties dependence of elevated testing temperatures (100C450C) on as extruded and as friction stir processed Al-Cu 2218 alloy were investigated. The tensile deformation resistance of an as friction stir processed sample is higher than an as extruded one as increased testing temperature up to 300C and this is a consequence of natural aging effect. However, the tensile deformation resistance decreased evidently as the testing temperature raised to 400C450C, meanwhile there was a concomitant improvement of tensile ductility due to a homogeneously grain refinement which facilitated a pronounced grain boundary sliding in this temperature range.
[doi:10.2320/matertrans.M2010111]
(Received March 29, 2010; Accepted June 3, 2010; Published July 25, 2010)
Keywords: friction stir process, microstructural homogeneity, tensile ductility, grain boundary sliding
1. Introduction
The friction stir process (FSP) is an efficient method to refine microstructures to acquire a specific region i.e. stir region (SZ), which is characterized by fine and equiaxed recrystallized grains. Due to its uniqueness, many researchers had tried to clarify the microstructural features and related mechanical properties of SZ. Changes in mechanical proper-ties have usually been explained in terms of factors such as grain size,1,2)structural stability,3,4)precipitates evolution,5–7) dislocation density8) and textural anisotropy.1,9,10) Particu-larly, some references concern superplasticity related be-haviors of FSPed samples at elevated temperatures of 500C550C. Our previous investigation3)also examined the tensile ductility. However little work investigates the tensile properties in the intermediate temperature range under 450C.
Because of a high tensile deformation resistance at elevated temperatures, 2000 series aluminum alloys such as 2218 alloy are applied extensively in high temperature engineering structures.11) In some practical circumstances, these alloys will experience different exposure temperatures. Based on previous investigations, the refined dynamic recrystallized equiaxed grains in the SZ always accompanies a large proportion of high angle boundaries, which may unstable at elevated temperatures. This is related to a significant abnormal grain growth.12) Consequently, it is instructive to explore microstructural stability and corre-sponding tensile properties of the SZ at intermediate temper-atures. This study aims at characterizing the tensile defor-mation resistance and ductility of friction stir processed 2218 alloy in the temperature range from 100 to 450C.
2. Experimental Procedures
3 mm thick as extruded Al-Cu 2218 plates were selected as material for the purpose to obtain a clear extrusion texture, designated as AE, with a chemical composition as listed in
Table 1. The plates were cut and machined, and were longitudinally subjected to friction stir process (FSP), the as FSPed samples were abbreviated as AF. FSP was operated at 1850 rpm rotation speed, feed rate of 110 mm/min with a downward pressure of 50 MPa, and the tilted angle was 1. The stirring pin was 2.4 mm in diameter and 2.5 mm in length.
The microhardness profile of the SZ was measured through the cross-section which was normal to the process direction (PD) at a depth of 1 mm from the top surface with a 0.98 N load for 10 s. To explore the tensile properties of the AE and the SZ of the AF specimens at elevated temperatures, tensile specimens were tested at 100C, 200C, 300C, 400C and 450C, respectively. For simplicity, these tensile specimens are abbreviated as AE100, AE200, AE300, AE400, AE450, AF100, AF200, AF300, AF400, and AF450, respectively. The initial strain rate was 2:1103S1. The tensile
specimens were prepared in a sheet shape and the tensile gauge was obtained entirely from the SZ. The dimensions were 8mm2:4mm1:5mm (lengthwidth thick-ness). The test direction was along the extrusion direction for AE, and PD for AF. Tensile properties were collected from at least three test results. The uniaxial tensile results were presented as true stress () and true plastic strain (") (¼s ð1þeÞ,"¼lnð1þeÞin which, s is the engineering stress and e is the engineering strain).
The microstructure of the AE and the SZ regions of AF and were performed through the cross-section which was normal to the extrusion direction (or PD) using OM, SEM, TEM. Optical microscopy was employed to examine the grain structure and grain size before and after FSP. The samples for optical observation were etched in Keller’s reagent for 10 s. The TEM specimens were sliced, and ground to 0.2 mm thickness, then punched into a disc shape with diameter 3 mm. A twin jet electropolisher was applied to produce a thin-foil in the punched discs. The thin-foil was
electro-Table 1 Chemical composition of 2218 alloy (mass%).
Cu Si Ni Mg Mn Zn Al
3.76 1.25 1.25 1.08 0.5 0.23 Bal.
*1Graduate Student, National Cheng Kung University *2Corresponding author, E-mail: z7408020@email.ncku.edu.tw
[image:1.595.305.550.315.342.2]polished with a solution of 20 pct HClO4 + 80 pct ethanol at
20C with an applied voltage at 15 V. The evolution of substructures was examined carefully by JEOL 3010AEM at 200 kV acceleration voltage. We employed a PHILIPS XL-40 FEG and a JEOL 7000 scanning electron microscopy to observe the fractographies and topographies of the tensile specimens which were tested at elevated temperatures.
3. Experimental Results
3.1 Effect of FSP on microstructural feature and micro-hardness profile
Figures 1(a) and (b) show a significant difference in microstructures between the as extruded (AE) and as FSPed (AF) samples. The former reveals a coexistence of coarse incipient grains and fine recrystallized grains, while the later possesses substantially and comparatively homogeneous equiaxed recrystallized grains (<4mm). This agrees with that a conspicuously heterogeneous extrusion feature of AE can be homogenized efficiently by FSP.
We can observe a lot of second phase particles in 2218 alloy and those were identified as Al7Cu4Ni and Si particles
by an energy dispersive spectrometers analysis. It’s worth noting that these particles were not fragmented significantly by FSP. Detailed observations of the AE and SZ regions of AF are presented in Figs. 2(a) and (b), in which the lower dislocation density of AF is a consequence of the dynamic recrystallization related phenomenon.
A typical cross-sectional hardness profile of the AF specimen is shown in Fig. 1(c), in which the peak value of HV gets as high as105110HV near the center of the SZ. We should pay attention to the non-uniform distribution of microhardness within SZ,i.e.there is a higher microhardness
within SZ close to AS rather than RS. However, a discernable difference in hardness between the SZ region and thermal mechanical affected zone (TMAZ) can be recognized.
3.2 Dependence of tensile deformation resistance and ductility at temperatures from 100C to 300C Typical tensile flow curves which are coordinated with modified true plastic strain vs. true stress are shown in Fig. 3. Comparing Figs. 3(a) with (b), we find that the AE and AF samples exhibit little differences in their tensile flow curve features. The variation of tensile data along with testing temperature of the AE and AF samples are illustrated in Fig. 4, which demonstrate that the AF samples are charac-terized by a significantly higher tensile deformation resist-ance and possess higher work hardening exponents even raised the testing temperature up to 300C, as indicated in Figs. 5(a)(c).
With regard to the tensile ductility given in Fig. 4(b), though FSP is a well known process to improve ductility and is often utilized to homogenize the heterogeneous micro-structures. In the present study, it should be noted that the tensile elongation of the AF samples can be recognized as being almost identical with the AE samples. However, an improvement in tensile ductility at elevated temperatures up to 300C can not be achieved even though the refining and homogenizing of microstructures. According to the hardness profile as shown in Fig. 1, we may infer that the correlation between the inhibitions of enhanced ductility of the AF samples to the inhomogeneous microhardness distribution in the SZ region is related to the difference in friction heat input and the subsequent natural aging.
3.3 Effect of test temperature on tensile deformation resistance and ductility at 400C and 450C The stress-strain behaviors of both specimens are plotted as a function of tensile temperature in Figs. 3(c) and (d). The difference in strain hardening behavior as a function of tensile temperature during tensile deformation is generally attributed to concurrent microstructural features. In Figs. 3(c) and (d), serrated flow curves as well as variations in the tensile flow stress between AE and AF samples can be easily recognized. Considering the tensile deformation resistance at 400C and 450C as shown in Fig. 4(a), AF specimens exhibit lower tensile flow stress than that of AE, Fig. 1 Optical observations of (a) AE, (b) SZ of AF (the extrusion/process
direction is normal to paper). Cross-sectional hardness profiles after different post-heat treatments are depicted in (c).
[image:2.595.49.284.69.336.2] [image:2.595.306.547.74.226.2]and the refined grains or the natural aging provides little contribution to tensile deformation resistance. Meanwhile, the AF material shows a significant higher tensile ductility than AE material as shown in Fig. 4(b). Figures 5(d) and (e) depict that AF400 and AF450 possess apparently higher strain hardening exponents than AE400 and AE450.
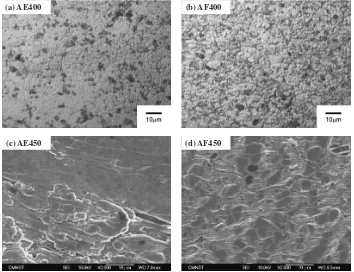
Figures 6(a)(d) exhibit the topographies observed from the subsurface of tensile tested specimens demonstrate that the area fraction of fine dynamic recrystallized grains, in particular those grains appear in an equiaxed manner plays an important role on abovementioned tensile deformation
resistance and ductility. The grain morphologies observed in Fig. 6(d) are similar to the grain boundary sliding (GBS) related behaviors as observed by Z. Y. Maet al.13)When the tensile specimens were tested below (or at) 200C, fractog-raphies of the specimens present mainly a typical dimple pattern though little difference between AE and AF can be distinguished, as shown in Figs. 7(a) and (b). It should be noted that only AF specimens exhibit intergranular fracture patterns as increased the testing temperature from 300 to 450C. Comparing the fractographies of AE400 with that of AF400, as shown in Figs. 7(e) and (f), the latter possesses much more intergranular fracture feature than the former. Moreover, it is clear that AF450 also shows a pronounced ductile intergranular fractural characteristic, as demonstrated in Fig. 7(h).
4. Discussion
From Fig. 1(a), an apparent bimodal grain size distribution is apparent due to the coexistence of incipient coarse and fine recrystallized grains in the as extruded (AE) specimen. By contrast, the microstructure of the as friction stir processed (AF) specimen reveals substantial grain refinement and microstructural homogenization. Figure 1(b) shows a homo-geneous microstructure which has resulted from severe plastic deformation and dynamic recrystallization (DRX) of FSP. A large increase in the microhardness in the vicinity of SZ central region is a common phenomenon in the as friction stir processed material when the material being given no post-heat treatment. The rotating pin and shoulder causes local changes of microstructures due to the different introduced friction heat input and the subsequent effects of natural aging.
(a) (b)
(c) (d)
Fig. 3 Modified tensile flow curves coordinated with true plastic strainvs.true stress at elevated temperatures. (a) AE and (b) AF. The characteristics of serrated tensile flow curves of AE and AF as tested at 400C and 450C are shown in (c) and (d), respectively.
(a) (b)
[image:3.595.135.462.75.342.2] [image:3.595.54.284.397.602.2](a) (b)
(c)
(e)
(d)
Fig. 5 Strain hardening exponents are plotted as a function of true plastic strain at intermediate temperatures from 100C to 450C, respectively. The testing temperature is (a) 100C, (b) 200C, (c) 300C, (d) 400C, and (e) 450C.
(a) AE400
(c) AE450 (d) AF450
(b) AF400
[image:4.595.134.460.73.433.2] [image:4.595.121.475.486.758.2]Several reports have examined the stability of AF material,4,14,15) and not an apparent AGG (abnormal grain growth, AGG) can be observed from AF specimens in the present study. AGG prefers to take place under conditions either slower rotation speeds or faster travelling speeds. And this is a consequence of a higher stored energy which facilitates AGG to occur more easily. At a rotation speed of 1850 rpm, AF materials possessed an obvious AGG under other higher travelling speeds. However, the slower travel-ling speed adopted in this study (110 mm/min) produced a higher heat input and a concurrent insufficient stored energy
which suppresses AGG at 400C and 450C, respectively. Moreover, AF materials were given a static annealing at 300C for 10 h or 450C for 0.5 h, respectively. After being given this annealing treatment, the microstructure of the AF sample remained stable and its superior hardness was replaced by a uniform distribution one, as seen in Fig. 1(c). Consequently, we can conclude that natural aging is the dominant factor responsible for the superior hardness in the SZ region of the AF sample.
J.-Q. Su et al.16) had examined the microstructural evolution during FSP. They report that the resultant
micro-(e) AE400 (c) AE300 (a) AE200
(f) AF400
(h) AF450 (b) AF200
(d) AF300
(g) AE450
[image:5.595.122.478.82.604.2]structure of FSPed 7050 aluminum alloy exhibits a complex process of microstructural evolution. Their observations showed that the region close to the pin location had undergone severe plastic deformation due to the friction heat input and a subsequence thermal-mechanical deformation process behind the rotation pin during FSP. The micro-structural feature will be affected significantly by a well known recrystallization phenomenon that is active during different stages of FSP. The resultant microstructural evolution is related to metallurgical factors, such as defor-mation strain, strain rate, friction heat input and subsequent cooling rate. The microstructural features in several previous studies as well as this study confirm that the heterogeneous plastic deformation acts on the variation in microstructure formation during FSP. The grain structures have different dislocation densities according to the various degrees of dynamic recovery and different cooling rates for elevated temperature. These factors affect the subsequent micro-structure of the specimen. This is in good agreement with the microhardness profile obtained for the AF specimen as shown in Fig. 1(c). Subtle feature of the microstructure including subgrain size, dislocation densities and precipitates are found to be affected by the process career. For example, the subgrain size in the AF specimen is about 12mm, as shown in Fig. 2(b).
The relation between tensile yield stress and microhard-ness has usually been proposed as Hv;3y. The
micro-hardness profile of AF as shown in Fig. 1(c) can usually be correlated with the inhomogeneous tensile deformation, and this may be the reason which responsible for the inhibition on the enhancement of tensile ductility in a sample as tested below (or at) 300C.
The dislocation creep behavior of crystalline solids at elevated temperatures is dominated by the following metal-lurgical factors: (1) dislocation density pertaining to work hardening behavior, (2) stacking fault energy pertaining to alloying and, (3) average grain size. However, texture is not usually considered a governing factor, and there are very little data for the effect of textural factors on tensile deformation behavior as tested at 450C. Even though, the understanding is meaningful to industrial considerations.
The difference in strain hardening exponents as tensile tests were conducted at 400C and 450C can be easily seen in Figs. 5(d) and (e). It is interesting to compare the dependence of true plastic strain on n values between the AE and AF specimens in the high tensile strain stage. The AF specimens have significantly higher n values in spite of the grain size being much finer than that of the AE specimens. In addition, it should be noted that there is no apparent difference in the work hardening behaviors in the initial strain stage between AE and AF, while the n values (Fig. 5) present different evolutions with increasing tensile strain. AE’s n values decrease with increasing tensile strain, while AF maintains higher n values even under a large tensile strain. As seen in the schematic diagram plotted in Fig. 8, the factors responsible for tensile behavior at high tensile temperatures are the microstructural homogeneity and refined grains which result in grain boundary sliding (GBS). Consequently, the microstructural homogeneity and uniformly distributed fine grains of AF materials are beneficial to achieving higher
strain hardening exponents and higher tensile ductility at 400C and 450C.
Whether an inhomogeneous tensile deformation is devel-oped or not depends on the work hardening rate. According to Argon,17) a lower work hardening rate will rapidly lead to instability and the tensile flow stress reaches a maximum followed by a localization of deformation necking. When tensile tests are conducted at 450C, we find a good agreement with the experimental results as indicated in Fig. 3(d). The variation in work hardening related behavior as a function of true plastic strain is illustrated in Fig. 5. It clarifies the influence of FSP on the strain hardening exponent, especially above (or at) 400C. Serrated tensile flow curves in Figs. 3(c) and (d) as well as the fined equiaxed grains observed in Fig. 6 when the specimens were tested at 400C and 450C are indicative of the occurrence of tensile deformation induced DRX in both the AE and AF specimens in this temperature range.
As the schematic diagram in Fig. 8 shows, an ascending tensile flow stress at elevated temperatures can be regarded as the difference in the initial microstructural morphologies before tensile strain. In particular, a combination of lower tensile flow stress and higher n values of AF400 and AF450 samples can be recognized as the cause of a larger tensile elongation. In addition, the factors responsible for the work hardening behaviors of AF400 and AF450 are the micro-structural homogenization and the appearance of GBS. In the AE specimen, the evidence of GBS is not as pronounced as that of AF due to the incipient coarse grains. Figure 8 shows that the softening of AF is ascribed to GBS in contrast to the natural aging assisted superior tensile deformation resistance when conducted below (or at) 300C.
5. Conclusions
(1) A remarkable increase in microhardness can be recog-nized in the vicinity of SZ center that is inevitable for the as stirred sample. The rotating tool produces change in microstructures due to the different introduced frictional heat input and subsequent natural aging assisted effect. It is reasonable to suggest this inhibits the enhancement of tensile ductility for friction stir processed samples below 300C.
[image:6.595.323.528.71.226.2](2) The microstructural homogeneity and grain refinement can be acquired by friction stir process which is beneficial to achieve higher tensile ductility at 400C and 450C due to higher strain hardening exponents and significant occurrence of grain boundary sliding.
Acknowledgement
The authors gratefully acknowledge the financial support by the National Science Council of Taiwan (Contract No. NSC 96-2221-E-006-104) and NCKU project of promot-ing Academic Excellence & Developpromot-ing World Class Research Centers: D96-2700 for this study.
REFERENCES
1) K. T. Huang, T. S. Lui and L. H. Chen: Mater. Trans.47(2006) 2405– 2412.
2) Y. S. Sato, M. Urata, H. Kokawa and K. Ikeda: Mater. Sci. Eng. A354
(2003) 298–305.
3) S. T. Chen, T. S. Lui and L. H. Chen: Mater. Trans.48(2007) 510–514. 4) I. Charit and R. S. Mishra: Scr. Mater.58(2008) 367–371.
5) Y. S. Sato, H. Kokawa, M. Enomoto, S. Jogan and T. Hashimoto: Metall. Mater. Trans. A30A(1999) 3125–3130.
6) L. E. Murr, G. Liu and J. C. McClure: J. Mater. Sci.33(1998) 1243– 1251.
7) Y. S. Sato and H. Kokawa: Metall. Mater. Trans. A32A(2001) 3023– 3031.
8) Y. J. Kwon, I. Shigematsu and N. Saito: Mater. Trans.45(2004) 2304– 2311.
9) S. T. Chen, T. S. Lui and L. H. Chen: Mater. Trans.50(2009) 1941– 1948.
10) H. W. Lee, T. S. Lui and L. H. Chen: J. Alloy. Compd.475(2009) 139– 144.
11) N. C. Kothari: Proc. Int. Symp. on Ligh Materials for Transportation Systems, Kyongju, Korea, 20-23 June (1993).
12) Kh. A. A. Hassan, A. F. Norman, D. A. Price and P. B. Prangnell: Acta Mater.51(2003) 1923–1936.
13) Z. Y. Ma, R. S. Mishra and M. W. Mahoney: Acta Mater.50(2002) 4419–4430.
14) T. Shibayanagi, M. Maedq and M. Naka: J. JILM56(2006) 347–353. 15) R. S. Mishra, R. K. Islamgaliev, T. W. Nelson, Y. Hovansky and M. W. Mahoney:Friction Stir Welding and Processing, Indianapolis, USA, 4-8 Nov. (2001).
16) J.-Q. Su, T. W. Nelson, R. S. Mishra and M. W. Mahoney: Acta Mater.
51(2003) 713–729.