Stress-Enhanced Transformations from Hypothetical B2 to Stable L1
0and
Amorphous to fcc Phases in Fe
50Ni
50Binary Alloy by Molecular Dynamic
Simulations
A. Takeuchi, K. Takenaka, Y. Zhang, Y.C. Wang and A. Makino
Institute for Materials Research, Tohoku University, Sendai 980–8577, Japan
Molecular dynamics (MD) simulations were performed for an Fe50Ni50 (at.%) alloy with NTp ensemble to keep the number of atoms (N), temperature (T = 673 K), and pressure (p ∼ 101.325 kPa) constant under a GrujicicZhou-type MD potential from an Embedded Atom Method scheme with a cut-off distance of 1 nm. An Fe50Ni50 alloy was initially created as a hypothetical chemically-ordered B2 structure with a 12 × 12 × 12 supercell comprising 3456 atoms. Subsequently, it was annealed at 673 K, without the application of stress, and then under a uniaxial tension of ∼290 MPa, and shear stresses of ∼570 and ∼2940 MPa. The results revealed that stress contributed to a change in the transformation scheme to the L10 phase from partially to fully of the system with a reduction of time. On the other hand, an as-quenched amorphous phase under a shear stress of ∼680 MPa, transformed to a disordered fcc-derivative phase. Therefore it is clear that stresses in MD simulations play a crucial role in enhancing the atomic motion during a transformation. [doi:10.2320/matertrans.M2016162]
(Received May 10, 2016; Accepted January 23, 2017; Published February 24, 2017)
Keywords: iron-nickel alloy, molecular dynamics simulation, martensitic transformation, chemical ordering, amorphous alloy, crystallization, phase stability
1. Introduction
This work presents the successful synthesis of L10-FeNi
phase1) through crystallization of amorphous
Fe42Ni41.3Si8B4P4Cu0.7 alloy at 673 K for 288 h, after
vitrify-ing the molten alloy by melt spinnvitrify-ing. Significantly, the L10
phase formed into a ribbon shaped sample and had chemical ordering of 0.8 or more1). However, its volume fraction was at
most ∼10% because of the presence of other Fe- and Ni-rich phases. On reducing the multicomponent alloy to a binary Fe50Ni50 (at.%) alloy, the authors were able to evaluate the
stability of the liquid, bcc, fcc and L10 phases, by maintaining
these phases at a constant crystallization temperature of 673 K using molecular dynamics (MD) simulations1).
How-ever, the actual kinetics of formation of the L10 phase from
the amorphous phase have not been clarified yet, even for this simple alloy, using computational approaches because of problems associated with two important factors: structural and chemical order. Thus, one should select the MD potential appropriately, to deal with these two orders simultaneously, when trying to reproduce the transformations from the amor-phous to the L10 phase. However, it is difficult to reproduce
the chemical order using conventional MD potentials unless these potentials are fine tuned to the alloy system of interest and their ordered phase. Hence, in the current investigation, the authors have attempted to treat the structural and chemical orders separately, even though in reality, they take place si-multaneously during the formation of the L10-FeNi phase
from the amorphous phase, as described in the two cases be-low.
In the first case, the authors demonstrate the formation of the L10 phase from a hypothetical B2 phase in the Fe-Ni
sys-tem. This idea originated by observing the crystallographic relationships between fcc and bct (body-centered tetragonal) structures during a martensitic transformation induced by mechanical stresses2,3). For instance, Cao et al.2) studied
stress-induced martensitic transformation in NiAl from B2
structure, Grujicic and Dang3) investigated Fe-Ni alloys with
Ni content ranging from 20 to 40 at.% and their transforma-tion from fcc to bcc. Furthermore, Staroskenkov et al.4)
re-ported on the CuAu I (L10) structure during low temperature
deformation. In addition, the phase stability of the Fe-Ni sys-tem including the L10 phase, has also been investigated in
great detail by Mishin et al.5) using first-principles
calcula-tions and atomistic simulacalcula-tions.
In the second case, the authors have investigated the tallization process of the amorphous phase, although the crys-tallized phase is expected to be a simple, disordered fcc phase, even for MD systems of larger dimensions. While simulating case 2, stress was applied to the amorphous phase to investi-gate the following.
1. The effect of stress on the crystallization kinetics.
2. The appearance of bcc phase as an intermediate metastable phase during the crystallization process.
Previous study1) suggested that, an intermediate metastable
bcc phase would appear at the crystallization temperature (T = 673 K), because Gibbs free energy (G) of phases fol-lowed the hierarchy1) in the order of G
amor > Gbcc (∼ GB2) >
Gfcc > GL10 where Gbcc is regarded to be considerably close to
GB2. If one could detect the bcc phase during the
crystalliza-tion process, then one would expect a kinetic route, which would yield the L10 phase, to be present. In reality, these
ap-proaches, based on cases 1 and 2, do not correlate directly to the experimentally observed transformation from amorphous to L10 phase. However, the authors believe that these
funda-mental concepts are worth investigating for the subsequent future, when appropriate MD potentials have been deter-mined, which would enable the study of the structural and chemical order simultaneously.
The present study aims to examine the formation of the L10
phase from the hypothetical B2 structure of the Fe50Ni50 alloy
and to investigate the crystallization process through MD simulations with and without the application of stress.
2. Methods and Models
Data derived from previous MD simulations on the stabili-ty of phases in the Fe-Ni system5), including the L1
0 phase
and the martensitic transformation3), were taken into account
in order to advance the present simulations. The present MD simulations were performed using commercial software, SCIGRESS ME Version 26) (Fujitsu Production), for the
al-loys summarized in Table 1.
Alloy 1 was a marginal L10 alloy of 4000 atoms with 10 ×
10 × 10 supercells. The initial lattice constants of supercells (aS and cS) were acquired from the experimental data1) (aU =
0.3560 nm and cU = 0.3615 nm) obtained by performing
X-ray diffraction (XRD) on the sample annealed at 673 K for 288 h, where, superscripts S and U stand for lattice constants of supercell and unit cell, respectively.
Alloy 2 was also a marginal alloy, created hypothetically with a chemically-ordered B2 structure, with an initial state comprising 12 × 12 × 12 supercells (3456 atoms) and a den-sity of 8.367 Mg/m3 (lattice constant of supercell: aS =
3.39 nm). The value, 8.367 Mg/m3, was estimated with an
in-house program that used the densities and atomic weights of pure Fe (7.87 Mg/m3, and 55.845 g/mol) and Ni
(8.902 Mg/m3, and 58.6934 g/mol). Specifically, the authors
assumed that 1 mol of Fe50Ni50 alloy consisted of equal
amounts of Fe and Ni in terms of volume and weight, while calculating the density of the Fe50Ni50 alloy.
On the other hand, Alloy 3-t was created from a hypotheti-cal B2 phase similar to Alloy 2 and simulated at 1 ps under uniaxial tension of ∼290 MPa, which was applied to the z-ax-is to examine the transformation into the L10 structure. In
ad-dition, Alloy 3-s was simulated to examine the effect of shear-ing on the formation of the L10 structure. Shear stresses of
∼570 and ∼2940 MPa were applied. The maximum stress that the alloy system would tolerate, i.e., not break or fracture but deform under simulation, was found to be 290 MPa (uni-axial tension), and 570 and 2940 MPa (shear stress). Similar-ly, the simulation time (tcomputed/ps) was determined by
mon-itoring the thermodynamic and physical variables, such as Hamiltonian and lattice constants. The values of tcomputed
pre-sented in Table 1 denote the minimum time required for MD simulations to satisfy the transformation for each alloy. These stresses, ranging from 290 to 2940 MPa, were as large as the ideal fracture strength and larger than the actual crystalline alloy containing lattice defects and grain boundaries. Howev-er, these large stresses were used as the relative ones for MD simulations by permitting that the atomic arrangements of the crystalline phases in MD is the ideal ones without defects, such as whiskers. Further simulations on Alloy 3-t and Alloy 3-s were performed without applying uniaxial tension and shear stresses to the atomic configurations of Alloy 3-t and Alloy 3-s, at t = 50 ps and named Alloy 3-t-non and Alloy 3-s-non, respectively.
Moreover, the relaxed amorphous phase (Alloy 4) was cre-ated from the chemically-disordered fcc structure comprising of 4000 atoms with 10 × 10 × 10 supercell by quenching a melt by cooling from 2000 to 500 K for 150 ps (1 × 10¹³ K/s),
followed by the subsequent structural relaxation at 500 K for 50 ps after quenching. The melting of the alloy occurred at 2000 K for 50 ps. The initial phase of Alloy 4 was fcc phase, as it is the stable phase in Fe-Ni binary phase diagram at tem-peratures ranging from 673 K to solidus temperature.
Alloy 5-s was simulated from Alloy 4 (t = 250 ps) by ap-plying shear stress of ∼680 MPa for 200 ps. The results of the application of shear stress alone are shown in this paper, since the authors found out that shear stress was more efficient in quickly inducing the transformation when compared to ten-sile/compression stress.
[image:2.595.47.549.567.789.2]In addition, the effects of unloading stress were investigat-ed to the amorphous structure as Alloy 5-non from the state of Alloy 4 at t = 250 ps and as Alloy 5-s-non from Alloy 5-s at t = 50 ps. The presence of an initial B2 structures in Alloys 1, 2 and 3 is a hypothetical condition, since both the B2 phase and the bcc phase do not appear in the Fe-Ni equilibrium phase diagram. Furthermore, tensile and shear stresses were also applied hypothetically, since the mechanical tests were
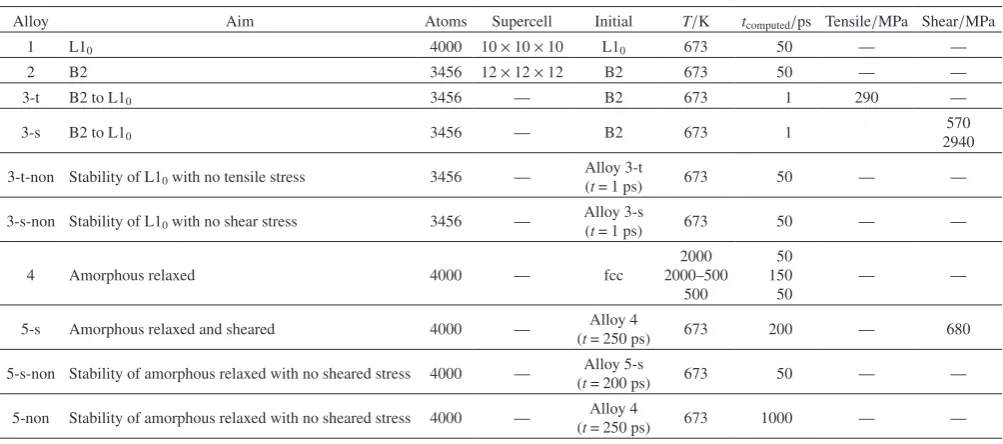
Table 1 Alloys, aim, the number of atoms, corresponding supercell, initial state and simulation conditions (temperature, time, tensile or sheared stress).
Alloy Aim Atoms Supercell Initial T/K tcomputed/ps Tensile/MPa Shear/MPa
1 L10 4000 10 × 10 × 10 L10 673 50 ̶ ̶
2 B2 3456 12 × 12 × 12 B2 673 50 ̶ ̶
3-t B2 to L10 3456 ̶ B2 673 1 290 ̶
3-s B2 to L10 3456 ̶ B2 673 1 2940570
3-t-non Stability of L10 with no tensile stress 3456 ̶ Alloy 3-t(t = 1 ps) 673 50 ̶ ̶
3-s-non Stability of L10 with no shear stress 3456 ̶ Alloy 3-s(t = 1 ps) 673 50 ̶ ̶
4 Amorphous relaxed 4000 ̶ fcc
2000 2000–500
500
50 150
50 ̶ ̶
5-s Amorphous relaxed and sheared 4000 ̶ (t = 250 ps)Alloy 4 673 200 ̶ 680
5-s-non Stability of amorphous relaxed with no sheared stress 4000 ̶ (t = 200 ps)Alloy 5-s 673 50 ̶ ̶
not performed in the authors previous experiments1).
Howev-er, preliminary MD simulations revealed that shear stress, in particular, enhanced the crystallization of the amorphous phase.
Control algorithms for temperature scaling and time inte-gration were implemented using Gear s method. The common simulation conditions of the NTp ensemble included main-taining the number of atoms (N), temperature (T), and sure (p) constant. Pressure (p) was set to atmospheric pres-sure (101.325 kPa). In order to determine the optimal time step (Δt), that would enable rapid simulation and avoid over-shooting, a range of values from 0.1 to 5 fs were tested initial-ly. As a result, Δt was set at 5 fs, which statistically does not affect the thermodynamic and physical quantities in the sim-ulation. Simulations were performed with the Grujicic Zhou - (GZ)-type7,8) MD potential using an embedded atom method
(EAM)9), a cut-off distance of 1 nm and periodic boundary
conditions. The details of the MD potentials and the scheme to apply stresses are summarized in Appendices A and B, re-spectively. The terminologies are summarized in Appendix C.
3. Results
3.1 Alloy 1
Simulations revealed that the lattice constants of the initial state supercell (aS, cS) being aS = 3.560 nm and cS = 3.615 nm
(cS/aS = 1.015)1) varied at t = 50 ps to be aS = 3.605 nm and
cS = 3.573 nm (cS/aS = 0.991, aS/cS = 1.009). In addition, the
density (ρ) varied from 8.367 to 8.184 Mg/m3. At first glance,
these results indicate that the L10 phase is stable at T = 673 K
with a limited simulation time of 50 ps, although cS/aS =
0.991 differs from the experimental data (cS/aS = 1.015).
Pre-sumably, this difference in the value between calculated and experimental cS/aS, could be due to the characteristic
GZ-type MD potential that had different optimized atomic dis-tances between Fe and Ni in the z-direction. Though, this discrepancy has not been amended by the authors in the cur-rent study, the authors aim to modify the parameters of GZ- potential in future studies.
3.2 Alloy 2
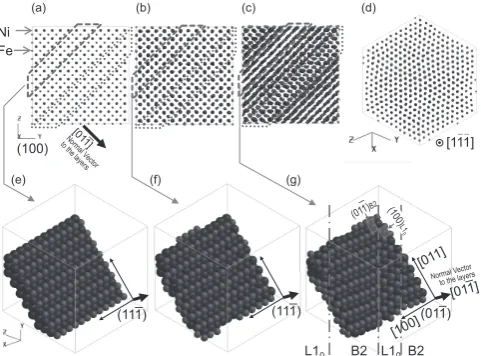
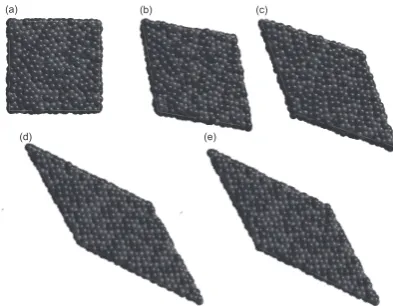
The structure of Alloy 2 retained the B2 structure in Figs. 1(a), (b), but eventually, it became a mixed structure de-noted by the trapezoid areas with broken and dotted lines in Fig. 1(c), where each area contained three layers. However, the mixed structure shown in Fig. 1(c) could not be confirmed in Fig. 1(d) from the direction [1¯1¯1] on (¯111) projection. The appearance of different atomic arrangements between Figs. 1(c) and Fig. 1(d), suggests the occurrence of atomic sliding along [1¯1¯1] due to a deformation that is characteristic of the bcc-derivative structure, including B2. This suggestion was confirmed by depicting the atomic arrangements of the 3 layers with broken lines in Figs. 1(e), (f), (g) for t = 0, 1 and 50 ps. Comparing Fig. 1(g) with Figs. 1(e), (f) revealed that Alloy 2 at t = 50 ps, shown in Fig. 1(g), is composed of B2 and L10 structures that sandwich planar defects, denoted by
dot-dash lines, which are involved in different atomic ar-rangements as demonstrated by the rectangular area of (01¯1)B2
and the square area of (100)L10. Notably, the atomic arrange-ment of the B2 structure in Fig. 1(g) slightly tilted to its
orig-inal arrangement in Figs. 1(e), (f) due to the inclusion of pla-nar defects.
The corresponding changes in parameters to Figs. 1(e), (f), (g) are summarized in Fig. 2, where, during the MD simula-tion for Alloy 2 at t = 0 ps to t = 50 ps, the supercell volume (V) remained constant at ∼40.5 nm3 as along with other
pa-rameters like kinetic energy (KE), density (D),
supercell-con-stant (aS). However, Hamiltonian H dropped from −393.7 at
t = 0 ps to −395 kJ/mol−1 for t ≥ 5.5 ps and decreases in the
internal energy (U), enthalpy (H) and potential energy (PE)
Fig. 1 (a)–(c) Perspective views from x-direction, (100)-traces, of (a) t = 0 ps, (b) t = 1 ps and (c) t = 50 ps. Trapezoid areas with broken and dotted lines, respectively, are the area or layers that exhibit considerable atomic movements in the ideal atomic sites of B2 structure. (d) Perspective views from [1¯10]-direction, (111)-traces, of (a) t = 50 ps, demonstrating the atomic movements in the ideal atomic sites of B2 structure. (e)–(g) Space-filling views from three layers extracted from the trapezoid area with broken lines of (e) t = 0 ps, (f) t = 1 ps and (g) t = 50 ps. The top surface of the third layer has a normal vector [01¯1] that has other orthogo-nal axes [011] and [100] along the atomic arrangement of the initial B2 structure. (a) t = 0 ps (100), (b) t = 1 ps (100), (c) t = 50 ps (100), (d) t = 50 ps (¯111) , (e) t = 0 ps (3 layers), (f) t = 1 ps (3 layers), (g) t = 50 ps (3 layers).
[image:3.595.307.548.212.390.2]were observed. In Fig. 2, H fluctuated with t, since H is af-fected by the pressure (p) as defined by the equation: H = U + pV. The MD simulations of Alloy 2 signify that the atomic arrangements in Alloy 2 take place due to the metastability of the B2 phase and isothermal annealing leads to B2 structure being partially transformed into L10 structure, in accordance
to the formation of planar defects.
The authors have analyzed Alloy 2, using mean-squared displacement (MSD) for total atoms, in order to study the for-mation mechanism and the role of the planar defects. Accord-ing to the user s instructions of the software (SCIGRESS, ver. 2), the length of MSD (LMSD) is defined by eqs. (1) with the
coordination (r) of an atom of interest during time interval between t and 0 (tinterval) from a set of time-series data where
M and N are the numbers of time-series data and total atoms, respectively, and tk is the starting time of the k-th time-series
data.
LMSD= |r(tinterval)−r(0)|2
= 1
NM
N
i=1
M
k=1
|ri(tk+tinterval)−ri(tk)|2
(1)
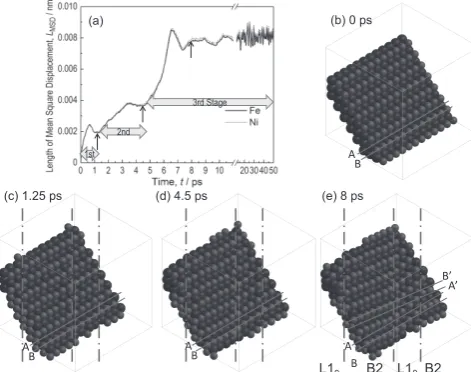
As a result, the existence of three stages was detected, as shown in Fig. 3. The first, second and third stages had their t range from 0 to 1.4, 1.4 to 4.5 and 4.5 to 50 ps, respectively. All stages exhibited an increase in LMSD in the beginning,
fol-lowed by overshooting and a subsequent flat region. The anal-ysis of the atomic arrangements in Fig. 3 indicates that Figs. 3(b)–(d) retain their B2 phase along with the planar de-fects as shown in Fig. 3(d). However, Fig. 3(e) apparently contained L10 phase due to the drastic increase in LMSD as
shown in Fig. 3(a). Specifically, the first small LMSD seen in
the 1st stage, was due to the rearrangement of the atomic structure at 673 K, whereas the second small LMSD seen in the
2nd stage, was mainly due to the formation of planar defects.
Ultimately, the third large LMSD seen in the 3rd stage, causes
the formation of L10 phase at t > 5.5 ps, which is reflected by
the drop in the value of H and U as shown in Fig. 2.
3.3 Alloy 3 series
The calculations for Alloy 3-t revealed that the structure transformed from cubic to tetragonal as shown in Figs. 4(a), (b) as a result of the uniaxial tension allocated to it during simulation. Further MD simulations were performed on Alloy 3-t at t = 1 ps to investigate the properties of the alloy without the application of tensile stress (Alloy 3-t-non). Comparisons between Fig. 4(b) and Fig. 4(c) reveal that the lattice constant of the supercell along the z-axis is slightly shorter in Fig. 4(c) for Alloy 3-t-non than Fig. 4(b) for Alloy 3-t, due to the un-loaded condition in the z-direction for Alloy 3-t-non. Specifi-cally, lattice constants of the supercell changed from aS =
3.39 nm for the initial cubic B2 structure, as shown in Fig. 4(a), to aS = 3.06 nm and cS = 4.30 nm for the tetragonal
structure for Alloy 3-t-non at t = 50 ps, as shown in Fig. 4(c). Considering the relationship between the fcc and bct3), the
resultant phase of Alloy 3-t-non at t = 50 ps consists of a unit cell with lattice constants aU = 0.361 and cU = 0.358 nm and
cU/aU = 0.992 for the L1
0 phase. The details of the lattice
con-stants, along with their cosmic magnets10) are summarized in
Table 2, where experiments indicate cU/aU > 1. The value of
H for Alloy 3-t-non at t = 50 ps was evaluated to be
−397 kJmol−1, similar to that of Alloy 1 for t = 50 ps. Thus, it
was found that the L10 phase could be reproduced by
apply-Fig. 4 Space-filling views of the MD simulations results showing the changes in structures. (a) Alloy 3-t, t = 0 ps and (b) Alloy 3-t, t = 1 ps, both with L10 structure from B2 structure with the initial state deformed by tensile stresses. (c) Alloy 3-t-non, t = 50 ps with L10 structure simulated from (b) but unloaded. The lattice constants of supercell (aS and cS) vary from (a) aS = 3.39 nm to (c) aS = 3.06 nm and cS = 4.30 nm. Simply, the value of cS/aS for supercell of (b) is 1.405 ∼ √2 , which corresponds to L1
0 structure with lattice constants of unit cell (aU and cU) of aU = 0.361 nm and cU = 0.358 nm and cU/aU = 0.992 by referring to the relationship be-tween bct and fcc structures. (d) Alloy 3-s, t = 1 ps, with L10 structure from B2 structure with the initial state deformed by shear stresses. (e) Alloy 3-s-non, t = 50 ps with L10 structure simulated from (d) but unload-ed. (a) Alloy 3-t, t = 0 ps (B2), (b) Alloy 3-t, t = 1 ps (L10), (c) Alloy 3-t-non, t = 50 ps (L10), (d) Alloy 3-s, 570 MPa, t = 1 ps (L10), (e) Alloy 3-s-non, after 570 MPa unloaded, t = 50 ps (L10).
[image:4.595.49.285.516.702.2]ing uniaxial tension to B2 structure, as previously reported for Ni-Al system2). Here, it should be noted that the B2 phase
partially transforms to the L10 phase in the Ni-Al alloy
sys-tem (supercell). The partial formation of the L10 phase in
Ni-Al system2) is similar to the partial transformation under
iso-thermal annealing without stress shown in Fig. 1. Interesting-ly, complete transformation was observed for Alloys 3-s and 3-s-non systems, with shear stress of 570 MPa, as shown in Fig. 4(d), and its subsequent unloaded state as shown in Fig 4(e). These results are compared with the results obtained under shear stress of 2940 MPa later in this study.
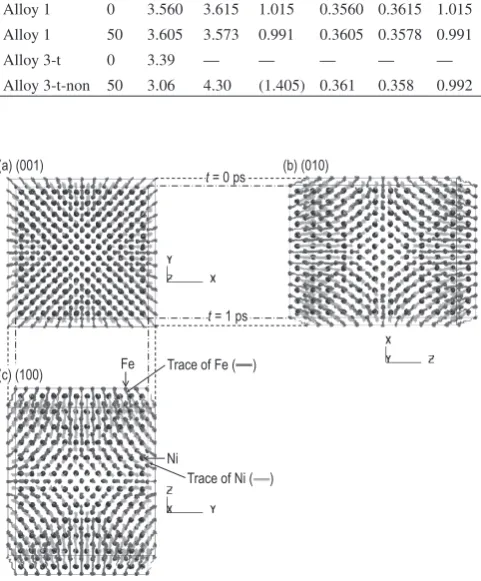
The authors analyzed Alloy 3-t for displacement of atoms during the transformation as shown in Fig. 5. The displace-ment of Ni and Fe atoms do not cross any other atoms, sug-gesting that no effective diffusion took place during the trans-formation.
When extremely high shear stress (hypothetically greater than ∼2940 MPa) was applied, the shape of the supercell transformed from cubic to triclinic, as shown in Fig. 6. How-ever, Fig. 6(b) indicates that the lattice distortion is small, but the atomic arrangements and the crystallographic symmetry clearly changes from B2 to L10 structure. Further simulation
for Alloy 3-s at t = 1 ps without the application of shear stress (Alloy 3-s-non), as shown in Fig. 6(c), revealed that no appar-ent difference in atomic arrangemappar-ents could be ascertained
from those seen in Fig. 6(b). The pair-distribution functions of Alloy 3-s-non after unloading, as shown in Figs. 6(d), (e), exhibit similar statistical behavior to those of Alloy 3-t-non, as shown in Fig. 6(f), particularly, at a distance of r < 0.5 nm. Thus, simulation results for Alloys 3-s and 3-t revealed that both tensile and shear stresses contributed to the transforma-tion from B2 to L10 structure and the transformations were
highly uniform throughout the alloy system. Figures 4 and 6 indicate that when the B2 phase was present in its initial atomic configurations and satisfactory tensile or shear stress-es were applied, there is a possibility to form the L10
struc-ture.
Further isothermal simulations were performed on Alloy 3-t at t = 1 ps in the absence of uniaxial tension (Alloy 3-t-non). The results of Alloy 3-t at t = 1 ps, in terms of atom-ic arrangements and other thermodynamatom-ic and physatom-ical quan-tities, were found to be statistically similar to the initial atom-ic configurations of Alloy 3-t at t = 1 ps. This suggested that Alloy 3-t-non was either in a stable state at T = 673 K or in a state with insufficient thermal activation for atomic diffusion. However, the authors suspect the former case to be true based on previously studies1) where, the L1
0 phase had a lower
Hamiltonian value compared to the disordered fcc phase, which is considered the practical equilibrium phase.
3.4 Alloy 4
Preliminary investigations determined the critical cooling rate (Rc) for forming an amorphous phase to be 1 × 10¹³ K/s.
We found that the alloy crystallized into an fcc phase during cooling at a rate of 1 × 10¹² K/s. Thus, the magnitude of R
c =
1 × 10¹³ K/s is as high as R
[image:5.595.47.292.423.511.2]c = 3 × 10¹⁰ K/s of pure Ni11).The Table 2 Summary of lattice constants for supercell (aS and cS) and unit cell
(aU and cU) for L1 0 phase.
t/ps aS/nm cS/nm cS/aS aU/nm cU/nm cU/aU
Experiment1) ̶ ̶ ̶ ̶ 0.3560 0.3615 1.015
Experiment10) ̶ ̶ ̶ ̶ 0.3582 0.3607 1.007
Alloy 1 0 3.560 3.615 1.015 0.3560 0.3615 1.015 Alloy 1 50 3.605 3.573 0.991 0.3605 0.3578 0.991
Alloy 3-t 0 3.39 ̶ ̶ ̶ ̶ ̶
Alloy 3-t-non 50 3.06 4.30 (1.405) 0.361 0.358 0.992
Fig. 5 Ball-and-stick views of the MD simulation results for Alloy 3-t at t = 1 ps, together with the traces of atomic displacements during the simula-tions from t = 0 ps.
[image:5.595.49.290.463.754.2] [image:5.595.305.547.471.656.2]alloy cooled at R = 1012 K/s exhibited discontinuous drops in
V and H, from t = 1120 ps to t = 1210 ps as shown in Fig. 7. This can be interpreted as crystallization. Thus, we can con-clude that Alloy 4 has barely formed an amorphous state.
3.5 Alloy 5 series
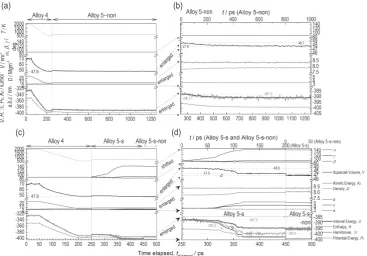
The results shown in Fig. 8 demonstrate that the initial state of an amorphous phase exists until 65 ps as shown in Figs. 8(a), (b). It begins to transform into a crystalline phase, as demonstrated in Fig. 8(c) at t = 85 ps, followed by crystal-lization at t = 200 ps, as shown in Fig. 8(d). Significantly, the crystalline state seen in Fig. 8(d) is highly consistent with the perfect crystalline state, where all the atoms are positioned correctly in the super-lattice within the limited computational time of t = 200 ps. The atomic arrangement of Alloy 5-s-non shown in Fig. 8(e) is similar to that of Alloy 5-s in Fig. 8(d). The differences seen in the Alloys 5-s at t = 65 and 85 ps are as shown in Figs. 8(c), (d). Figure 9(d) clearly show the re-gion where the changes in internal and potential energies (U and PE) drop for t = 65 and 85 ps. The changes in these
pa-rameters and quantities, for other alloys are as shown in Figs. 9. Figure 9(a) shows Alloy 4 and subsequently Alloy 5-non during the formation of the amorphous phase. Fig-ure 9(a) shows the subsequent annealing of Alloy 5-non to Alloy 4 in the absence of stress. Annealing of Alloy 4 fol-lowed by Alloy 5-s and Alloy 5-s-non are shown in in Fig. 9(d). Of the various parameter and quantities presented in Figs. 9(b) and (c), the most significant ones are the
super-cell volume (V) and H and are depicted with broken lines. As explained in Fig. 2, H in Figs. 9(b), (d) fluctuates with t due to the same reason that H in the simulation according to the equation: H = U + pV. Figure 9(d) demonstrates that initially V of Alloy 5-s is around 48.8 nm3 at the applied shear stress
∼680 MPa. However, the value of V begins to decrease mo-notonously and stabilizes again at t = 105 ps to V = 47.5 nm3.
This decrease in V suggests the crystallization of the amor-phous phase. Further decrease in V to V = 47 nm3 is observed
for Alloy 5-s-non on the right-side of Fig. 9(d) due to the re-lease of shear stress. The crystallization that took place in Alloy 5-s was also confirmed by the determining the decrease in H in Fig. 9(d) from −387.5 to −399.5 kJmol−1 (ΔH
x =
12 kJmol−1). However, it should be noted that the above
changes in V and H are seen when shear stress of 680 MPa is applied. The changes in parameters for Alloy 5-s-non are shown on the right-side of Fig. 9(d), indicating that the pa-rameters of Alloy 5-s-non are almost constant during the sim-ulation time of 50 ps, where H was evaluated to be
−395.5 kJmol−1. Thus, decrease in H from H = −387.5 kJmol−1
in Fig. 9(b) to −395.5 kJmol−1 in Fig. 9(d), ΔH
x = 8 kJmol−1,
is crystallization enthalpy of the amorphous phase for Alloy 4.
On the other hand, crystallization did not take place when shear stresses were not applied to Alloy 4 at t = 250 ps as the initial atomic arrangements were rather similar to the Alloy 5-non at t = 1000 ps, as shown in Fig. 9(b). Thus, it was found that during the same simulation time, shear stress enhanced atomic motions and reduced the crystallization time. In addi-tion, mechanical stress led to the preferential formation of the fcc derivative of L10 related structures when the initial alloy
is presented in the higher energy states, such as B2 and amor-phous phase. The values of H evaluated for B2 (Alloy 2, t = 5 ps) and L10 (Alloy 1, t = 50 ps) are −393.7 and
−397.0 kJmol−1, respectively, where, Alloy 2, t = 5 ps is the
starting state before the formation of L10 phase. The typical
stresses applied in the current study were ∼290 MPa for
ten-Fig. 7 Pair-distribution functions g(r) and space-filling atomic arrange-ments and changes in parameters for Alloy 4 quenched at a rate of 1013 K/s and an alloy at 1012 K/s. Alloy 4 formed into an amorphous phase, whereas the alloy quenched at 1012 K/s exhibited a crystalline phase.
[image:6.595.49.290.432.735.2] [image:6.595.327.524.532.685.2]sile and ∼570 and 2940 MP for shear. However, these condi-tions are not in line with the experimental condicondi-tions, where annealing was carried out isothermally, in the absence of me-chanical tests.
4. Discussion
The tetragonality of the L10 phase in Alloy 1 with cS/aS <
1 for MD simulation results against experimental data with cU/aU > 1 could be due to the presence of an optimized Fe-Ni
atomic distance in the GZ-potential7). It was reported7) that
the lattice constants (aU) are 0.364 nm for Fe and 0.3524 for
Ni. Thus, a smaller aU for Ni leads to cU/aU < 1 for L1 0 phase
with periodic accumulation of Fe and Ni layers successively in c- or z-direction. This discrepancy regarding c/a is out of the scope of the present study, and hence, the authors do not expand on this issue.
There exist other factors, excluding mechanical stress, which contribute to formation of the L10 phase, such as
geo-metrical shape of the sample and inner stress that takes place in a composite structure. Specifically, the direction along the roll-contacted and free surfaces of the ribbon samples (out-of-plane direction) should be considered as the solidification direction, which is different from in-plane geometry in a mi-cron or sub-mimi-cron scale. In addition, the nanocrystallized Fe-based alloys comprising of nanocrystalline grains embed-ded in the remaining amorphous phase can cause residual stresses due to the difference in thermal expansion coeffi-cients between the crystalline and amorphous phases12). The
other factors excluding mechanical stress mentioned above are difficult to achieve using MD simulations, but they would also affect the formation of the L10 phase experimentally to
some extent. The authors think that these factors can also be regarded as stress, although its magnitude is not as large as the mechanical stresses applied in the present study. Further MD simulations will be performed in near future.
5. Conclusions
The MD simulation results revealed that a hypothetic B2 ordered phase, annealed at 673 K for 50 ps without stress lead to the partial formation of the L10 phase due to the generation
of planar defects and resultant atomic displacements. Apply-ing shear stresses of 570 and 2940 MPa as along with tensile stress of 290 MPa to the B2 phase, contributed to accelerate the transformations from the B2 to L10 phase, accompanied
by a change in the transformation scheme. Similarly, shear stresses also enhanced crystallization, but neither the bcc nor B2 phase was detected in the simulations. It was found that stresses effectively accelerate the transformations from the hypothetical B2 to L10 phase.
Acknowledgements
This work was partially supported by the following grants: (1) Grant-in-Aid for Scientific Research on Tohoku Innova-tive Materials Technology InitiaInnova-tives for Reconstruction from the MEXT, Japan, and (2) Grant-in-Aid for Scientific Research from JSPS: grant number 24360284.
Appendix A
[image:7.595.116.484.69.325.2]EAM method is based on the electron density theory, but is widely used as a semi-empirical model that requires the knowledge of experimental material properties to evaluate the model parameters. The total energy (Etot) is given by eq. (A1)
Etot = i
Fi(ρi)+12 j i i
φi j(ri j) (A1)
where Fi(ρi) is the required energy to embed atom i into a lo-cation where the local electron density yielded by all the oth-er atoms is ρi, ϕij(rij) is the atomic core-core repulsion energy between atoms i and j separated by a distance rij. The
formu-lae for Fi(ρi) and ϕij(rij) are given as follows.
F(ρ)=
5
i=0
Aiρi (A2)
ρ=
m
n=1
ρa(rn) (A3)
ρa(r)=Nsρas(r)+(N−Ns)ρak(r) k=d,p, . . . (A4)
ρak(r)= 1
4π
i
CkiRki(r)
2
(A5)
Rki(r)=(2ζki)( ni+12)
[(2nki)!] 1 2
rni−1exp(−ζ
kir) (A6)
φi j(ri j)=14.4
Zi(ri j)Zj(ri j)
ri j (A7)
Zi(r)=Z0exp(−ar) (A8)
where, r is the radial distance from the atom. The definition of other parameters can be obtained from literature7,8).
The parameters and cut-off distances (rcut) of GZ- (Grujicic
Zhou) type7,8) MD potential, for an Fe-Ni system are given in
the software for 2-body and many-body parts as summarized in Tables A1 and A2.
Appendix B
The magnitudes of tensile and shear stresses (tensor σ) ap-plied in MD simulations were determined by inputting the values of stress components (tensor Γ) as shown in eq. (B1) where Γ is in the form of a Cartesian coordinate system with a 3 × 3 matrix of real numbers. In reality, Γ is a tensor with units of g/fs2 and its symmetry is as described by GAM(i,j) =
GAM(j,i) for i ≠ j.
Γ =
GAM(1,1) GAM(1,2) GAM(1,3) GAM(2,1) GAM(2,2) GAM(2,3) GAM(3,1) GAM(3,2) GAM(3,3) (B1) The actual stress tensor, σ in MPa is related to the tensor Γ
and the others parameters, Ω (volume of the system) and h (3 × 3 matrix describing the shape of the initial MD cell) as described in eq. (B2).
σ=
σxx σxy σxz
σxy σyy σyz
σxz σyz σzz
(B2)
As a simple case, σ of uniaxial tension for a cubic cell with a lattice constant of a, substituting Ω = a3 and eq. (B3) yield
eq. (B4).
h−1 =h−t= 1
a
1 0 0 0 1 0 0 0 1
=σ/σ0 (B3)
Γ = Ωh−1σh−t=a31
a
σ0 0 0
0 0 0
0 0 0
1a =
aσ0 0 0
0 0 0
0 0 0
(B4) Here, h−1 and h−t, respectively, stand for the conventional
in-verse matrix and transpose inin-verse matrix of h. The value of aσ0 as GAM(1,1) in units of g/fs2 is inputted for calculation.
Appendix C
Summary of the terminologies used in the current study. (1) Amorphous: a state of a crystallographic structure with a
dense and randomly packed atomic arrangement. Its counterpart is called a crystalline state comprising of long range periodicity.
(2) As-quenched amorphous: an amorphous state just quenched from a melt or that is subjected to relaxation in a relatively short time compared to the quenching time. (3) Amorphous relaxed: an amorphous state annealed below
the crystallization temperature for a certain time. An amorphous relaxed state has less free volume than
as-Table A1 EAM parameters and cut-off distance (rcut) for 2-body parts7). Atom1 Atom2 αi/nm−1 Z
0,j αj/nm−1 Z0,j rcut/nm
1 Fe Ni 17.9 23.751 19.2 27.219 0.4368
2 Fe Fe 17.9 23.751 17.9 23.751 0.4368
[image:8.595.47.290.604.656.2]3 Ni Ni 19.2 23.751 17.9 27.219 0.4368
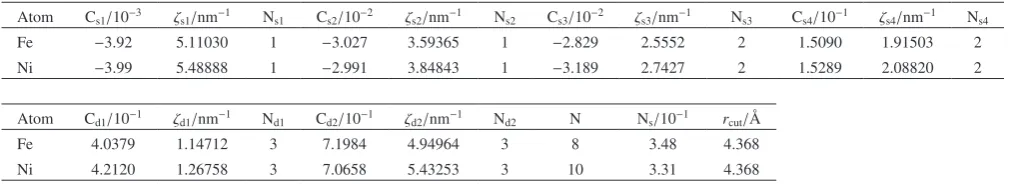
Table A2 EAM parameters and cut-off distance (rcut) for many-body parts7). Atom Cs1/10−3 ζs1/nm−1 N
s1 Cs2/10−2 ζs2/nm−1 Ns2 Cs3/10−2 ζs3/nm−1 Ns3 Cs4/10−1 ζs4/nm−1 Ns4
Fe −3.92 5.11030 1 −3.027 3.59365 1 −2.829 2.5552 2 1.5090 1.91503 2
Ni −3.99 5.48888 1 −2.991 3.84843 1 −3.189 2.7427 2 1.5289 2.08820 2
Atom Cd1/10−1 ζd1/nm−1 N
d1 Cd2/10−1 ζd2/nm−1 Nd2 N Ns/10−1 rcut/Å
Fe 4.0379 1.14712 3 7.1984 4.94964 3 8 3.48 4.368
[image:8.595.46.558.696.788.2]quenched amorphous state due to structural relaxation. (4) fcc derivative phase: derivative here implies family or
crystallographically similar . An example of fcc deriva-tive phase includes L10 tetragonal structure towards a
conventional fcc cubic structure, where the former and the latter can be a face-centered tetragonal and face-cen-tered cubic structure, respectively.
(5) Chemically ordered/disordered structure: Chemically here implies chemical species (species of elements, such as Fe, Ni etc.). In a solid solution, order/disorder can be recognized as the presence/absence of ordered atomic arrangements (atomic configuration with a certain regu-larity in terms of atomic species). For instance, a bcc (A2) phase is a disordered phase, whereas a CsCl (B2) is an ordered phase.
(6) Structural order/disorder: an order/disorder in terms of crystallographic atomic sites. For instance, a highly regu-lar crystal structure is a structurally ordered, whereas an amorphous structure with dense random packing is struc-turally disordered phase.
REFERENCES
1) A. Makino, P. Sharma, K. Sato, A. Takeuchi, Y. Zhang and K. Takena-ka: Sci Rep 5 (2015) 16627.
2) L.X. Cao, J.X. Shang and Y. Zhang: Acta Phys Sin-Ch Ed 58 (2009) 7307–7312.
3) M. Grujicic and P. Dang: Mater. Sci. Eng. A 201 (1995) 194–204. 4) M. Starostenkov, A. Yashin and N. Sinica: Key Eng. Mater. 592–593
(2014) 51–54.
5) Y. Mishin, M.J. Mehl and D.A. Papaconstantopoulos: Acta Mater. 53
(2005) 4029–4041.
6) FUJITSU Technical Computing Solution SCIGRESS , http://www. fujitsu.com/global/solutions/business-technology/tc/sol/scigress/, accessed March 4, 2016.
7) M. Grujicic and X.W. Zhou: Calphad 17 (1993) 383–413. 8) R.W. Smith and G.S. Was: Phys. Rev. B 40 (1989) 10322–10336. 9) M.S. Daw and M.I. Baskes: Phys. Rev. B 29 (1984) 6443–6453. 10) M. Kotsugi, H. Maruyama, N. Ishimatsu, N. Kawamura, M. Suzuki, M.
Mizumaki, K. Osaka, T. Matsumoto, T. Ohkochi, T. Ohtsuki, T. Koji-ma, M. Mizuguchi, K. Takanashi and Y. Watanabe: J. Phys. Condens. Matter 26 (2014) 064206.
11) H. A. Davies: Rapid quenching and formation of metallic glasses, Proc. The Third Rapidly Quenched Metals (The Metal Society, 1973), pp. 1–10.