Molecular Dynamics Study on Structural Relaxation Processes in Amorphous
Germanium
*1Shigetaka Imabayashi
*2and Manabu Ishimaru
Department of Materials Science and Engineering, Kyushu Institute of Technology, Kitakyushu 804–8550, Japan
The structural relaxation of amorphous germanium was examined by molecular dynamics simulations based on the empirical Tersoff in-teratomic potential. Although the Tersoff potential overestimated both the melting and glass transition temperatures, it was able to reproduce the structural relaxation behavior. The potential energy decreases with thermal annealing below the glass transition temperature, but occasionally increases during structural relaxation. The mean square displacement of atoms also increases in these periods. These changes were attributed to cooperative atomic motion during the structural relaxation. Atomic trajectories revealed that structural changes are induced by spatially- and temporally-inhomogeneous atomic motions: atomically mobile and immobile regions coexist during structural relaxation.
[doi:10.2320/matertrans.M2017036]
(Received February 6, 2017; Accepted March 10, 2017; Published April 14, 2017)
Keywords: amorphous, germanium structural relaxation, molecular dynamics simulation, empirical interatomic potential
1. Introduction
Graphite is currently used as the anode material of lithi-um-ion batteries, but the development of materials with high electrical capacity continues with the aim of improving bat-tery performance. The theoretical electric capacities of Si and Ge are 4200 mAh/g (Li22Si5) and 1624 mAh/g (Li22Ge5),
respectively, much larger than that of graphite (372 mAh/g for LiC6), and therefore these materials are anticipated as
an-ode materials for the next generation of lithium-ion batteries. However, large volume changes (>400%) are induced in Si and Ge during charge (lithiation) and discharge (de-lithia-tion), and consequently exfoliation from the collector and pulverization of these materials occur1). Nanoporosification
is one possible way to solve this problem. Amorphous mate-rials inherently contain free volume, and porous matemate-rials can be fabricated by recrystallizing them2–4). In fact, Okugawa et al.5) confirmed that nanoporous structures can be realized in
Ge by electron-beam-induced crystallization. It was also found that the structural relaxation of amorphous Ge (a-Ge) occurs during aging at room temperature. The elec-tron-beam-induced structures of crystallized Ge depend on the aging time: coarse crystal grains are formed in short-peri-od aged specimens, while a uniform nanoporous structure is formed in long-period aged ones. It has also been confirmed that hexagonal Ge, which is a metastable phase, may be formed by controlling the structural relaxation of amorphous Ge6). Although structural relaxation plays an important role
in controlling nanostructure, the details of the process on the atomic scale are not clear.
Molecular dynamics (MD) simulation is a powerful tech-nique for obtaining static information such as on atomic level structures and defects as well as on dynamic behavior such as atomic vibration in short timescales. MD methods can be roughly divided into (1) the first principles MD method, which does not use experimental parameters, and (2) the
clas-sical MD method, which assumes an appropriate interatomic interaction, the so-called empirical potential. The former can be used to perform highly accurate calculations, but enor-mous calculation time is necessary. In contrast, the latter can deal with large-scale systems, but its accuracy is inferior to that of the first principles method. Regarding research on structural relaxation, long-period, large-scale simulation is required, so the classical MD method is most effective. In the present study, we prepared a-Ge by a MD approach using the Tersoff potential, and confirmed the validity of this method. Subsequently, the structural changes in a-Ge during thermal annealing were investigated.
2. Simulation Methods
An empirical interatomic potential proposed by Tersoff7)
was employed for MD simulations. Although this potential is known to produce a melting point higher than the experimen-tal value, it is able to reproduce the static and dynamic behav-iors of Si and Ge in the liquid and amorphous states8–13).
1000 Ge atoms were arranged into a diamond structure in the MD cell with a constant volume of periodic boundary condi-tion 5a0 × 5a0 × 5a0 (a0 is the lattice constant of Ge:
0.5658 nm). This cell was held at 3500 K for 100 ps to pre-pare liquid Ge. The liquid was rapidly quenched to 300 K at a cooling rate of 1012 K/s and held at 300 K for 10 ps to
pro-duce a-Ge (as-quenched a-Ge). This as-quenched a-Ge was held at temperatures ranging from 900 K to 1800 K for 10 ns and again quenched to 300 K at a rate of 1012 K/s (annealed a-Ge). For the simulation, the time step was set to 2 fs and the temperature was controlled by the velocity scaling method.
3. Results and Discussion
It has been reported that the melting point of Ge produced by the Tersoff potential is 2448 K14), and therefore it was
con-firmed that steady state liquid Ge is obtained by holding at 3500 K for 100 ps. Figure 1 shows the potential energy change during cooling at 1012 K/s. The fluctuation in the
po-tential energy decreases with cooling, which corresponds to *1 This Paper was Originally Published in Japanese in J. Japan Inst. Met.
Mater. 81 (2017) 66–70.
*2 Graduate Student, Kyushu Institute of Technology
the reduction in thermal atomic vibration. The potential ener-gy initially decreases monotonically with cooling, but drops more sharply at 2500 K and then decreases linearly be-low 1600 K, suggesting that glass transition occurs at about 1600 K. The existence of a glass transition point has been experimentally confirmed in amorphous Si, which like Ge is a group IV semiconductor15). It is empirically known that the
ratio of the glass transition point Tg to the melting point Tm
(Tg/Tm) is 2/3. It has also been experimentally confirmed that
the glass transition point of Ge is 750 K and its melting point is 1210 K16), giving T
g/Tm = 0.62, which is close to the
empir-ical rule. From our simulations, Tg/Tm is equal to 0.65, in
agreement with the experimental value. This suggests that the Tersoff potential can qualitatively reproduce the glass transi-tion behavior, though its melting temperature (2448 K) dif-fers from the experimental value.
To examine the effects of annealing temperature on the amorphous structure, as-quenched a-Ge was held at tempera-tures ranging from 900 K to 1800 K. The change in the poten-tial energy as a function of annealing time is shown in Fig. 2. The potential energy during annealing at 900 K does not change with respect to time, and no structural relaxation oc-curs. This is attributed to 900 K being insufficient to induce
atomic rearrangement and bond switching for structural re-laxation. However, the potential energy decreases with in-creasing annealing time at 1500 K. This suggests that defects and strains present in the as-quenched network disappear and structural relaxation occurs. At 1800 K, the potential energy rises during the initial stage and is then constant. The glass transition point was estimated to be 1600 K (Fig. 1), and therefore the amorphous material is molten at 1800 K.
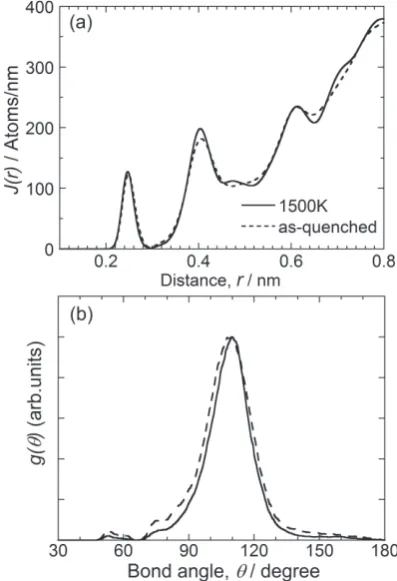
We investigated the structure of a-Ge obtained after an-nealing at 1500 K. Figure 3(a) shows the radial distribution functions obtained from the atomic arrangement of as-quenched (broken line) and annealed a-Ge (solid line). The annealed atomic arrangement was obtained by maintaining as-quenched a-Ge at 1500 K for 10 ns and then quenching it to 300 K at a cooling rate of 1012 K/s. The first and second
peaks in Fig. 3(a) exist at 0.248 nm and 0.406 nm, respective-ly, whereas no significant peak is observed at 0.469 nm, which is the third nearest interatomic distance of crystalline Ge. These features of the radial distribution function agree with those obtained experimentally17,18). The present MD
simulations were performed under the constant volume con-dition, but it was confirmed that a similar structure can be obtained even in constant pressure simulations. The height of the first peak is hardly changed by annealing, while the sec-ond peak becomes large. Similar structural changes have been reported for amorphous Si, the structure of which is sim-ilar to that of Ge19), suggesting that our simulation reproduces
realistic structural relaxation.
Figure 3(b) shows the bond angle distributions of as-quenched (broken line) and annealed a-Ge (solid line). In
Fig. 2 Change in potential energy during thermal annealing at 900, 1500, and 1800 K.
Fig. 3 (a) Radial distribution functions and (b) bond angle distribution functions of as-quenched (broken line) and 1500 K-annealed amorphous Ge (solid line).
[image:2.595.67.270.364.558.2] [image:2.595.326.525.460.751.2] [image:2.595.68.269.612.761.2]both cases, a peak exists at 109.5 , indicating that the amor-phous network consists of a tetrahedral structure as a short-range order. Additionally, the peak width of bond angle distri-bution decreases with annealing. The standard deviation of the bonding angle, Δθ, of as-quenched and annealed a-Ge is 12.5 and 11.0 , respectively. Because strain energy is propor-tional to Δθ220), the strain energy decreases with annealing,
which is consistent with structural relaxation. The reduction of Δθ caused by structural relaxation has also been confirmed by Raman spectroscopy21).
Figure 4(a) shows the change in potential energy during annealing at 1200 K, sufficiently lower than the glass transi-tion point. As observed for 1500 K annealing, the potential energy decreases and structural relaxation takes place. It should be noted that undulation exists between 4.3 and 5.6 ns; the low potential state at 4.3 ns transforms to another one at 5.6 ns via the high potential state at 5.1 ns. A similar change is seen at 1500 K (Fig. 2), but its frequency is larger. To clar-ify the origin of this potential energy undulation, the mean square displacement (MSD) was investigated. When a parti-cle existing at rα(t0) at time t0 moves to rα(t + t0) after the
elapse of time t, the MSD can be calculated using the follow-ing equation:
R2(t) = 1 N
N
α=1
[rα(t+t0)−rα(t0)]2, (1)
where N is the number of particles. Figure 4(b) shows the time evolution of the MSD at 1200 K. The existence of pla-teau regions in the MSD reveals that no melting occurs during annealing22). In contrast, the MSD greatly changes during
4.3 ns and 5.6 ns where the undulation of the potential energy
was observed in Fig. 4(a), indicating the occurrence of re-markable atomic movement.
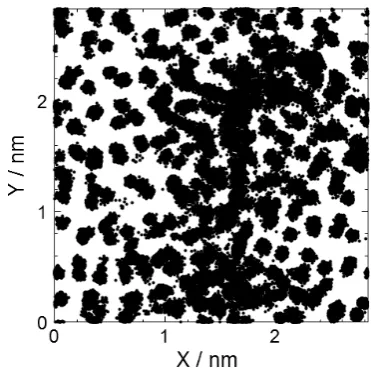
To obtain information on the atomic motion, the atomic positions during annealing at 1200 K are shown in Fig. 5. We plotted atoms contained in the range of 5a0 in the x and y
di-rections and a0 in the z direction over 0 to 10 ns. In addition
to the atoms thermally vibrating on the lattice points, moving atoms largely exist in the region of x = 1.2 to 2.0 nm and y = 1.0 to 2.5 nm. Because the movement of atoms during the whole simulation time (0 to 10 ns) is plotted in Fig. 5, the movement of each atom is difficult to see. Therefore, we next investigated the movement of atoms in a shorter period. Fig-ure 6(b) shows the trajectory of atoms in the time range from 4.3 to 5.6 ns, in which large changes were observed in the potential energy (Fig. 4 (a)) and MSD (Fig. 4 (b)). For com-parison, the trajectories of atoms at 1.0 to 2.3 ns and 8.0 to 9.3 ns are shown in Fig. 6(a) and (c), respectively. In Fig. 6(b), F is the trajectory of only the atoms moving less than 0.25 nm, which is approximately the first nearest neighbor distance of Ge, while A to E are trajectories of atoms moving more than 0.25 nm. In Fig. 6(a) and (c), it can be seen that the majority of the atoms thermally vibrate on the lattice points. In con-trast, the atomic positions of A to E are quite different be-tween Fig. 6(a) and (c). It is clear in Fig. 6(b) that A to E at-oms migrate significantly between 4.3 and 5.6 ns where re-markable changes were observed in the potential energy and MSD (Fig. 4).
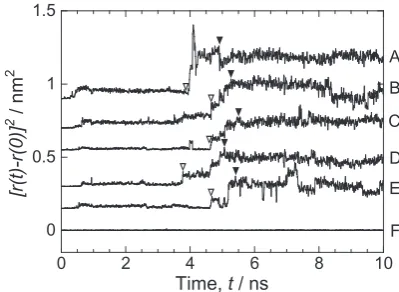
To investigate the correlation between the motions of dif-ferent atoms, Fig. 7 shows the square displacement of A to E atoms, which showed large-scale movements in Fig. 6(b). For comparison, the result for the F atom vibrating on the lattice points is also shown. The position of the origin of the vertical axis is shifted in Fig. 7. The open and filled triangles indicate the start and end times of the large-scale movements, respec-tively. The atomic movements become more pronounced lo-cally during the time period in which remarkable changes are observed in the potential energy and MSD (Fig. 4). In other words, structural changes are induced by spatially- and tem-porally-inhomogeneous atomic motions; atomically mobile and immobile regions coexist during structural relaxation. It should be noted that the fluctuation in the square
displace-Fig. 4 (a) Potential energy and (b) mean square displacement (MSD) as a function of annealing time. The annealing temperature of the system is
[image:3.595.70.270.471.754.2] [image:3.595.332.518.587.772.2]ment of A to E atoms is larger than that of the F atom vibrat-ing at the lattice points. The reason for this is not clear, but it is suggested that A to E atoms are intrinsically easy to move, even before and after the large-scale atomic displacement oc-curs. Similar cooperative atomic motions have also been ob-served in the structural relaxation of metallic glasses23). In a
supercooled liquid state, a region where atoms are easy to move and a region where atoms are difficult to move are re-ported to coexist24–26). This phenomenon is known as
dynam-ic heterogeneity. In the present simulation, we investigated the behavior of a-Ge below the glass transition temperature, but behavior similar to dynamical heterogeneity was observed
during the structural relaxation.
4. Conclusions
The structure of a-Ge and its behavior during thermal an-nealing were examined by MD simulations based on the em-pirical Tersoff interatomic potential. The following results were obtained:
(1) A liquid-to-glass transition occurred at 1600 K during quenching. Its value is 2/3 of the melting temperature, which agrees with the experimental result. It was confirmed that the calculated radial distribution function and bond angle distribution of a-Ge and their change caused by structural re-laxation well reproduce the experimental results. This sug-gests that the Tersoff potential is useful for investigating the structure and structural relaxation processes of a-Ge, even though the melting and glass transition temperatures it pro-duces are higher than the experimental values.
(2) The as-quenched a-Ge was annealed at temperatures ranging from 900 K to 1800 K. It was confirmed that the amorphous state is molten at 1800 K, because its temperature is higher than the glass transition temperature ( 1600 K). The potential energy decreases with thermal annealing at 1200 K and 1500 K, suggesting that defects and distortions present in the as-quenched a-Ge network disappear and struc-tural relaxation takes place. The migration of atoms is insuf-ficient at 900 K, and so no remarkable structural relaxation is observed.
(3) From the trajectory of atoms and the mean square dis-placement of atoms, it was found that spatially- and temporal-ly-inhomogeneous structural changes occur during the struc-tural relaxation of a-Ge. That is, in addition to the atoms vi-brating on lattice points, there is a region in which atoms mi-grate collectively on a large scale. This behavior is similar to the dynamic heterogeneity observed in supercooled liquids.
REFERENCES
1) H. Wu and Y. Cui: Nano Today 7 (2012) 414–429.
2) M. Tane, S. Nakano, R. Nakamura, H. Ogi, M. Ishimaru, H. Kimizuka and H. Nakajima: Acta Mater. 59 (2011) 4631–4640.
3) R. Nakamura, M. Ishimaru, A. Hirata, K. Sato, M. Tane, H. Kimizuka, T. Shudo, T.J. Konno and H. Nakajima: J. Appl. Phys. 110 (2011) 064324.
Fig. 6 Atomic trajectories in a-Ge annealed at 1200 K for (a) 1.0–2.3 ns, (b) 4.3–5.6 ns, and (c) 8.0–9.3 ns.
[image:4.595.77.262.61.593.2] [image:4.595.325.525.69.215.2]4) R. Nakamura, M. Ishimaru, K. Sato, K. Tanaka, H. Nakajima and T.J. Konno: J. Appl. Phys. 114 (2013) 124308.
5) M. Okugawa, R. Nakamura, M. Ishimaru, K. Watanabe, H. Yasuda and H. Numakura: J. Appl. Phys. 119 (2016) 214309.
6) M. Okugawa, R. Nakamura, M. Ishimaru, H. Yasuda and H. Numakura: AIP Adv. 6 (2016) 125035.
7) J. Tersoff: Phys. Rev. B 39 (1989) 5566–5568.
8) M. Ishimaru, K. Yoshida and T. Motooka: Phys. Rev. B 53 (1996) 7176–7181.
9) M. Ishimaru, K. Yoshida, T. Kumamoto and T. Motooka: Phys. Rev. B 54 (1996) 4638–4641.
10) M. Ishimaru, S. Munetoh and T. Motooka: Phys. Rev. B 56 (1997) 15133–15138.
11) M. Ishimaru: J. Appl. Phys. 91 (2002) 686–689.
12) M. Ishimaru, M. Yamaguchi and Y. Hirotsu: Phys. Rev. B 68 (2003) 235207.
13) J.K. Bording: Phys. Rev. B 62 (2000) 7103–7109.
14) P. López, L. Pelaz, I. Santos, L.A. Marqués and M. Aboy: J. Appl. Phys. 111 (2012) 033519.
15) A. Hedler, S.L. Klaumunzer and W. Wesch: Nat. Mater. 3 (2004) 804–
809.
16) T. Masumoto, K. Suzuki, H. Huzimori and K. Hashimoto: Amorphous kinnzoku no kiso, (Ohmsha, Tokyo, 1982) p. 36.
17) G. Dalba, P. Fornasini, M. Grazioli and F. Rooca: Phys. Rev. B 52 (1995) 11034–11043.
18) S. Roorda, C. Martin, M. Droui, M. Chicoine, A. Kazimirov and S. Kyucia: Phys. Rev. Lett. 108 (2012) 255501.
19) K. Laaziri, S. Kycia, S. Roorda, M. Chicoine, J.L. Robertson, J. Wang and S.C. Moss: Phys. Rev. Lett. 82 (1999) 3460–3463.
20) P. Roura, J. Farjas and P.R.I. Cabarrocas: J. Appl. Phys. 104 (2008) 073521.
21) F. Kail, J. Farjas, P. Roura, C. Secouard, O. Nos, J. Bertomeu, F. Alzina and P.R.I. Cabarrocas: Appl. Phys. Lett. 97 (2010) 031918.
22) M. Ishimaru: Phys. Rev. B 63 (2001) 237401.
23) M. Shimono and H. Onodera: Mater. Sci. Forum 638–642 (2010) 1648–1652.
24) M.D. Ediger: Annu. Rev. Phys. Chem. 51 (2000) 99–128.
25) W. Kob, C. Donati, S.J. Plimpton, P.H. Poole and S.C. Glotzer: Phys. Rev. Lett. 79 (1997) 2827–2830.