Hydrogen Permeability in Nb–Ti–Ni Alloys Containing
Much Primary (Nb,Ti) Phase
Weimin Luo
*1, Kazuhiro Ishikawa and Kiyoshi Aoki
*2Department of Materials Science, Kitami Institute of Technology, Kitami 090-8507, Japan
In order to develop high hydrogen permeability alloys, structural changes induced by hydrogenation, microstructures and hydrogen permeabilitywere investigated for samples on the straight line connecting the eutectic and the primary phase in the Nb–Ti–Ni phase diagram.
was measurable in the alloys containing much amount of the eutectic phase, indicating that the eutectic microstructure suppresses the hydrogen embrittlement. The value ofincreased with increasing Nb content and the volume fraction of the primary (Nb,Ti) phase. The most Nb-rich Nb68Ti17Ni15alloy showed the highestof4:9110 8(mol H2m 1s 1Pa 0:5) at 673 K, which is 2.5 times higher than that of the Nb39Ti31Ni30alloy, which has been reported to be highest in the Nb–Ti–Ni alloys. The present work demonstrated that the hydrogen permeable alloys are extended on the straight line connecting the eutectic and the primary phase to the Nb-rich side in the Nb–Ti–Ni system.
(Received June 2, 2005; Accepted August 30, 2005; Published October 15, 2005)
Keywords: hydrogen embrittlement, hydrogen absorption, hydrogen permeation, hydride, phase transformation
1. Introduction
Pd–Ag alloys are mainly used for a hydrogen permeation membrane to separate and to purify hydrogen gas, but they are too expensive and rare natural resources. Then, it is strongly desired to develop low cost and high performance hydrogen permeation alloys.1,2)Hydrogen permeabilityof the group 5A metals such as V, Nb and Ta is much higher than that of Pd and Pd–Ag alloys, but these metals and their alloys suffer from the severe hydrogen embrittlement and can’t be used as a membrane.3–8) Recently, the present
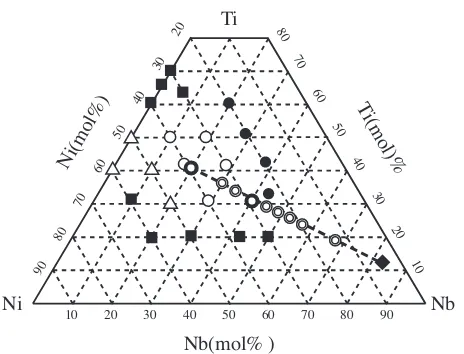
authors have discovered that the Nb–Ti–Ni alloys, consisting of the B2-TiNi compound and the bcc-(Nb,Ti) solid solution, show highand large resistance to the hydrogen embrittle-ment.9,10)Figure 1 shows the alloy compositions investigated
in the previous9) and the present works. The hydrogen
permeable alloys ( and ) locate near the line connecting the TiNi compound and pure Nb and are 40 mol%Nb and less. The most Nb-rich hydrogen permeable Nb39Ti31Ni30
alloy consists of the eutectic {(Nb,Ti) + TiNi} phase and the primary (Nb,Ti) one. Chemical compositions of the former and the latter phase are Nb20:5Ti38:5Ni41 and Nb83Ti13Ni4,
respectively. It is well known that the hydrogen embrittle-ment is generally caused by the formation of the metal hydride. Then, it is interesting and important to make clear whether the Nb hydride is formed or not in these alloys.
The maximum value ofis1:9610 8(mol H
2m 1s 1
Pa 0:5) in the Nb
39Ti31Ni30 alloy which consists of B2-TiNi
and bcc-(Nb,Ti) at 673 K,9,10)which is higher than that of
pure Pd. However, this value of is insufficient for the application of the membrane reformer system, so that the further improvement ofis desired earnestly. For instance, is immeasurable in the Nb42Ti20Ni38 alloy ( ) and the
Nb43Ti34Ni23 one ( ), because the former alloy is brittle in
the as-cast state, while the latter one is broken by the hydrogen embrittlement.9,10)The Nb42Ti20Ni38alloy consists
of three phases, i.e. the primary phase, TiNi and brittle
Nb8Ti3Ni9 compounds,10) while the Nb43Ti34Ni23 alloy
consists of three phases, i.e.the primary phase, the eutectic phase and the TiNi compound.10)From these experimental
results, it is suggested that is measurable in two-phase alloys consisting of the eutectic and the primary phase in the Nb–Ti–Ni system. As it is well known, ternary alloys on the straight line connecting the eutectic point and the primary phase consist of the eutectic and primary phases. Then,of the alloys on this line may be measurable.
In the present work, hydrogen-induced structural changes in three types of Nb–Ti–Ni alloys,i.e.the only eutectic phase {(Nb,Ti) + TiNi}, the eutectic phase {(Nb,Ti) + TiNi} + the primary phase (Nb,Ti) and the only primary phase (Nb,Ti), are investigated to make clear formation conditions of the Nb hydride by anin situXRD experiment performed in a hydrogen atmosphere and at elevated temperatures. Furthermore, microstructures and hydrogen permeability
Ti
Ni Nb
Ni(mol%)
T i(mol)%
Nb(mol% )
10 20 30 40 50 60 70 80 90
80 70
60 50
40 30
20 10
20
30
40
50
60
70
80
90
Fig. 1 The alloy compositions investigated in the previous9) and the
present works. The solid squares and circles denote the brittle alloys in the as-cast state and the broken ones by hydrogenation, respectively. The open circles and triangles denote the alloys for which the hydrogen permeation experiments are possible. The double circles denote the alloys investigated in the present work.
*1Graduate Student, Kitami Institute of Technology
*2Corresponding author, E-mail: aokiky@mail.kitami-it.ac.jp
[image:1.595.312.544.309.486.2]of the Nb–Ti–Ni alloys on the line connecting the eutectic and the primary phase are investigated in order to develop high hydrogen permeability alloys.
2. Experimental
Nb20:5Ti38:5Ni41 (the only eutectic phase), Nb40Ti30Ni30
(the eutectic phase + the primary one) and Nb83Ti13Ni4(the
only primary phase) alloys on the straight line connecting the eutectic phase and the primary phase in the Nb–Ti–Ni ternary phase diagram were prepared for thein situXRD measure-ment by arc melting using Nb (99.9 mass% purity), Ti (99.5 mass% purity) and Ni (99.9 mass% purity) in a purified argon atmosphere. In the present work, the alloy composi-tions are expressed by mol%. Furthermore, the Nb-rich Nb– Ti–Ni alloys on the same line were also prepared for the
measurement of and the observation of their
micro-structures, and their chemical compositions ( ) are plotted in Fig. 1. Disk samples of 12 mm in diameter and 0.8 mm in thickness were cut off with a spark erosion wire-cutting machine. Both sides of disks were polished with buff and -alumina of 0.5mm particle, and coated with Pd in the thickness of 190 nm by the RF-sputtering machine. The Pd-coating was done to avoid oxidation and to promote the hydrogen dissociation and the recombination. Microstruc-tural observations and strucMicrostruc-tural examinations were carried out using a scanning electron microscope (SEM) and an X-ray diffractometer (XRD), respectively. Chemical composi-tions were analyzed by an energy dispersive X-ray spec-trometer (EDS) attached to SEM. Thein situXRD pattern of the Pd-coated disk sample was firstly measured at 673 K in a vacuum. After introducing of 0.5 MPa hydrogen to the hydrogen reactor chamber, the XRD pattern was measured at this temperature. Subsequently, the temperature was stepped down from 673 K to R.T at 50 K intervals. Hydrogen permeabilitywas measured by using an apparatus, which has been described in the previous paper.9)
3. Results
3.1 Structural changes in the Nb–Ti–Ni alloys showing typical microstructures by hydrogenation
Figures 2(a) and (b) show SEM photographs of the
eutectic Nb20:5Ti38:5Ni41 alloy. This alloy shows the fine
lamellar microstructure characteristic of the eutectic phase. Figure 3 shows in-situ XRD patterns of the Nb20:5
-Ti38:5Ni41 alloy heated at 673 K in a vacuum (a) and
subsequently hydrogenated at several temperatures at 0.5 MPa H2 (b). This alloy consists of the bcc-(Nb,Ti) solid
solution and the B2-TiNi compound. We confirm that the
20µ
m
5µ
m
Fig. 2 (a) and (b) SEM photographs of the Nb20:5Ti38:5Ni41alloy. The right-side photograph (b) is the enlarged one of the left side photograph (a), showing the lamellar structure of the eutectic phase.
(4) 523K
(3) 573K
(2) 673K
(8) R.T.
111
200
022 31
1
220
(5) 473K
(6) 423K
(7) 373K
(1) 673K
11
0
200
21
1
220
200
11
0
21
1
111
200
222
in a vacuum
in 0.5MPa H
2(a)
(b)
Intensity/a.u.
2
θ/
degree
90
80
70
60
50
40
30
bcc-(Nb,Ti)
B2-TiNi
fcc-Pd
fcc-PdH
orthorhombic-NbH
[image:2.595.83.514.74.227.2] [image:2.595.315.541.295.634.2]Nb20:5Ti38:5Ni41 alloy consists of almost all eutectic
micro-structures {bcc-(Nb,Ti) + B2-TiNi} on the basis of Figs. 2 and 3. The Bragg peaks of the (Nb,Ti) phase shift to a lower angle side by hydrogenation at 673 K, indicating that hydrogen is absorbed in solid solution, but do not form the hydride. On the other hand, the Bragg peaks of TiNi and Pd do not almost shift, indicating that a little hydrogen is absorbed in these phases. When the sample’s temperature is stepped down from 673 to 473 K, the Bragg peaks of these
phases do not substantially shift. The PdH hydride is formed at 423 K and below, while NbH is formed at 373 K and below.
Figures 4(a) and (b) show SEM photographs of the Nb40Ti30Ni30 alloy. The white phase is the primary one,
which is surrounded by the lamellar eutectic phase.
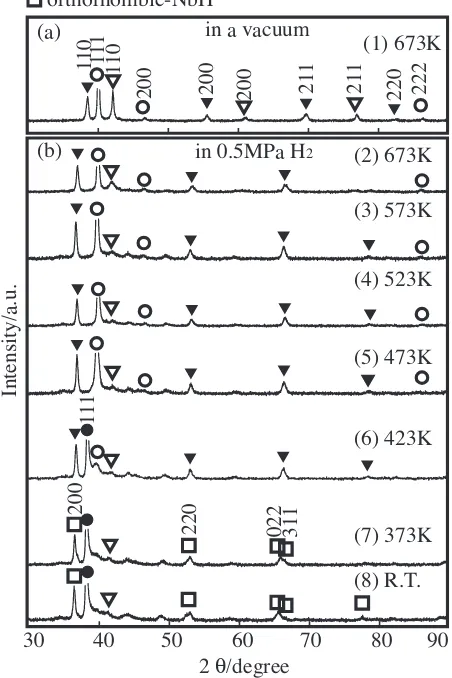
Figure 5 showsin-situXRD patterns of the Nb40Ti30Ni30
alloy heated at 673 K in a vacuum (a) and subsequently hydrogenated at several temperatures at 0.5 MPa H2 (b),
respectively. We confirm that the Nb40Ti30Ni30alloy consists
of a combination of the primary phase bcc-(Nb,Ti) with the eutectic phase {bcc-(Nb,Ti) + B2-TiNi} on the basis of Figs. 6 and 7. Structural changes in the Nb40Ti30Ni30 alloy
are similar to those in the Nb20:5Ti38:5Ni41alloy except for the
following. The PdH hydride is formed at 473 K and below, while NbH is formed at 373 K and below and NbH2is formed
at room temperature.
Figure 6 shows an SEM photograph of the primary Nb83Ti13Ni4 alloy.
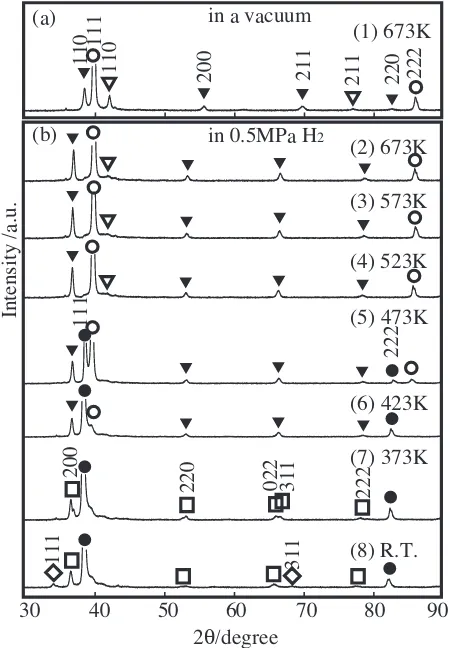
Figure 7 show in-situ XRD patterns of the Nb83Ti13Ni4
alloy heated at 673 K in a vacuum (a) and subsequently hydrogenated at several temperatures at 0.5 MPa H2 (b),
respectively. We confirm that the Nb83Ti13Ni4alloy consists
of the only primary phase bcc-(Nb,Ti) on the basis of Figs. 6 and 7. Structural changes in the Nb83Ti13Ni4alloy are similar
to those in the Nb20:5Ti38:5Ni41alloy except for the following.
20µ
m
5µ
m
(a)
(b)
Fig. 4 SEM photographs of the Nb40Ti30Ni30alloy. The right-side photograph (b) is the enlarged one of the left side photograph (a), showing the lamellar structure of the eutectic phase.
(4) 523K
(3) 573K
(2) 673K
311
111
(5) 473K
(6) 423K
(7) 373K
111
222
200
022 311
222
220
(1) 673K
110
200
211
220
110
211
111
222
in a vacuum
in 0.5MPa H2 (a)
(b)
Intensity /a.u.
2
θ/
degree
30
40
50
60
70
80
90
bcc-(Nb,Ti) B2-TiNi fcc-Pd fcc-PdH
fcc-NbH2 orthorhombic-NbH
(8) R.T.
Fig. 5 Thein-situXRD patterns of the as-cast Nb40Ti30Ni30alloy heated at 673 K in a vacuum (a) and hydrogenated at several temperatures at 0.5 MPa H2(b).
20µ
m
[image:3.595.96.502.72.217.2] [image:3.595.315.538.265.430.2] [image:3.595.57.282.294.618.2]The PdH hydride is formed at 473 K and below, while NbH is formed at 373 K and below and NbH2 is formed at room
temperature.
The lattice parameters for these alloys are tabulated in Table 1. The lattice parameters of bcc-(Nb,Ti) and B2-TiNi are 0.330 (0.331) nm and 0.303 nm at 673 K, respectively, for every sample. The Bragg peaks of the (Nb,Ti) phase shift to a lower angle side by hydrogenation at 673 K (Figs. 3, 5 and 7), indicating that hydrogen is absorbed in solid solution, but do not form the hydride. The lattice parameters of the bcc-(Nb,Ti) phase increase to 0.344 nm by hydrogenation at 673 K and below. Then, the expansion of the lattice
parameter is 4%. The Nb hydride is formed at 373 K and
below for every sample, while NbH2 is formed at room
temperature in the Nb40Ti30Ni30and Nb83Ti13Ni4alloys. It is
noted that the Nb hydride is not formed at 423 K and above, which suggests that a hydrogen permeation measurement is possible in this temperature range. In fact,is measurable in the former two alloys containing eutectic phase, but is immeasurable due to the hydrogen embrittlement in the primary phase alloy as follows.
3.2 Microstructures of the Nb-rich Nb–Ti–Ni alloys
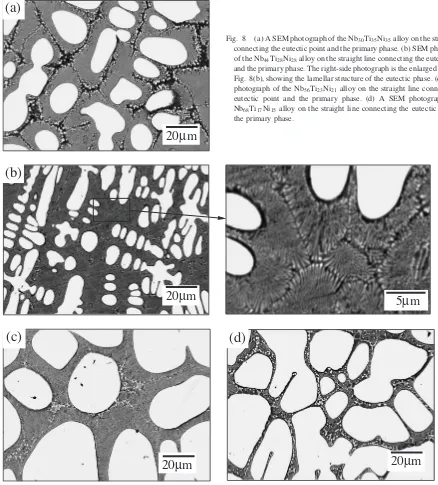
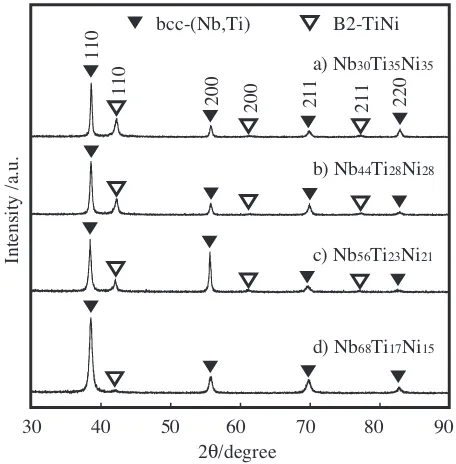
Figures 8(a), (b), (c) and (d) show SEM photographs for the Nb–Ti–Ni alloys on the straight line connecting the eutectic point and the primary phase,i.e., the Nb30Ti35Ni35,
the Nb44Ti28Ni28, the Nb56Ti23Ni21 and the Nb68Ti17Ni15
alloys, respectively. The white phase is the primary (Nb,Ti) one surrounded by the eutectic phase. The volume fraction of the primary phase in the Nb30Ti35Ni35, the Nb44Ti28Ni28, the
Nb56Ti23Ni21 and the Nb68Ti17Ni15 alloy is 24, 43, 62 and
74 vol%, respectively.
Figure 9 shows XRD patterns of the above-mentioned alloys. All of these alloys consist of the bcc-(Nb,Ti) and the B2-TiNi phase. From Figs. 8 and 9, we can see that all these alloys consist of a combination of the primary bcc-(Nb,Ti) phase with the eutectic {bcc-(Nb,Ti) + B2-TiNi} phase. The lattice parameters of these alloys are tabulated in Table 2. The lattice parameters of the former and the latter phase are 0.330 and 0.302 nm, respectively.
3.3 Hydrogen permeability of the Nb-rich Nb–Ti–Ni alloys
Figure 10 shows hydrogen permeabilityof the alloys on the above-mentioned line in the form of the Arrhenius plot. For reference, those of Pd measured using the same apparatus and procedures as the present work are also plotted in this figure. The value increases with increasing temperature and the Nb content. The values offor the Nb44Ti28Ni28, the
Nb56Ti23Ni21 and the Nb68Ti17Ni15 alloys are higher than
that of the Nb40Ti30Ni30alloy. The Nb68Ti17Ni15alloy shows
the highestof4:9110 8(mol H
2m 1s 1Pa 0:5) at 673
K, which is 2.5 times higher than that of the Nb40Ti30Ni30
alloy. However, this alloy is not so strong to the hydrogen embrittlement, because it is broken down below 573 K.
Figure 11 shows the values of for the above alloys
measured at 673 K plotted against the Nb content. The value increases parabolically with increasing Nb content up
to 68 mol% Nb. It is reasonable that increases with
(7) 373K (4) 523K (3) 573K (2) 673K
222
200
022 31
1
222
220
31
1
111
200
(8) R.T.(5) 473K
(6) 423K
111
222
200
(1) 673K
11
0
200
21
1
220
111
200
222
11
0
in a vacuum
in 0.5MPa H2 (a)
(b)
Intensity/a.u.
2θ/degree
30 40 50 60 70 80 90
bcc-(Nb,Ti) B2-TiNi fcc-Pd fcc-PdH
orthorhombic-NbH fcc-NbH2
Fig. 7 Thein-situXRD patterns of the as-cast Nb83Ti13Ni4alloy heated at 673 K in a vacuum (a) and hydrogenated at several temperatures at 0.5 MPa H2(b).
lattice parameter (nm)
alloy phase in a vaccum at 0.5 MPa H2
673 K 673 K 573 K 523 K 473 K 423 K
Nb20:5Ti38:5Ni41 (Nb,Ti) 0.330 0.344 0.344 0.344 0.344 0.344
TiNi 0.303 0.303 0.303 0.304 0.303 0.303
Nb40Ti30Ni30 (Nb,Ti) 0.330 0.344 0.344 0.344 0.344 0.344
TiNi 0.303 0.304 0.304 0.304 0.304 0.303
[image:4.595.53.550.94.204.2] [image:4.595.58.283.236.581.2]increasing Nb content, becauseof pure Nb is much higher than that of TiNi.
Figure 12 shows the values of for the above alloys at 673 K plotted against the volume fraction of the primary phase (Nb,Ti). The value increases parabolically with increasing the volume fraction of the primary phase (Nb,Ti). The most Nb-rich hydrogen permeable Nb68Ti17Ni15 alloy
consists of the 26 vol% eutectic phase and the 74 vol% primary phase.
4. Discussion
4.1 Formation of the Nb hydride and the hydrogen embrittlement
Hydrogen-induced structural changes in three types of Nb– Ti–Ni alloys, showing typical microstructures,i.e., i) the only eutectic phase (Nb20:5Ti38:5Ni41), ii) the eutectic phase + the
primary phase (Nb40Ti30Ni30) and iii) the only primary phase
(Nb83Ti13Ni4) have been investigated by the in-situ X-ray
diffraction (XRD) at 0.5 MPa H2. These alloys absorb
hydrogen to form the solid solution, but do not form the Nb hydride between 423 and 673 K, which suggest that the hydrogen permeation is possible in this temperature range. In
20µ
m
(a)
20µ
m
5µ
m
(b)
20µ
m
(c)
20µ
m
(d)
Fig. 8 (a) A SEM photograph of the Nb30Ti35Ni35alloy on the straight line connecting the eutectic point and the primary phase. (b) SEM photographs of the Nb44Ti28Ni28alloy on the straight line connecting the eutectic point and the primary phase. The right-side photograph is the enlarged one of the Fig. 8(b), showing the lamellar structure of the eutectic phase. (c) A SEM photograph of the Nb56Ti23Ni21alloy on the straight line connecting the eutectic point and the primary phase. (d) A SEM photograph of the Nb68Ti17Ni15alloy on the straight line connecting the eutectic point and the primary phase.
Table 2 The lattice parameters of the (Nb,Ti) and TiNi for the Nb30Ti35 -Ni35, Nb44Ti28Ni28, Nb56Ti23Ni21 and the Nb68Ti17Ni15 alloys on the straight line connecting the eutectic point and the primary phase.
alloy lattice parameter (nm)
(Nb,Ti) TiNi
[image:5.595.306.550.620.696.2]fact,is measurable without the fracture of the membrane in the former two alloys containing the eutectic phase. On the
contrary, is immeasurable in the alloy with the only
primary phase, because it is broken down during the permeation measurement. This experimental result indicates that the eutectic microstructure suppresses the hydrogen-induced fracture, although its mechanism is still uncertain. It is important to note that the hydrogen-induced fracture of the primary phase does not result from the formation of the Nb hydride, which suggests that there is a possibility that is measurable without the fracture in the alloys between the Nb40Ti30Ni30 and the Nb83Ti13Ni4 alloys.
4.2 Hydrogen permeability of Nb-rich Nb–Ti–Ni alloys
The alloy compositions investigated in the present work along with the previous one9,10)are plotted in Fig. 1. This
figure indicates that hydrogen permeable alloys ( and ) are obtained between 30 and 50 mol% Ti and between 30 and
60 mol% Ni.9,10) The most Nb-rich Nb
40Ti30Ni30 alloy
showing maximumconsists of the primary and the eutectic phase. On the other hand, the Nb42Ti20Ni38 alloy ( ),9,10)
which is brittle in the as-cast state, consists of the primary phase, the eutectic phase and the brittle Nb8Ti3Ni9
com-pound. The Nb43Ti34Ni23 alloy ( ),9,10) which is broken
down by the hydrogen embrittlement, consists of the primary phase, the eutectic phase and the TiNi. Consequently, it is expected that is measurable in the alloys consisting of a combination of the primary phase with the eutectic phase. Then, microstructures and the values of the alloys on the straight line connecting the eutectic and the primary phase are investigated in the present work. In fact, the alloys ( ) on the above line consist of the primary phase and the eutectic
110
200 211 220
110
200 211
a) Nb30Ti35Ni35
c) Nb56Ti23Ni21
b) Nb44Ti28Ni28
d) Nb68Ti17Ni15
2θ/degree
Intensity /a.u.
30 40 50 60 70 80 90
Fig. 9 (a), (b), (c) and (d) The XRD patterns of the Nb30Ti35Ni35, the Nb44Ti28Ni28the Nb56Ti23Ni21and the Nb68Ti17Ni15alloys, respectively on the straight line connecting the eutectic point and the primary phase.
Φ /
molH
2
m
-1s-1
Pa
-0.5
10-7
10-8
10-9
673K 623K 573K 523K
1000T-1
/K-1
1.4 1.5 1.6 1.7 1.8 1.9 2.0
Nb68Ti17Ni15
Nb56Ti23Ni21
Nb44Ti28Ni28
Nb40Ti30Ni30
Nb30Ti35Ni35
[image:6.595.55.283.72.304.2]Pure Pd
Fig. 10 Hydrogen permeabilityfor the as-cast Nb–Ti–Ni alloys on the straight line connecting the eutectic point and the primary phase in the form of the Arrhenius plot.
Φ/
10
-8 molH
2
m
-1 s -1 Pa -0.5
20 30 40 50 60 70
1.0 2.0 3.0 4.0
[image:6.595.313.541.73.269.2]Nb/mol%
Fig. 11 The values offor the as-cast Nb–Ti–Ni alloys on the straight line connecting the eutectic point and the primary phase at 673 K plotted against the Nb content.
Φ/
10
-8 molH
2
m
-1 s -1 Pa -0.5
20 30 40 50 60 70
1.0 2.0 3.0 4.0 5.0
80
0 10
Volume fraction of (Nb,Ti)/vol%
[image:6.595.313.540.336.529.2] [image:6.595.57.283.368.522.2]one, i.e. the B2-TiNi compound and the bcc-(Nb,Ti) solid solution, and are hydrogen permeable up to 68 mol%Nb. The most Nb-rich Nb68Ti17Ni15 alloy containing the 26 vol%
eutectic phase shows the highest of 4:9110 8 (mol
H2m 1s 1Pa 0:5), which is 2.5 times higher than that of the
Nb40Ti30Ni30 alloy. The present work demonstrates that the
hydrogen permeable alloys in the Nb–Ti–Ni system are extended on the straight line connecting the eutectic point and the primary phase to Nb-rich compositions and that the eutectic phase is essential for the suppression of the hydrogen embrittlement in the Nb–Ti–Ni system.
5. Summary and Conclusion
Hydrogen-induced structural changes in three types of Nb– Ti–Ni alloys on the straight line connecting the eutectic point and the primary phase, i.e., the only eutectic phase (Nb,Ti) + TiNi}, the eutectic + the primary phases {bcc-(Nb,Ti) + TiNi} + {bcc-(Nb,Ti) and the only primary phase bcc-(Nb,Ti) have been investigated by the in-situ X-ray
diffraction (XRD) at 0.5 MPa H2. These alloys absorb
hydrogen in solid solution, but do not form the Nb hydride
between 423 and 673 K. Hydrogen permeability is
measurable in the former two type of alloys, but is immeasurable in the third types of the alloy with the primary phase.is measurable in the Nb-rich Nb–Ti–Ni alloys on the above-mentioned straight line. increases with increasing Nb content and the amount of the primary phase. The present work demonstrates that the hydrogen permeable alloys are extended to the Nb-rich side on the above-mentioned straight line. The most Nb-rich Nb68Ti17Ni15 alloy, consisting of the
26 vol% eutectic phase and the 74 vol% primary phase,
shows the highestof4:9110 8(mol H2m 1s 1Pa 0:5)
and that the eutectic phase is essential for the suppression of the hydrogen embrittlement.
Acknowledgements
This work has been supported in part by a Grant-in-Aid for Scientific Research (B) of Japan Society for the Promotion of Science (JSPS), by a Grant-in-Aid for Exploratory Research of Ministry of Education, Culture, Sports, Science and Technology (MEXT) and by Industrial Technology Research Grant Program in ’04 from New Energy and Industrial Technology Department Organization (NEDO) of Japan.
REFERENCES
1) E. Kikuchi: Catalysis Today56(2000) 97–101.
2) V. Z. Mordkovich, Y. K. Baichtock and M. H. Sosna: Platinum Metals Rev.36(1992) 90–97.
3) C. Nishimura, M. Komaki and M. Amano: Mater. Trans., JIM 32
(1991) 501–507.
4) R. E. Buxbaum and A. B. Kinney: Ind. Eng. Chem. Res.35(1995) 530– 537.
5) C. Nishimura, M. Komaki, S. Hwang and M. Amano: J. Alloys Compd.
330–332(2002) 902–906.
6) Y. Zhang, T. Ozaki, M. Komaki and C. Nishimura: Scr. Mater.47
(2002) 601–606.
7) T. Ozaki, Y. Zhang, M. Komaki and C. Nishimura: Int. J. Hydrogen Energy28(2003) 1229–1235.
8) Y. Zhang, T. Ozaki, M. Komaki and C. Nishimura: J. Membrane Sci.
224(2003) 81–91.
9) K. Hashi, K. Ishikawa, T. Matsuda and K. Aoki: J. Alloys Compd.368
(2004) 215–220.
10) K. Hashi, K. Ishikawa, T. Matsuda and K. Aoki: Mater. Trans. 46