“Optimization of solar power generation efficiency using MINITAB software” By
Madhab Chandra Jena
Guided by: Krutibash Khuntia (Asst. Professor) and Mr. Kailash Mohapatra( Professor and Head, Deptt. Of Mech. Engg,Raajdhani Engg. College,Bhubaneswar)
ABSTRACT
Non-polluting renewable energy resources to limit the green house gases (GHG) impact on environment is receiving impetus worldwide and also from the government of India. The solar mission, which is part of the National Action Plan on Climate change has been set up to promote the development and use of solar energy for power generation and other uses. The ultimate objective of making solar energy more effective and usable every walk of life to the limited fossil-based energy options. The solar power generation system had been deployed in the various parts in the country for electrification where the grid connectivity is either not feasible or not cost effective as also some times in conjunction with diesel based generating stations in isolated places, communication transmitters at remote locations. With the downward trend in the cost of solar energy and appreciation for the need for development of solar power, solar power projects have recently been implemented. A significant part of the large potential of solar energy in the country could be developed by promoting grid interactive solar power systems of varying sizes as per the need and affordability coupled with ensuring adequate return on investment (ROI).Normally the payback period of any solar power generation unit is very high i.e. more than 10 years. It is important that the generation efficiency must be optimum for achieving the goal of a green globe through the renewable energy generations. So that it would be practically feasible and economical to install the renewable energy generation stations. This study is a step towards achieving the goal of optimum power generation efficiency of solar power plants and to enhance the use of the technology.
INTRODUCTION 1.1. Renewable energy
Renewable energy is generally defined as energy that comes from resources which are naturally replenished on a human time scale such as sunlight, wind, rain, tides, waves and geothermal heat. Renewable energy replaces conventional fuels in four distinct areas: electricity generation, hot water/space heating, motor fuels, and rural (off-grid) energy services.
About 16% of global final energy consumption presently comes from renewable resources, with 10% of all energy from traditional biomass, mainly used for heating, and 3.4% from hydroelectricity. New renewables (small hydro, modern biomass, wind, solar, geothermal, and biofuels) account for another 3% and are growing rapidly. At the national level, at least 30 nations around the world already have renewable energy contributing more than 20% of energy supply. National renewable energy markets are projected to continue to grow strongly in the coming decade and beyond. Wind power, for example, is growing at the rate of 30% annually.
Renewable energy resources exist over wide geographical areas, in contrast to other energy sources, which are concentrated in a limited number of countries. Rapid deployment of renewable energy and energy efficiency is resulting in significant energy security, climate change mitigation, and economic benefits. In international public opinion surveys there is strong support for promoting renewable sources such as solar power and wind power.
While many renewable energy projects are large-scale, renewable technologies are also suited to rural and remote areas and developing countries, where energy is often crucial in human development. United Nations' Secretary-General Ban Ki-moon has said that renewable energy has the ability to lift the poorest nations to new levels of prosperity.
1.2. Solar Electrical energy-
There are broadly two ways of generating electrical energy from solar power; the thermal route and direct conversion route through photovoltaic. There are two basic types of thermal power stations: power tower and parabolic trough collector. This thesis is based on solar photovoltaic system.
As shown in the figure 1.1 direct conversion of solar energy to electricity takes place through photoelectric effect. The photo electric or photovoltaic effect is the process in which the two dissimilar materials in close contact produce an electrical voltage when struck by light or radiant energy. Discrete packets of light energy known as photons, strike the photovoltaic cell, knocking the electrons in the silicon material out of their normal energy state, putting them in a position to be conducted as electricity. A solar photovoltaic (PV) system is made up of solar PV panels, an inverter, racking and
Fig-1.1, Basic working principle of solar cell
1.3. Solar Photo voltaic Panels/Modules
As an individual solar cell only generates a low voltage, approx 0.5V, a number of cells are wired together to form a solar panel or 'module' that can generate anything between 80–240 watts.
A number of solar cells electrically connected to each other and mounted in a support structure or frame is called a photovoltaic module. For an example: A 292W Solar Module consist of 72 Cells and an array of module has typically 4 to 25 modules connected in series. All the combinations are shown in the figure 1.2.
Fig-1.2, Cell, module & array
1.3.1. Construction & Technology for Solar cells
Solar cells can be made from a number of semi-conducting materials. A semi-conducting material is one that has a limited capacity for conducting an electrical current and those used in solar cells are all uniquely suited to producing electricity from sunlight - the photovoltaic effect. When light shines on the cell it creates an electric field across the layers. The stronger the sunshine, the more electricity is produced.
The performance of a solar cell is measured in terms of its efficiency at turning solar radiation or 'sunlight' into electricity. A typical solar cell has efficiency no greater than 13 - 19% as only a portion of the sunlight energy spectrum can be converted into electricity and much of the sunlight is reflected or absorbed by the materials that make up the cell.
As an individual solar cell only generates a low voltage, approx 0.5V, a number of cells are wired together to form a solar panel or 'module' that can generate anything between 80–240 watts.
1.3.2. Crystalline Technology
Crystalline silicon (c-Si) has been used as the light-absorbing semiconductor in most solar cells, even though it is a relatively poor absorber of light and requires a considerable thickness (several hundred microns) of material. Nevertheless, it has proved convenient because it yields stable solar cells with good efficiencies and uses process technology developed from the huge knowledge base of the industry.
Two types of crystalline silicon are used in industry. The first is mono crystalline, produced by slicing wafers (up to 150mm diameter and 350microns thick) from a high-purity single crystal. The second is multi crystalline silicon, made by sawing a cast block of silicon first into bars and then wafers. The main trend in crystalline silicon cell manufacture is toward multi crystalline technology.
1.3.3. Thin Film technology
The selected materials are all strong light absorbers and only need to be about 1micron thick, so materials costs are significantly reduced. The most common materials are amorphous silicon (a-Si, still silicon, but in a different form), or the polycrystalline materials: cadmium telluride (CdTe) and copper indium (gallium) diselenide (CIS or CIGS). Each of these three is amenable to large area deposition (on to substrates of about 1 meter dimensions) and hence high volume manufacturing. The thin film semiconductor layers are deposited on to either coated glass or stainless steel sheet.
Amorphous silicon is the most well developed of the thin film technologies. Better stability requires the use of thinner layers in order to increase the electric field strength across the material. However, this reduces light absorption and hence cell efficiency. With high solar conversion efficiency and area efficiency crystalline technology is preferred Solar PV technology for this project. On top of that crystalline technology is very much standard in industry today and many sources are available for supply.
1.3.4. Characteristics of different Solar PV Technology
Table- 1.3.1
Technology Crystalline Silicon Thin Film
Types of Technology
Mono-crystalline silicon (c-Si) Poly-crystalline silicon (pc-Si/ mc-Si)
Amorphous silicon (a-Si) Cadmium Telluride (CdTe) Copper Indium Gallium Selenide (CIG/ CIGS)
Organic photovoltaic (OPV/ DSC/ DYSC)
Voltage Rating (Vmp/ Voc) (Higher is better as there is less gap in Voc and Vmp)
80%-85% 72%-78%
Temperature Coefficients Higher
Lower
(Lower is beneficial at high ambient temperatures)
Module efficiency 13%-19% 4%- 12%
Mounting systems Industry standard
Special clips and structures may be needed. In some cases labor cost is significantly saved
DC wiring Industry standard May require more number of
circuit combiners and fuses
Application Type Residential/ Commercial/ Utility Commercial/ Utility
Required Area Require smaller space for given project size
Require up to %50 more space for a given project size
1.4. Installation Configurations
When considering the installation of a solar PV system, there are several configurations that can be selected. There are stand-alone or off-grid solar PV systems, a utility connected system (on-grid or grid system), and a hybrid solar PV system (a combination of both an off-grid and an on-grid configuration) to choose from. The choice of an installation configuration is dependent on the user needs, applications, and objectives. Details of each configuration are shown in Table 1.2
Fig 1.2, Grid interactive PV system without battery back-up
1. 4.1. On-Grid Solar Power System
An on-grid solar PV system essentially uses the existing commercial utility system for power and does not store electrical power. A grid connected solar PV system is shown in Figure 1.3. A solar PV system is installed into the electrical system of a home or facility for use during daylight hours or when grid power is down. It also works the other way, when the solar PV system does not produce enough electricity, it can draw power from the grid. When using the solar PV system, if more electricity is produced than what is needed the excess can be put back on the grid. This is done automatically through a device that monitors the available power and switches between solar and grid power. A second utility meter can be added to keep track of how much electricity has been put back on the grid. Advantages of grid interconnection include having uninterrupted access to standard utility power and avoiding the cost of a battery back-up system. A disadvantage is the utility interconnection
Fig. 1.3, On-Grid Solar Power System
1.4.2. Off-Grid Solar Power System
An off-grid or stand-alone solar PV system is independent of the utility grid, see Figure 1.4. Electricity from a stand-alone system is only used at the site of installation. The generated power is stored in batteries and used as needed. A typical U.S. off-grid house using a solar PV system is usually rated at 3 kilowatts (kW) or 15-kWh/day and provides power only for essential devices. The advantages of an off-grid system are freedom from the commercial utility system and in the long-run lower electrical cost. The disadvantages are limitation on power consumption, which is dependent on the, capacity of the battery bank to supply electrical power during bad weather days, and being self-sufficient on power.
Fig-1.4, Off-Grid Solar Power System 1.4.3. Hybrid Solar Power System
A combination of an on-grid and off-grid solar PV system has the advantages of both. A hybrid system is connected to the utility grid in case of poor weather or night use, but also has a battery bank to store electricity in case utility grid power is lost. The design and installation of hybrid systems is more complicated and expensive, but they are the most effective in providing constant, reliable electricity. Figure 1.5 depicts a hybrid solar PV system.
1.5. Solar cell efficiency-solar cell efficiency is the ratio of the electrical output of a solar cell to the
incident energy in the form of sunlight. The energy conversion efficiency (η) of a solar cell is the percentage of the solar energy to which the cell is exposed that is converted into electrical energy. This is calculated by dividing a cell's power output (in watts) at its maximum power point (Pm) by the input light (E, in W/m2) and the surface area of the solar cell (Ac in m2).
Efficiency=Pm/ (E x Ac)
By convention, solar cell efficiencies are measured under standard test conditions (STC) unless stated otherwise. STC specifies a temperature of 25 °C and an irradiance of 1000 W/m2 with an air mass 1.5 (AM1.5) spectrums. These conditions correspond to a clear day with sunlight incident upon a sun-facing 37°-tilted surface with the sun at an angle of 41.81° above the horizon. This represents solar noon near the spring and autumn equinoxes in the continental United States with surface of the cell aimed directly at the sun. Under these test conditions a solar cell of 20% efficiency with a 100 cm2 (0.01 m2) surface area would produce 2.0w.
1.6. Solar cells and energy payback
The energy payback time is defined as the recovery time required for generating the energy spent for manufacturing a modern photovoltaic module. By some estimates, it is typically from 1 to 4 years depending on the module type and location. With a typical lifetime of 20 to 30 years, this means that, if these estimates of manufacturing energy are reliable, modern solar cells would be net energy producers, i.e. they would generate more energy over their lifetime than the energy expended in producing them. Generally, thin-film technologies - despite having comparatively low conversion efficiencies - achieve significantly shorter energy payback times than conventional systems (often < 1 year).
Crystalline silicon devices are approaching the theoretical limiting efficiency of 29.4%and achieve an energy payback period of 3-4 years.
However, solar cell manufacture is dependent on and presupposes the existence of a complex global industrial manufacturing system. This comprises not only the fabrication systems typically accounted for in estimates of manufacturing energy, but the contingent mining, refining and global transportation systems, as well as other energy intensive critical support systems including finance, information, and security systems. The uncertainty of that energy component confers uncertainty on any estimate of payback times derived from that estimate, considered by some to be significant.
EXPERIMENTAL WORK
2.0-Objective of research work and components required for research
The research is on optimization of solar power generation efficiency. The study is carried out to find out the power output of fixed solar array and movable or manual solar tracking PV array. Both the power output trends to be plotted on the MINITAB and the optimization zone is to be traced out. The main factors which affect the solar cell efficiency are irradiance and temperature. The power output with different irradiance and temperature are also traced out in first phase of the study by the help of MINITAB. The various components used for this study are – portable solar panels, inverter and battery bank, multimeter, solar radiation meter, radiation thermometer, tong tester etc.
The research is carried out in Munger. India. The details of the location are as under:
State Bihar
Locality Munger
Latitude 25.4 N
Fig. 2.1, Location and site layout
2.1. Weather and radiation data of Munger
Tables 2.1.1. Monthly Averaged Insolation Incident on a Horizontal Surface (kWh/m2/day)
Jan Feb Mar Apr May Jun Jul Aug Sep Oct Nov Dec Annual Average 4.2 5.29 6.27 6.85 6.74 5.58 4.49 4.51 4.24 4.9 4.71 4.07 5.15
Tables 2.1.2. Minimum and Maximum Difference From Monthly Averaged Insolation (%)
Jan Feb Mar Apr May Jun Jul Aug Sep Oct Nov Dec Minimum (%) -19 -11 -9 -8 -15 -21 -14 -16 -13 -17 -10 -21
Tables 2.1.3.Minimum And Maximum Air Temperature at 10 m above The Surface of the Earth
Jan Feb Mar Apr May Jun Jul Aug Sep Oct Nov Dec Annual Average Avg 17.3 20.6 25.4 27.5 27.5 28 27.6 27.5 26.4 24.3 21.7 18.5 24.4 Min 12.1 15.4 20 22.9 24.1 25.5 25.3 25.2 24.1 21.1 17 13.6 20.5 Max 22.7 25.8 30.5 32 30.9 30.6 29.9 29.8 28.9 28.1 27 24.1 28.4
Tables 2.1.4.Monthly Averaged Wind Speed At 50 m Above The Surface Of The Earth (m/s)
Jan Feb Mar Apr May Jun Jul Aug Sep Oct Nov Dec Annual Average 2.22 2.68 2.69 3.39 3.76 3.71 3.13 2.7 2.52 2 1.99 2.09 2.73
2.2. Solar position at Munger
The position of the sun in the sky is critical in order to ensure system design which maximizes energy output. Fig. 2.2. Shows the position of the sun in the sky in terms of azimuth (direction N, E etc) and altitude angles (angle with respect to horizontal). It can be seen that majority of the time the sun is in the southerly direction, hence the fixed PV modules are oriented to the south to utilize majority of solar radiation and achieve higher output.
2.3. - Equipments used for research:
The various equipments used for this research are
1. Solar plate
2. Infrared thermometer 3. Multimeter
4. Battery with inverter 5. Radiation meter 6. Tong tester 7. compass
Tong tester
Infrared
Thermometer
Multi-meter
Battery with inverter
Radiation Meter
Solar
Panel
Fig.2.3. - Tools and Equipments used for research
2.4. Effect of Irradiance and Temperature on power generation
The term Irradiance is defined as the measure of power density of sunlight received at a location on the earth and is measured in watt per meter square. Whereas irradiation is the measure of energy density of sunlight .The term Irradiance and Irradiation are related to solar components. As the solar insolation keeps on changing throughout the day similarly I-V and P-V characteristics varies. With the increasing solar irradiance both the open circuit voltage and the short circuit current increases and hence the maximum power point varies. Temperature plays another major factor in determining the solar cell efficiency. As the temperature increases the rate of photon generation increases thus reverse saturation current increases rapidly and this reduces the band gap. Hence this leads to marginal changes in current but major changes in voltage. The cell voltage reduces by 2.2Mv per degree rise of temperature. Temperature acts like a negative factor affecting solar cell performance. Therefore solar cells give their full performance on cold and sunny days rather on hot and sunny weather. Now a day’s Solar panels are made of non-silicon cells as they are temperature insensitive. Thus the temperature remains close to room temperature.
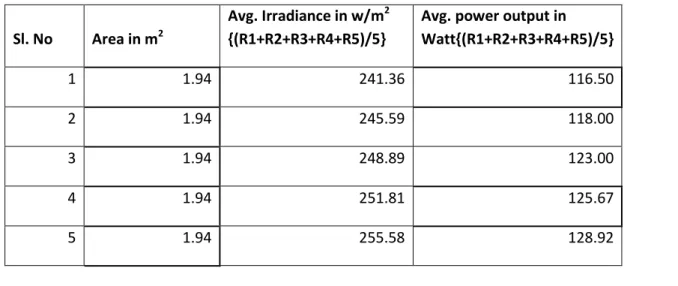
2.4.1. Effect of irradiance on power output: The research carried out by taking the readings of
irradiance and the corresponding power output in the portable solar array as mentioned earlier. The results are traced in the Table 2.4.1 and in the Figure 2.4.1.Total ten sets of readings of irradiance with corresponding power output are taken in different times. In each set 5 readings are averaged out for final calculation.
Table 2.4.1, Power output at various solar irradiance
Sl. No Area in m2
Avg. Irradiance in w/m2 {(R1+R2+R3+R4+R5)/5}
Avg. power output in Watt{(R1+R2+R3+R4+R5)/5}
1 1.94 241.36 116.50
2 1.94 245.59 118.00
6 1.94 259.04 132.17
7 1.94 262.51 135.42
8 1.94 265.97 138.67
9 1.94 269.44 141.92
10 1.94 272.90 145.17
Fig. 2.4.1. Power output vs. irradiance (from MINITAB)
2.4.2. Effect of temperature on power output: The research carried out by taking the readings of
temperature and the corresponding power output in the portable solar array as mentioned earlier. The results are traced in the Table 2.4.2 and in the Figure 2.4.2. Total ten sets of readings of temperature with corresponding power output are taken in different times. In each set 5 readings are averaged out for final calculation.
y = 0.937x - 110.5 R² = 0.996 0 20 40 60 80 100 120 140 160 235 240 245 250 255 260 265 270 275 Irradiance in watt/m2
Table-2.4.2, Power output at various temperatures
Sl. No. Avg. Temperature in Degree Centigrade {(R1+R2+R3+R4+R5)/5}
Avg. power output in watt {(R1+R2+R3+R4+R5)/5} Remarks 1 25 154 2 27 162 3 32 168 4 35 172 5 40 185 6 43 199.32 7 46 195.65 8 47 192 9 45 196.95 10 48 187.74 0 50 100 150 200 250 25 26 27 28 29 30 31 32 33 34 35 36 37 38 39 40 41 42 43 44 45 46 47 48 Po w e r in w att Temperature in 0C
2.5. Research on Movable (Solar tracking) Photovoltaic Array to increase efficiency of Solar Cells.
Photovoltaic converters are important converters for the application of renewable energy sources because of the direct conversion of solar energy to electric energy. They have some advantages such as low weight and feasibility of small scales, but they are more expensive compared to other types of energy converters. Therefore, it is important to absorb the maximum solar energy in order to increase the efficiency of the energy converter. Because of the daytime motion of the sun, sunlight always radiates indirectly on solar arrays and some part of the light is reflected from the surface of the solar cells where incomplete absorption of the solar energy occurs. Using the movable solar array or solar tracker is one method to increase the output electric energy of photovoltaic converters. This can be done in such a way that the photovoltaic arrays follow the sun continuously in daytime and sunlight can be radiated to solar cells directly where maximum electric energy can be generated. This paper discusses the implementation of the movable array in photovoltaic converter and its effect on increasing the output power characteristics compared to the fixed array with the same nominal power. Finally the test results are shown and discussed in the paper. Solar energy is one type of the renewable energy sources which can be converted easily and directly to the electric energy by Photovoltaic converters. The process of no movable mechanisms to convert solar energy to electric energy is called photovoltaic phenomena. Whereas the conversion device is called solar cell. Solar cells convert the energy of light's photons to electric energy with efficiency between 5 to 25 percent without using thermodynamic cycle or active fluid. Solar cells can be light collector directly or can use light concentrators like mirror or convex lens. This photovoltaic converter is a developed energy converter with the advantages such as: relevant design and installation, silent energy conversion, long life time with less maintenance requirement, easy transportation and light weight. But in compare with other types of energy converters like diesel generator it is more expensive. Therefore, the optimum operation and the maximum energy absorption from solar cells are important factors. Due to the high cost of the solar array, the angle between solar radiation and collector surface affects on the energy absorption, it is important to provide some conditions to absorb the maximum solar energy and then convert it to electric energy for optimum converter operation. Because of the low efficiency of the solar cells (less than 12%) and due to the high price of them in compare with other energy converters, it is important to convert and absorb the maximum electric energy from the PV-array. Using movable photovoltaic array to follow the sun during the day and providing a condition in that the solar light directly radiates on the solar cells will optimize energy conversion. In this paper, the power-voltage characteristics of a movable photovoltaic array are compared with a fixed one during a summer day.
Fig. 2.5, Solar path viewed from Munger
2.5.1- Standard Characteristics of the Movable PV-Array.
The test is carried out with the help of two solar plates one is movable type another is fixed types as shown in the figure 2.5.1
Maximum Power 188.8 watts No Load Voltage 30.8 (V)
Voltage in Maximum Power Point 28.7 (V) Short Circuit Current 6.8 (A)
(a) Fixed installed solar plate
(B) Movable Solar plate (hinged type) Fig.2.5.1, solar plates used for research
2.6. Comparison Characteristics of Movable and Fixed Arrays during the Day
The experiment was performed in May and the first comparison curve was available at 9:00 AM because of the installation situation of the movable array and the fixed array. The output power characteristics of these arrays are shown in table 2.6 and Fig.2.6 extracted from MINITAB. Because the movable array is directly faced to the sun, it generated more electric power and its peak power is higher than fixed array. In this study we assumed that the maximum power can be obtained by a maximum power point tracker (MPPT). Total ten sets of readings of temperature with corresponding power output are taken at same time in different days. In each set 5 readings are averaged out for final calculation.
Table 2.6, output power measurement and comparison
Test results of measuring the output power
Sampling time
Avg. Energy in Movable type{(d1+d2+d3+d4+d5)/5}
Avg. Energy in fixed type{(d1+d2+d3+d4+d5)/ 5} Incremen t rate (%) Remarks 9:00 115.0 75.0 53.3 10:00 113.3 97.5 16.2 11:00 119.0 109.2 9.0 12:00 119.7 114.7 4.4 13:00 118.1 116.3 1.5 14:00 118.6 111.9 6.0 15:00 117.1 97.9 19.6 16:00 111.7 77.4 44.3 17:00 105.4 57.3 83.9 18:00 99.0 32.3 206.5
Figure 2.6, power output Fixed and movable array with optimized zone (from MINITAB)
0
20
40
60
80
100
120
140
09:00 10:00 11:00 12:00 13:00 14:00 15:00 16:00 17:00 18:00En
e
rg
y
in
W
h
r
Time
Energy in Movable type Energy in Fixed TypeConclusion
In the first phase of this study we found that at increasing irradiance level the power output is always more. So the location of solar panel is to be selected in such a way that the highest solar irradiance should fall on the panels for maximum power output. With the increase in temperature the rate of photon generation increases thus reverse saturation current increases rapidly and this results on reduction in band gap. Hence this leads to marginal changes in current but major changes in voltage .As in Munger most of the times the ambient temperature is below 45 degree centigrade so no additional cooling system is required. But the locations where the temperature above 45 degree the additional cooling system can be used to increase the energy conversion efficiency.
Due to the high cost of photovoltaic modules, it is necessary to absorb the maximum energy from the PV-array and reduce the cost of generated electric energy. Because of the high dependency of the generated power of a PV-array to the sun light angle, one proper way for optimum operation of the photovoltaic converter is to use a movable PV array as studied from second phase of this research. The test result shows that using a PV-array with sun tracking capability can increase the absorbed energy more than 27% in compare with the fixed PV-array. Also, this type of array can supply the electric energy with small variation and better power quality during the day. Moreover, the motion of the tracking structure for a small period of time (45 minutes in day) consumes a small amount of energy (less than 10 watt-hours) to follow the sun path in the sky where the total efficiency of the converter is high. Investigation of the cost of the movable array and its effect on the energy price can be analyzed in another research study. This research study also shows that if the movable structures are used in a large scale in a solar power plant, a significant amount of energy will convert to electric energy in compare to the fixed arrays. The increased investment due to the usage of movable PV-arrays and their maintenance will be justified due to increasing of the output power. Notice that manufacturing of the structure in large amount will reduce the cost. Therefore, this type of trackers can be manufactured, used, and serviced in solar power plants with lower cost.
In the above study mainly the research carried out for optimization of generation efficiency. It is
concluded that the movable type solar power generation system is more efficient than the conventional system. The payback period of the second type of project should be lower than the conventional systems. So it is recommended for any new installations to have this type of system and also the existing system can be retrofitted to the efficient one.
In the observation table we found that at increasing irradiance level the power output is always more. So the location of solar panel is to be selected in such a way that the highest solar irradiance should fall on the panels for maximum power output. With the increase in temperature the rate of photon generation increases thus reverse saturation current increases rapidly and this results on reduction in
REFERENCES
1. India Solar Resource,NREL,Solar energy centre,Govt of India.2012
2. Curtis Austin, Ralph Borja, and Jeffery Phillips : A Study Examining Photovoltaic (PV) Solar Power as an Alternative for the Rebuilding of the Iraqi Electrical Power Generation Infrastructur: June 2005
3. Shaheer M. Hussam: Design and Implementation of a Solar Power System in Rural Haiti
4. Frimpong opoku: Feasibility study of solar thermal electric – power generation in northern Ghana. 5. Li jingcheng: Application of solar energy.
6. Wajid Muneer: Large-Scale Solar PV Investment Planning Studies.
7. Joshua David Bollinger: Applications of Solar energy to power stand-alone and street lighting.
8. Hassan Moghbelli and Robert Vartanian :Implementation of the Movable Photovoltaic Array to Increase Output Power of the Solar Cells
9. J. Rizk, and Y. Chaiko: Solar Tracking System: More Efficient Use of Solar Panels
10. Phil Gauthier, Tom Gulo, Greg McCarthy, Erik Oliver, and Josh Price :Improvement of Efficiency of Solar Cell
11. Project report on solar panel installation - Insolare Energy pvt. Ltd, Chennai 12. http://timezonedb.com/