Munich Personal RePEc Archive
Determinants of commercial bank
profitability in Mexico
Chavarín, Rubén
Universidad de Guadalajara
30 June 2015
Determinants of Commercial Bank Profitability in Mexico
1Abstract
The aim of the present work is to identify the main determinants of profitability for
commercial banks established in Mexico. A data base of 45 banks representing virtually the
whole world of commercial banking in the period 2007-2013 was used. Dynamic models
using Arellano-Bover/Blundell-Bond estimators with an error that follows an MA(1)
process were employed along with static models having random effects and
Hausman-Taylor estimator. Findings suggest that the profitability of commercial banking is sustained
by the level of capital, the charging of commissions and fees, and control of operating
expenses, as well as certain market entry barriers and obstacles to competition that provoke
a relatively high persistence of profitability.
JEL classification: G21, C23, L13, O54
Keywords: Bank profitability, Dynamic panel-data, Latin America
1. Introduction
An efficient commercial banking system supports the operation and growth of
companies, as well as the formation of new businesses and, in a wider sense, can contribute
to economic growth and development (Aghion et al., 2005; Levine, 2005). However, its
potential as a driving force of the economy is not always realized, as the banks sometimes
restrict the issue of credit too much, or on other occasions, assume risks that can affect their
1
I wish to thank two anonymous referees for helpful comments. The usual disclaimer applies. I also thank to
performance. In both situations other economic agents are harmed and the influence of the
banks on the rest of the economy reverses from positive to negative.
The operation of commercial banks implies a relation of equilibrium between risks,
liquidity and diversification, which the banks themselves can modify, but there are also
other market and macroeconomic factors whose influence is external to decisions taken by
the banks. The functions of determinants of bank profitability are important because they
reveal the interaction between these internal and external factors, and show the key
elements supporting the performance of the banks. The more we know about the function
of profitability in a banking system, the better we shall be able to identify certain patterns
that determine its functioning and its effects on the rest of the economy.
During the last twenty years, the international academic community has maintained a
constant interest in the study of bank profitability, and this has produced an extensive
literature reviewing different countries separately, as well as various groups of banking
systems. However, Latin America has been studied very little as a region or by individual
country. The case of Mexico is no exception, as studies of this subject are few and have
certain drawbacks in their econometric estimates, as well as having been produced some
years back.
Further, recent studies have explored whether the profitability of commercial banks
depends on the level of economic development of the countries where they operate, and
their findings suggest that there is indeed a differentiated impact not only on their
profitability but also on the determining factors (Dietrich and Wanzenried, 2014). For
example, low-income countries may have greater rates of capitalization than countries with
higher incomes, but in the former this variable does not turn out to be significant for
of the function of bank profitability in one country makes it possible to set up comparisons
with the findings obtained by research projects conducted on groups of economies, and in
this way possible similarities with other banking systems can be identified.
The aim of the present work is to make an estimate of the function of profitability for
commercial banks established in Mexico, in order to identify the principle determinants of
their profitability, over a period of study that allows an analysis of the present state of the
banking system. The period to be studied is specifically that of 2007-2013, which happens
to be an interesting period, as the banking system of this country seems to have stabilized
by then into a situation of co-existence between foreign owned banks that dominate the
market, along with banks of different sizes linked to business groups with national capital,
and a third set of banks, almost all of them small, some national, some foreign, that occupy
some niche in the market. It is important to know what function of profitability explains
this phenomenon.
Also, studying the function of profitability helps to deepen our knowledge of several
distinctive features of the commercial banking system in Mexico. For example, in the first
place, some scholars have pointed out that the problem with the banks established in this
country is in their scanty provision of credits, especially for financing business projects
(Hernández and Villagómez, 2012). The same problem has been recognized (in particular
with regard to medium and small sized companies) recently by the agency that regulates
economic competition in Mexico (Comisión Federal de Competencia Económica, 2014).
Secondly, as explained in Section 3, a number of authors have suggested that there is
significant market power in the banking industry (Arteaga, 2001; Rodríguez 2003; Guerrero
and Villalpando, 2009; Garza-García, 2012). Thirdly, in previous years the financial
that they had identified inappropriate practices that were harming economic competition
and obstructing the inclusion of certain segments of the population in the financial system
(Banco de México, 2010); however, public perception is that the banks are still profiting
from making excessive charges, so much so that as part of the financial reform passed at
the end of 2013, the central bank was given the authority to limit the charging of fees.2 In
the fourth place, other authors have stressed that one of the main features of contemporary
banking in Mexico is the strength of its levels of capitalization, which is a consequence of
the establishment of foreign banks in the country around 15 years ago (Castañeda, 2014).
On the basis of these features, the central question of the present study is whether the
commercial banks established in Mexico base their profits on charging commissions and
aspects having to do with the lack of competition, or is it variables such as the level of
loans granted and the level of capitalization that are of greater relevance? The contribution
of the present study is its inclusion in the research of the various factors that explain the
profitability of the commercial banks from a point of view seldom explored in the empirical
literature on Mexico, which include estimation techniques that allow the drawbacks
presented by previous researches to be overcome.
Section 2 summarizes some of the elements that are characteristic of the present system
of commercial banks in Mexico, elements that help with understanding in greater depth the
findings presented in later parts of the study. Section 3 provides a review of literature on
bank profitability, and calls attention to the most representative studies on the subject, as
well as those conducted for the Latin American region and Mexico. Section 4 explains the
data base and the estimation models; it also provides the descriptive statistics and the
2
correlations between variables. Section 5 gives the econometric findings. Section 6 presents
the conclusions.
2. The make-up and qualities of present day banking in Mexico
Concentrating our attention on the Mexican financial system, the principle effect of the
banking crisis of the mid 1990s was a change in the ownership of the biggest banks of the
system, which passed to foreign financial groups.3 The first of these banks to pass into the
hands of foreign shareholders were Bancomer, acquired by BBVA, and Serfin, purchased
by Santander; both in the year 2000. The last was Bital, acquired by HSBC in the year
2002. The 5 big banks included in this move had 77 percent of all the assets of the system
in 2002.4 In 2007, the same banks had 73 percent of the assets. In the period of 2002 to
2006, few new banks came into the market, but in 2007-2008, 13 new banks came in, some
of them linked to business groups with national capital, and others related to consumer
goods businesses, whose capital was foreign.
The process of mergers and takeovers and the arrival of new banks contributed to giving
the commercial banking system in Mexico a new shape, and it came to consist of banks
operating domestically that are subsidiaries of foreign banks, a set of fifteen banks that
3
The commercial banks in Mexico were State-owned from 1982-1991. In 1992 the process of privatizing the
commercial banks concluded with their being owned by Mexican shareholders. A macroeconomic crisis
started in 1994 (and led to the Tequila effect) and soon afterwards presented itself as a banking crisis which
led to government intervention in several banks and the de-capitalizing of the system, which opened the door
for the majority of the big banks of the system to be sold to foreign financial groups.
4
These 5 banks were: Banamex, Bancomer (which became BBVA Bancomer), Bital (HSBC), Inverlat
belong to Mexican business groups,5 and another set, of over 20 banks, that operate in
specific niches, some of them national and some of them foreign owned.
This composition of the system was consolidated in recent years and did not suffer
alterations in the international financial crisis of 2008-2009. Although this crisis did reduce
economic growth in Mexico, it did not have a direct impact on the banking system of the
country; the impacts were in fact indirect, coming through economic activity, and no bank
was at risk of collapsing and only two reported considerable losses. However, the indicators
of profitability did see their tendency of growth from previous years interrupted (see Figure
1).
INSERT FIGURE 1 ABOUT HERE
One of the reasons why the international financial crisis did not have destabilizing
effects on the commercial banks established in Mexico was the experience of a national
banking crisis in the 1990s. This crisis led to the federal government’s clearing the loan
losses of several banks and also motivated greater capitalization and less exposure to credit
risks by the banks in the system (see Figure 2). However, the relative solidity of the
commercial banks has also been accompanied by significant market concentration,6 as well
as certain practices such as restricting credit and maintaining large spreads between active
and passive interest rates, especially in the consumer credit market.
INSERT FIGURE 2 ABOUT HERE
5
This set of banks can be seen in Chavarín (2012), p.15.
6
The concentration, measured by the Herfindahl index, of assets, loans and customer deposits has shown
levels a little under 1,500 points during the period of study. However, measured by the dominance index, it
has been above 2,500 in every case, which according to the regulating body in Mexico (la Comisión Nacional
3. International evidence on the determinants of bank profitability
According to Berger (1995), from a theoretical point of view, the relations between bank
profitability and other variables may be understood on the basis of a basic model of capital
markets during one period, with perfect and symmetrical information. As other periods are
taken into consideration and the assumptions of information are relaxed, variants of the
model can be established, in such a way as to make it possible to interpret empirical
findings that do not necessarily meet the expectations raised by the basic model where all
assumptions are fulfilled.7
From an empirical point of view, the first studies on the determinants of bank
performance centered on factors that were liable to be influenced by those exercising
control over the banks and managing them. Some of these are the level of capitalization, the
amount of deposits, loans given, the quantity of provision for loan losses, a mix of income
sources, operating costs, etc. In the course of time factors of this kind came to be called
“internal”, to distinguish them from other elements, of an external type, that were
incorporated into the functions of profitability. External factors refers especially to market
factors such as concentration, but the expression also serves to designate certain variables
of regulation or of an institutional type that have been incorporated into some studies. More
recently it has become a common practice to include macroeconomic factors, which allude
to variables like inflation or economic growth. There is a wealth of literature that assigns
great importance to these three kinds of factor in making better estimates of the functions of
bank profitability.
7
The work of Berger (1995) concentrates in particular on the relation between profitability and the ratio of
As noted previously, in the last two decades the international academic community has
produced an extensive literature on this subject. However, the origins of this kind of
research can be traced back to the works of Hester and Zoellner (1966), Haslem (1968),
Short (1979), Bourke (1989) and other researchers.8 Other important works that study the
cases of individual countries are those of Berger (1995), De Young and Rice (2004), Hirtle
and Stiroh (2007), Park and Weber (2006), Athanasoglou et al. (2008), and Dietrich and
Wanzenried (2011). The first three studies focus on the case of the United States; the last
three on South Korea, Greece and Switzerland, respectively.
In all the profusion of works on the subject, there are a number of studies that have
looked at groups of countries, and among these the following stand out: Molyneux and
Thornton (1992) analyzed 18 European countries in the period 1986-1989. Demirgüç-Kunt
and Huizinga (1999) studied 80 developed and developing nations in the period 1988-1995.
Goddard et al. (2004) analyzed the 5 most developed banking systems in Europe in the
period 1992-1998. Staikouras and Wood (2004) studied 13 developed countries of Europe
in the period 1994-1998. Athanasoglou et al. (2006) analyzed 7 developing countries of
South-East Europe in the period 1998-2002. Micco et al. (2007) studied 179 countries for
the period 1995-2002. Flamini et al. (2009) analyzed banks from 41 countries in
sub-Saharan Africa in the period 1998-2006. Ben Naceur and Omran (2011) studied 11
countries of the Middle East and Northern Africa in the period 1988-2005. Bolt et al.
(2012) studied 19 OECD countries in the period 1990-2007. Lee et al. (2014) analyzed 22
countries in Asia in the period 1995-2009. Finally, Dietrich and Wanzenried (2014) used a
sample of 118 countries, divided into three income brackets, in the period 1998-2012.
8
With regard to studies of the Latin American region, research has been directed more
towards explaining margins in interest rates, and there are about ten articles on this subject.9
Whereas, studies explaining profitability are scarcer; only three of these were found in the
course of this study to be on groups of countries. In the first one, Chortareas et al. (2010)
studied 9 Latin American countries (not including Mexico) during the period 1997-2005.
They found the principle determinants of profitability were capitalization and size, but the
main part of their analysis was concerned with proving the possible influence of market
concentration and efficiency. Their findings show that the efficiency of the banks is more
important as a determinant of their profitability.
Jara et al. (2011) analyzed 6 Latin American countries (including Mexico), and the
United States, for the whole period of 1997-2010.10 The authors point out that U.S. banks
are more profitable than the Latin America banks included in the sample. Their findings
show that the variables of profitability have persistence over time, and a great proportion of
the internal, external and macroeconomic factors included are significant.11
Guillén et al. (2014) studied 12 countries (including Mexico) in the period 1989-2005.
The authors state that although the variable of bank efficiency is significant and positive in
explaining their profitability, the market power of the banks has stopped the gains made in
efficiency from reducing active interest rates.
9
Several of these works are cited in Jara et al. (2011).
10
Only two banks established in Mexico were included.
11
The results obtained by these scholars are based on regressions that include both banks in Latin American
countries and banks in the U.S.A. Their claim that U.S. banks are more profitable than the rest is based on a
Six works dealing specifically with the case of Mexico were found, and five of them use
a static specification on panel data. Also five of them, Arteaga (2001), Rodríguez (2003),
Chortareas et al. (2009), Guerrero and Villalpando (2009), and Garza-García (2012)
concentrate on analyzing whether the profitability of the banking system is explained by
market power or by a condition of efficiency in the banks. Arteaga (2001) analyzes the
period 1995-1999 and comes to the conclusion that market concentration is an important
factor for explaining bank profitability.12 Rodríguez (2003) studies the period 1995-2000
and concludes that both market concentration and efficiency are factors explaining bank
profitability;13 his findings show that the variables of capitalization and size are also
significant. Chortareas et al. (2009) study the period 1996-2003 and also conclude that
market concentration and efficiency are explicative factors for bank profitability, although
evidence is weak for the first factor; they find also a positive impact between capitalization
and profitability.14 Guerrero and Villalpando (2009) analyze the period 1997-2005 and
come to the conclusion that the variables of market power can explain bank profitability;
their findings show that the variables of capitalization and provision for loan losses are also
significant. Garza-García (2012) studies the period 2001-2009 and concludes that there is
influence by market power on the profitability of the banks; he also finds some evidence of
significant effects from the level of capitalization and the level of loans granted.15 It is
12
The author does not specify which technique of estimation was used to obtain his results.
13
The author states that he made estimates through fixed effects but does not say whether he conducted any
test to determine if it was more appropriate to make estimates through random effects.
14
As a measure of efficiency the authors used the ratio of cost-to-income. Their findings were obtained through the technique of random effects for panel data.
15
worth pointing out that the work just mentioned is the only one conducted for Mexico that
estimates a dynamic model.
Finally, Rodríguez and Venegas (2010) sought to define precisely what the determinants
of profitability were in groups of banks of four different sizes, using the period 2002-2009.
These scholars gave exclusively financial ratios as explicative variables and their findings
show that capitalization is a relevant variable for explaining the profitability of banks in
Mexico.16
On the whole findings obtained in international empirical research tell us that it is very
important to include explicative variables that represent internal, external and
macroeconomic factors. At the same time, a number of recent studies demonstrate the
importance of proving dynamic specifications of the function of bank profitability. This
aspect has been omitted, with one exception, from studies on Mexico and macroeconomic
variables have not been included either. Further, studies on the Latin American region and
on Mexico agree about the relevance of certain factors, such as market power and
capitalization, and to a lesser extent size and credit risk.
16
These authors say their results were obtained through using OLS. Estimates of this type made with panel
data tend to create estimators which have certain drawbacks and, also, the authors do not say they have given
any special treatment to their standard errors. What is more, their explicative variables are atypical in relation
4. Data and the empirical model
The data employed are from 45 commercial banks representing virtually the whole
world of commercial banking in Mexico during the period 2007-2013.17 A total of 31 of
these banks have information for all seven years; the rest joined the market or left it during
the period. As certain criteria for accounting were introduced at the start of 2007, the period
considered allows the data to be homogeneous in the variables used.
Most of the figures were obtained from the components of the information portfolio of
the National Banking and Values Commission (la Comisión Nacional Bancaria y de
Valores), which is the regulating body of banks in Mexico. This portfolio contains
information on loan books, capitalization and other indicators of bank operations; it also
includes the financial statements of each bank.18 Any information not provided for
particular banks was obtained from the annual reports found on their web pages.
Due to the form taken by the data base the estimation options represent variants of panel
data models. As various empirical studies have found that the variable of bank profitability
can be significant when aggregated as a lagged explicative variable, a dynamic
specification of the function is proposed. Theoretically, this lag of the dependent variable
means that the function of profitability is not necessarily in long-run equilibrium, which
appears to be the commonest situation of markets. In this type of specification, the
coefficient of lagged profitability reflects a condition of persistence in profitability.
According to Goddard et al. (2004), this coefficient captures implicitly the impact of entry
17
Those not included are the six small banks that came into the market in 2013. These banks taken together
represented less than 1percent of the assets of the system in December the same year.
18
As is usual, all the information available was evaluated, and some figures that presented anomalies or
barriers or other obstacles to competition on the dynamics of profitability, and reflects the
velocity at which abnormal benefits tend to converge with long-run average profits. This
happens because certain banks have particular advantages that allow them to discourage the
entry of competitors to specific segments of the market, and this makes the differences
between average rates of profitability keep up indefinitely. The model is the following:
𝑝𝑟𝑜𝑓𝑖𝑡𝑎𝑏𝑖𝑙𝑖𝑡𝑦𝑖𝑡 = 𝛿1𝑝𝑟𝑜𝑓𝑖𝑡𝑎𝑏𝑖𝑙𝑖𝑡𝑦𝑖,𝑡−1 + ⋯ + 𝛿𝑝𝑝𝑟𝑜𝑓𝑖𝑡𝑎𝑏𝑖𝑙𝑖𝑡𝑦𝑖,𝑡−𝑝+ 𝒙𝑖𝑡′ 𝜷 + 𝛼𝑖+ 𝜀𝑖𝑡 , (1)
where:
αi = panel-level effects.
𝒙𝑖𝑡′ = vector of control variables: X1, X2,…, Xk
εit = error.
The dependent variables included in the analysis are: return on average assets (ROAA)
and return on average equity (ROAE). For the case of Mexican banks it is not possible to
include measures of value, like Tobin’s q, as virtually none of the banks has shares in the
stock exchange.
Studies of the determinants of bank profitability suggest the following factors need to be
controlled in a function of profitability:19 size, capital adequacy, liquidity, credit risk,
activity mix, expense management, and market concentration. In this case, the growth rate
of economic activity is added. The variables used for measuring each factor are the
following:
19
It is important to point out that the specialized literature on this type of profitability functions does not
include explicitly variables related to the socio-economic and demographic situations of the customers;
neither has systematic use been made of variables to define the institutional framework. This is still a
1) Size.- Measured with the logarithm of total assets. The square of this variable was also
included in order to prove the possibility of a non-linear effect, but it turned out not to be
significant in the various regressions.
2) Capital adequacy.- The capital-to-total assets ratio was included.
3) Liquidity- Theloans-to-deposits ratio was used.
4) Expense management.- The ratio ofoperating expenses-to-total assets was included.
5) Credit risk.- The ratio of provision for loan losses-to-total loans was used.
6) Activity mix.- The ratio of non-interest revenue-to-total revenue was included. Income of
this sort that does not derive from interest charges consists basically of the final balance
of commissions, fees and other revenue.
7) Market concentration.- Initially the Herfindahl indices for loans and deposits were
included, as well as market shares for loans and deposits. Results obtained with market
shares for loans are given.
8) Growth rate of economic activity.- The growth rate of the Gross Domestic Product
(GDP) of the country was used.
Also a binary variable was added to measure the impact of the international financial
crisis. The variable was defined with a value of 1 for 2008 and 2009, the years that
presented the strongest effects of the crisis.
It is important to note that, according to Berger (1995), capital behaves endogenously
within the function of profitability, as an increase in profits allows an increase in the ratio
of capital, especially because those banks which expect to perform better transmit this
information to the public as they increase their capital.
As for credit risk it can be modeled as a predetermined variable, as the regulating bodies
to be made against credit risk. According to these standards, those running each bank
decide their provisions for loan losses (Athanasoglou et al., 2008).
Taking into consideration the presence of the endogenous and predetermined variables
mentioned, the expression (1) is modified in the following way:
𝑝𝑟𝑜𝑓𝑖𝑡𝑎𝑏𝑖𝑙𝑖𝑡𝑦𝑖𝑡 = ∑𝑝𝑗=1𝛿𝑗𝑝𝑟𝑜𝑓𝑖𝑡𝑎𝑏𝑖𝑙𝑖𝑡𝑦𝑖,𝑡−𝑗+ 𝒙𝑖𝑡′ 𝜷 + 𝒘𝑖𝑡′ 𝜸 + 𝛼𝑖+ 𝜀𝑖𝑡 , (2)
where:
αi = panel-level effects.
𝒙𝑖𝑡′ = vector of exogenous variables: X1, X2,…, Xk
𝒘𝑖𝑡′ = vector of endogenous and predetermined variables: W
1, W2
εit = error.
In empirical literature on the subject only the first lag of the dependent variable has been
reported as significant. If this remains true for the present study, then the expression to be
estimated will be:
𝑝𝑟𝑜𝑓𝑖𝑡𝑎𝑏𝑖𝑙𝑖𝑡𝑦𝑖𝑡 = 𝛿1𝑝𝑟𝑜𝑓𝑖𝑡𝑎𝑏𝑖𝑙𝑖𝑡𝑦𝑖,𝑡−1 + 𝒙𝑖𝑡′ 𝜷 + 𝒘𝑖𝑡′ 𝜸 + 𝛼𝑖+ 𝜀𝑖𝑡 , (3)
In various international studies attempts have been made to prove whether or not foreign
owned banks are more profitable than those owned nationally. The present study has set out
to test this possible difference in performance, which implies the creation of a binary
variable with a value of 1 for foreign banks and a value of zero for the other case. But this
variable does not change over time so its coefficient cannot be estimated in the dynamic
model defined in expressions (1-3), as the estimation of those models involves the
introduction of first differences, which eliminates the variables that do not change over
time. For this reason a static estimation with panel data is proposed, in particular, the use of
a model with random effects is suggested. Furthermore, a model with Hausman-Taylor
estimator is proposed, which, though static, allows endogenous effects in some variables to
The random effects model is expressed as follows:
𝑝𝑟𝑜𝑓𝑖𝑡𝑎𝑏𝑖𝑙𝑖𝑡𝑦𝑖𝑡 = 𝜆1𝑓𝑜𝑟𝑒𝑖𝑔𝑛 𝑝𝑟𝑜𝑝𝑒𝑟𝑡𝑦𝑖 + 𝒙𝑖𝑡′ 𝜷 + 𝛼𝑖+ 𝜀𝑖𝑡 , (4)
where:
αi = random individual-specific effects.
𝒙𝑖𝑡′ = vector of control variables: X1, X2,…, Xk
εit = error.
The model with Hausman-Taylor estimator is expressed as follows:
𝑝𝑟𝑜𝑓𝑖𝑡𝑎𝑏𝑖𝑙𝑖𝑡𝑦𝑖𝑡 = 𝜆1𝑓𝑜𝑟𝑒𝑖𝑔𝑛 𝑝𝑟𝑜𝑝𝑒𝑟𝑡𝑦𝑖 + 𝒙𝑖𝑡′ 𝜷 + 𝒘𝑖𝑡′ 𝜸 + 𝛼𝑖+ 𝜀𝑖𝑡 , (5)
where:
αi = fixed-effects.
𝒙𝑖𝑡′ = vector of exogenous variables: X1, X2,…, Xk
𝒘𝑖𝑡′ = vector of endogenous variables: W1, W2
εit = error.
Table 1 presents the descriptive statistics of the variables included in the reported
results. It can be seen that for the 45 banks as a whole the period is, from the perspective of
ROAE, one of modest profits, while according to ROAA, it is one of slightly negative
profitability. These degrees of profitability seem to contradict to some extent the argument
referred to above that the commercial banks in Mexico did not suffer a direct effect due to
the international financial crisis. However, the means of these variables were affected by
the results from two banks that showed very high losses during the period studied,20
occasioned to a large extent by problems of non-performing loans. With these two banks
excluded, the ROAA mean would be 0.0060 and that of ROAE would be 0.0799, both of
them positive.
INSERT TABLE 1 ABOUT HERE
20
They are el Banco Walmart de México and el Banco Fácil. The former had an ROAA average of –0.3296
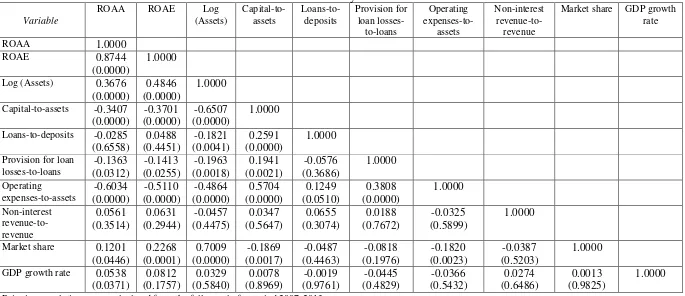
Table 2 presents the pairwise correlations between measures of profitability, the
characteristics of the 45 banks in the period 2007-2013 and the GDP growth rate for the
same period. It can be seen that the size measured by assets and market share are associated
with higher profitability. Whereas ratios of capital, administration costs and provision for
loan losses are associated with a lower rate of profitability. The GDP growth rate has a
positive association with profitability, but only when it is measured with ROAA.
INSERT TABLE 2 ABOUT HERE
5. Results
First the model referred to by the expression (2) was estimated. Having verified that only
the first lag of the dependent variable is significant, the next step was to estimate the
equation (3). In both cases the generalized method of moments (GMM) was used, with
Arellano-Bover/Blundell-Bond estimators. These estimators introduce additional moment
conditions to those of the Arellano-Bond estimators, obtaining coefficients with greater
precision and with better properties for finite samples. According to Arellano and Bover
(1995), the dynamic panel technique is also useful for resolving problems of endogeneity,
heteroskedasticity and autocorrelation.
In these first estimates it was considered to start with that the term of error did not
present a serial correlation. But as this supposition was rejected by the Arellano-Bondtest
for autocorrelation in first-differenced errors, it was then proposed that in the expression (3)
the term of error (εit) would follow an MA(1) process, in such a way that:
𝜀𝑖𝑡 = 𝜂𝑖𝑡 + 𝜋𝜂𝑖,𝑡−1 , (6)
where:
It should be noted that the number of instruments included in each regression was
reduced, because as the number of variables and the number of periods used increased, so
was the number of instruments. If the number of these is very large then the result is a poor
finite-sample approximation to the distribution of the estimator. Specifically, according
with Louzis et al. (2012), when the number of instruments is greater or equal to the number
of cross sectional units, then both the standard errors and the Sargan test are downwards
biased. With the aim of keeping to this rule, we limited the number of lags to be used as
instruments in the endogenous and predetermined variables.
The most robust results were obtained using ROAE as the dependent variable. Table 3
presents the regressions that include all the banks, and also those in which the bank that
reported the greatest losses in the period of study was excluded. It is worth mentioning that
estimates were made of robust standard errors to heteroskedasticity. Following the order of
the variables in the expression (3), the first result is that for the lagged dependent variable,
which is the coefficient of persistence in profitability. In all cases this coefficient is
significant to 1 percent and has a value of between 0.41 and 0.48, which is relatively high
and shows implicitly the impact of the barriers to entry or of other obstacles to competition
in the dynamic of profitability, and reflects the velocity at which abnormal profits tend to
converge with long term average benefits. However, a result that might have been
complementary in the characterization of an oligopolistic market, the coefficient of market
share, turned out not to be significant. To obtain a more conclusive result for the effect of
market concentration, it will be necessary to explore the hypothesis of market power and
efficiency, but that is not the aim of the present study.
With regard to exogenous variables, firstly, the impact of non-interest revenue is
positive and significant in all regressions, which reveals that the commissions, fees and
other charges are relevant to the profitability of commercial banking in Mexico. Secondly,
the ratio of operating expenses is found to be negative and significant to 1 percent when the
whole sample of banks is considered, though it becomes insignificant when the bank with
the largest losses is excluded. Operating expenses represent the non-financial costs of the
banks and are usually a very important variable in the functions of bank profitability.
Thirdly, the growth rate of GDP comes out as positive and significant, which implies that
the growth of economic activity in the country has a favorable impact on bank profitability.
Finally, variables about size and liquidity turn out not to be significant.
With regard to endogenous variable, the capital ratio, this shows a positive and
significant impact. This effect can be understood as a consequence of the banks expecting
greater profitability transmitting this information to the public through increases in their
capital. Also, increases in capital levels can create incentives for shareholders to improve
their supervision of the operations and processes of the bank, and as a result, encourage the
banks’ profitability indirectly. On the other hand, predetermined variable, the ratio of
provision for loan losses, is not significant. This result shows that the profitability of the
commercial banks in Mexico does not appear to be sensitive to variations in credit risk.
It is to be noted that the variable of the impact of the international financial crisis was
found to be not significant in all the cases analyzed and therefore it was not included in the
reported regressions. However, this result corroborates the fact that there was no direct
effect of the international financial crisis on the profitability of the banks operating in
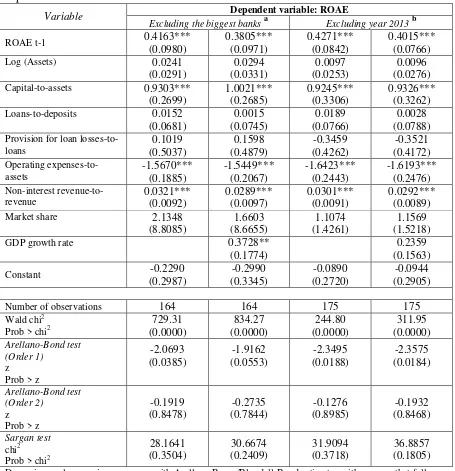
With the intention of exploring further the robustness of the results presented, Table 4
shows also the estimate of the equation (3) with a term of error like that of expression (6)
for the ROAE as the dependent variable, but with two other versions of the data base: a) not
including the 7 main banks of the system,21 and b) considering all the banks but only for the
period 2007-2012. These two versions of the data base confirm the results obtained
previously, even making them firmer. In the first place, the coefficient of lagged
profitability is positive and significant to 1 percent, with values of between 0.38 and 0.42.
Taken together, the findings from Tables 3 and 4 give a range of persistence values of
between 0.38 and 0.48, but in seven of the eight regressions the coefficient is above 0.40.
How does this value compare with that found in other studies? For example, Jara et al.
(2011) found a coefficient of persistence of between 0.40 and 0.44 for a combination of 6
countries from Latin America and a number of banks from the U.S.A., which turned out to
be very similar as that found for this study.22 If we compare these results with others,
Dietrich and Wanzenried (2014) found a coefficient of persistence for middle income
countries (where Mexico may be placed) of 0.33,23 which is lower than the figure estimated
in the present study; and the coefficient they found for high income countries is
considerably less (0.14). As for Ben Naceur and Omran (2011), they found an average
persistence coefficient of 0.31 for 11 countries of the Middle East and North Africa.
21
These are Banamex, Banorte, BBVA Bancomer, HSBC, Inbursa, Santander and Scotiabank, the only large
scale banks working in Mexico.
22
The range given for the coefficient of persistence refers to the regressions with ROE as a dependent
variable. When they used ROA the range was of 0.46 to 0.47.
23
Dietrich and Wanzenried (2014) classified countries according to GDP per capita calculated by the World
Flamini et al. (2009) reported a persistence coefficient of 0.21 for 41 sub-Saharan countries.
Finally, the results obtained by Garza-García (2012) in the only study before this to
estimate the coefficient for Mexico oscillate between 0.80 and 0.97. It can be seen from the
results obtained by other authors for different regions of the world, that Garza-García’s
figures seem to have an upward bias, maybe because the control variables of size and
activity mix were not included.
However, it is important to consider that the lack of competition as a determinant of
bank profitability needs further research, because other scholars, using different
methodologies, have found contradictory results about the degree of competition between
commercial banks established in Mexico.
In the second place, regressions with both versions of the data shown in Table 4 yielded
the same significant exogenous variables as those presented in Table 3. The non-interest
revenue ratio is positive and significant to 1 percent in all cases. This result is different to
that found for other regions, for example, for Asia (Lee et al., 20014) and the United States
(Stiroh and Rumble, 2006), where this variable is not significant. Moreover, the ratio of
operating expenses is negative and significant to 1 percent in all cases. This result coincides
with that found for a group of countries in Latin America (Jara et al., 2011), but differs
from that for other regions, for example, the sub-Saharan countries of Africa (Flamini et al.
(2009) or middle income countries (Dietrich and Wanzenried, 2014), where this variable is
not significant.24 Finally, the growth rate of GDP turns out to be positive and significant in
three of the four outputs shown in Tables 3 and 4. This result agrees with those obtained in
virtually all regions of the world. With regard to the non-significant variables, considering
24
the four versions of the data base shown in Tables 3 and 4, it can be seen that the variable
of size keeps a positive sign in all cases. According to Athanasoglou et al. (2008), a
possible explanation for this finding may be that small banks usually try to grow as fast as
possible even at the expense of their profitability. Further, for exactly the same reason, new
banks tend not to be particularly profitable in their first years of operation, and as
mentioned here, 13 new banks entered the market in the years 2007-2008.
In third place, in regressions shown in Table 4, the endogenous variable (the ratio of
capital) also remained positive and significant. The results about this variable coincide with
research papers undertaken for Latin America and Mexico in so far as the level of capital is
given a significant role as a factor for explaining profitability.
Finally, the ratio of provision for loan losses is not significant in all regressions
presented in Tables 3 and 4. As noted previously, this result shows that the profitability of
the commercial banks in Mexico does not appear to be sensitive to variations in credit risk.
Whereas in countries that have recently faced problems of credit risk management, the
coefficient of this variable is usually negative and significant.
INSERT TABLE 4 ABOUT HERE
Table 5 shows the results of the estimation of equation (3) with an equation (6) type of
error, but now taking ROAA as a dependent variable. As mentioned previously, regressions
with ROAA were less solid than those obtained with ROAE, because the Arellano-Bond
test for autocorrelation in first-differenced errors only rejects the null hypothesis to 10
percent in order 1. The results presented correspond to two versions of the data base: a) not
including the two banks that reported greatest losses, b) not including the two banks
mentioned in the last paragraph nor the 7 biggest banks of the system. The result that most
significant to 1 percent, with values of between 0.50 and 0.56. The capital ratio is also
positive and significant. The loans-to-deposits ratio, which is an indicator of liquidity, turns
out to be positive and significant as well.
INSERT TABLE 5 ABOUT HERE
Finally, Table 6 gives the results for the static models obtained on the basis of equations
(4) and (5), and retaking ROAE as a dependent variable. As already explained, the main
object of these models is to analyze the impact of nationality in bank ownership, controlling
for the rest of the variables included in the study. In this sense, the most important result is
that the random effects model indicates that the foreign owned banks are less profitable
than the nationally owned. However, once the effects of the capital ratio and the ratio of
provision for loan losses are considered endogenous, the coefficient of the variable for
foreign ownership keeps nearly the same values, but ceases to be significant.
Demirgüç-Kunt and Huizinga (1999) found that foreign banks are more profitable than nationally
owned banks in those economies that are less developed, while the result is inverted in
more developed economies. Taking this reference into account, the estimated coefficients
in the present study represent an intermediate result. By contrast, Dietrich and Wanzenried
(2014) found that foreign banks from middle income countries are less profitable than
national ones.
One collateral effect of the regressions shown in Table 6 is that in a static model, the
variables that turned out to be significant in the dynamic model remain so, as do others.
INSERT TABLE 6 ABOUT HERE
The stated aim of this paper has been to identify the determinants of profitability for the
commercial banks established in Mexico, incorporating the most important elements from
international empirical literature on the subject, and at the same time filling the gaps in
research into the case of Mexico. A data base of commercial banks operating in Mexico
during the period 2007-2013 was used. The data base consists of 45 banks representing
virtually the whole universe of banks that conducted operations during this period.
Dynamic models were estimated using Arellano-Bover/Blundell-Bond estimators with
an error that follows an MA(1) process, as well as static models with random effects and
Hausman-Taylor estimators. The dependent variables were ROAE and ROAA but the most
robust results were obtained with the first of these. The regressions present the following
principal results: 1) The coefficient of the dependent variable lagging one period is positive
and highly significant, with a value above 0.40. 2) The principle explicative factors of
profitability are the level of capital and the activity mix that generates income, both in a
positive sense; and running expenses, in a negative sense. 3) The nationality of bank
ownership is not relevant to the determination of profitability.
According to what has happened in recent years, the commercial banking system in
Mexico appears to have stabilized into a state where foreign owned banks that dominate the
market co-exist with banks of various sizes affiliated to business groups with national
capital, and a third group of banks, nearly all of them small - nationally owned and foreign
- which occupy particular niches in the market. The findings of the present study suggest
that the profitability of this system of commercial banks is sustained by the level of capital,
the charging of commissions and fees, and control of operating costs, as well as certain
market entry barriers and obstacles to competition that leave only enough room for tiny
However, it is important to consider that the lack of competition as a determinant of
bank profitability needs further research, because other scholars, using different
methodologies, have come to different conclusions about the degree of competition
between commercial banks established in Mexico.
References
1. Aghion, Phillippe, Peter Howitt, and David Mayer-Foulkes (2005). “The effect of
financial development on convergence: Theory and evidence”, Quarterly Journal of
Economics, Vol.120, pp.173-222.
2. Arellano, Manuel, and Olympia. Bover (1995). “Another look at the instrumental -variable estimation of error-components”, Journal of Econometrics, Vol.68, No.1, pp.29-52.
3. Arteaga, Julio César (2001). “Poder de mercado o eficiencia: Origen de las utilidades del
sistema bancario mexicano de 1995 a 1999”, Ensayos, Universidad Autónoma de Nuevo León, Monterrey, Vol.20, No.1, pp. 35-48.
4. Athanasoglou, Panayiotis P., Matthaios D. Delis, and Christos K. Staikouras (2006).
“Determinants of bank profitability in the South Eastern Europe region”, Bank of
Greece, Working Paper No.47.
5. Athanasoglou, Panayiotis P., Sophocles N. Brissimis, and Matthaios D. Delis (2008).
“Bank-specific, industry-specific and macroeconomic determinants of bank
profitability”, International Financial Markets, Institutions and Money, Vol.18, pp.121-136.
6. Banco de México (2010). “Circular 22/2010. Disposiciones de carácter general que
establecen prohibiciones y límites al cobro de comisiones”, Diario Oficial de la
Federación, México, H. Congreso de la Unión, 26 de julio de 2010,
(http://dof.gob.mx/nota_detalle.php?codigo=5153087&fecha=26/07/2010).
7. Ben Naceur, Sami, and Mohammed Omran (2011). “The effects of bank regulations,
competition, and financial reforms on banks’ performance”, Emerging Markets Review, Vol.12, pp.1-20.
8. Berger, Allen N. (1995). “The Relationship between Capital and Earnings in Banking”,
Journal of Money, Credit and Banking, Vol.27, No.2, pp.432-456.
9. Bolt, Wilko, Leo de Haan, Marco Hoeberichts, Maarten R.C. van Oordt, and Job Swank
(2012). “Bank profitability during recessions”, Journal of Banking and Finance, Vol.36, pp.2552-2564.
10.Bourke, Philip (1989). “Concentration and Other Determinants of Bank Profitability in
Europe, North America and Australia”, Journal of Banking and Finance, Vol. 13, No.1, pp. 65-67.
11.Castañeda, Gonzalo (2014). La naturaleza multidimensional de la competencia bancaria
en México, México, Centro de Estudios Espinosa Yglesias.
12.Chavarín, Rubén (2012). “Bancos ligados a grupos económicos en México y
13.Chortareas, Georgios, Jesús G. Garza-García, and Claudia Girardone (2009). “Market structure, profits, and spreads in the Mexican banking industry”. Banks and Bank
Sistems, Vol.4, No.3, pp.43-52.
14.Chortareas, Georgios, Jesús Garza-García, y Claudia Girardone (2010). “Desempeño del sector bancario en algunos países latinoamericanos: Poder de mercado versus
eficiencia”, Banco de México, Documento de Investigación, No.20.
15.Claessens, Stijn, and Neeltje van Horen (2012). “Foreign Banks: Trends, Impact and
Financial Stability”. International Monetary Fund, Working Paper 12/10.
16.Comisión Federal de Competencia Económica (COFECE) (2014). “Trabajo de
investigación y recomendaciones sobre las condiciones de competencia en el sector
financiero y sus mercados”, México, COFECE, (http://www.cfc.gob.mx/cofece/
images/Estudios/ENTREGADEFINITIVO_PROTEG. pdf).
17.Demirgüç-Kunt, Asli, and Harry Huizinga (1999). “Determinants of commercial bank interest margins and profitability: some international evidence”, World Bank Economic
Review, Vol.13, No.2, pp.379-408.
18.De Young, Robert, and Tara Rice (2004). “Noninterest Income and Financial Performance at U.S. Commercial Banks”, The Financial Review, Vol.39, pp.101-127.
19.Dietrich, Andreas, and Gabrielle Wanzenried (2011). “Determinants of bank
profitability before and during the crisis: Evidence from Awitzerland”, Journal of
International Financial Markets, Institutions and Money, Vol.21, pp.307-327.
20.Dietrich, Andreas, and Gabrielle Wanzenried (2014). “The determinants of commercial banking profitability in low-, middle-, and high-income countries”, The Quarterly
Review of Economics and Finance, forthcoming.
21.Flamini, Valentina, Calvin McDonald, and Liliana Schumacher (2009). “The
determinants of commercial bank profitability in Sub-Saharan Africa”, International Monetary Fund, Working Paper.
22.Garza-García, Jesús Gustavo (2012). “Does market power influence bank profits in
Mexico? A study on market power and efficiency”. Applied Financial Economics, Vol.22, No.1, pp.21-32.
23.Goddard, John, Phil Molyneaux, and John O.S. Wilson (2004). “Dynamics of Growth
and Profitability in Banking”, Journal of Money, Credit and Banking, Vol.36, No.6, pp.1069-1090.
24.Guerrero, Rodolfo, y Mario Villalpando (2009). “Rentabilidad, concentración y
eficiencia en el sistema bancario mexicano”, El Trimestre Económico, Fondo de Cultura Económica, México, Vol.76, No.301, pp.237-263.
25.Guillén, Jorge, Erick W. Rengifo, and Emre Ozsoz (2014). “Relative power and
efficiency as a main determinant of banks’ profitability in Latin America”, Borsa
Istambul Review, forthcoming.
26.Haslem, John A., (1968). “A Statistical Analysis of the Relative Profitability of
Commercial Banks”, Journal of Finance, Vol. 23, pp. 167-176.
27.Hernández, Fausto, y Alejandro Villagómez (2012). El enigmático sistema bancario
mexicano contemporáneo, México, Centro de Estudios Espinosa Yglesias.
28.Hirtle, Beverly J., and Kevin J. Stiroh (2007). “The Return to Retail and Performance of
U.S. Banks”, Journal of Banking and Finance, Vol.31, No.4, pp. 1101-1133.
29.Hester, Donald D. and Zoellner, John F. (1966). “The Relation between Bank Portfolios
30.Jara, Mauricio, José Tomás Arias, y Arturo Rodríguez Perales (2011). “Diversificación y determinantes del desempeño bancario: una comparación internacional”, Estudios de
Administración, Universidad de Chile, Santiago, Vol.18, No.2, pp.1-48.
31.Lee, Chien-Chiang, Yang, Shih-Jui, and Chang Chi-Hung (2014). “Non-interest income, profitability, and risk in banking industry: A cross-country analysis”, North American
Journal of Economics and Finance, Vol.27, pp.48-67.
32.Levine, Ross (2005). "Finance and Growth: Theory and Evidence," in Philippe Aghion, and Steven Durlauf (eds.), Handbook of Economic Growth, North Holland, Vol.1A, chapter 12, pp. 865-934.
33.Louzis, Dimitrios P., Angelos T. Vouldis, and Vasilios L. Metaxas (2012).
“Macroeconomic and bank-specific determinants of non- performing loans in Greece: A
comparative study of mortage, business and consumer loan portfolios”, Journal of
Banking and Finance, Vol.36, pp.1012-1027.
34.Mayoral, Isabel (2013). “Banxico limitará comisiones de bancos”, CNN Expansión, 29 de noviembre de 2013 (http://www.cnnexpansion.com/economia/2013/11/28/banxico-pondra-en-orden-a-los-bancos).
35.Micco, Alejandro, Ugo Panizza, and Monica Yañez (2007). “Bank ownership and
performance. Does politics matter?” Journal of Banking and Finance, Vol.31, pp.219-241.
36.Molyneux, Philip, and John Thornton (1992). “Determinants of European bank
profitability: a note”, Journal of Banking and Finance, Vol.16, pp.1173–1178.
37.Park, Kang H., and William L. Weber (2006). “Profitability of Korean banks: Test of
market structure versus efficient structure”, Journal of Economics and Business, Vol.58, pp.222-239.
38.Rasiah, Devinaga (2010). “Review of literature and theories on determinants of comercial bank profitability”, Journal of Performance Management, Vol.23, No.1, pp.23-49.
39.Rodríguez, Eduardo (2003). “Concentración industrial y rentabilidad de la banca en
México. Evaluación posterior a la crisis de 1995”, El Trimestre Económico, Fondo de Cultura Económica, México, Vol. 70, No. 278, pp. 371-404.
40.Rodríguez, Abigail, y Francisco Venegas (2010). “Indicadores de rentabilidad y
eficiencia operativa de la banca comercial”, Problemas del Desarrollo, Universidad Nacional Autónoma de México, México, Vol.41, No.161, pp.165-191.
41.Short, Brock K. (1979). “The relation between commercial bank profit rates and banking
concentration in Canada, Western Europe and Japan”, Journal of Banking and Finance, Vol.3, 209–219.
42.Staikouras, Christos, and Geoffrey E. Wood (2004). “The Determinants of European
Banks Profitability”, International Business and Economics Research Journal, Vol.3, No.6, pp.57-69.
43.Stiroh, Kevin J., and Adrienne Rumble (2006). “The dark side of diversification: The
Figure 1
ROA and ROE of commercial banking in Mexico 2000-2013
Source: Original elaboration based on data from the Comisión Nacional Bancaria y de Valores.
Figure 2
Capital and loans of commercial banking in Mexico 2000-2013
Source: Original elaboration based on data from the Comisión Nacional Bancaria y de Valores.
[image:29.612.86.508.388.643.2]Table 1
Descriptive statistics
All banks
Variable Observations Mean Stand. Desv. Minimun Maximun
ROAA 280 -0.0064 0.0900 -0.8293 0.2324
ROAE 280 0.0552 0.2019 -1.2712 0.655
Log (Assets) 280 10.0369 2.0138 4.9786 14.0612
Capital-to-assets 278 0.1896 0.2010 0.0113 0.9924
Loans-to-deposits 247 0.0137 0.0542 0.0003 0.6503
Provision for loan losses-to-loans
251 0.0561 0.0791 0 0.9780
Operating expenses-to-assets
278 0.0816 0.1124 0.0018 0.9539
Non-interest revenue-to-revenue
279 0.4262 0.8155 -5.9018 7.4085
Market share 280 0.0250 0.0536 0 0.2753
GDP growth rate 280 0.0201 0.0306 -0.0470 0.0511
Excluding Banco Fácil and Banco Walmart
ROAA 268 0.0060 0.0518 -0.3371 0.2324
ROAE 268 0.0799 0.1534 -0.6740 0.655
Log (Assets) 268 10.1733 1.9326 6.0414 14.0612
Capital-to-assets 266 0.1748 0.1877 0.0113 0.9924
Loans-to-deposits 235 0.0136 0.0555 0.0003 0.6503
Provision for loan losses-to-loans
238 0.0514 0.0754 0 0.9780
Operating expenses-to-assets
266 0.0664 0.0754 0.0018 0.3782
Non-interest revenue-to-revenue
266 0.4335 0.7268 -4.1690 7.4085
Market share 268 0.0260 0.0545 0 0.2753
GDP growth rate 268 0.0201 0.0306 -0.0470 0.0511
Table 2
Pairwise correlation matrix of the variables used in the econometric analysis
Variable
ROAA ROAE Log
(Assets) Capital-to-assets Loans-to-deposits Provision for loan losses-to-loans Operating expenses-to-assets Non-interest revenue-to-revenue
Market share GDP growth rate
ROAA 1.0000
ROAE 0.8744
(0.0000)
1.0000
Log (Assets) 0.3676 (0.0000)
0.4846 (0.0000)
1.0000
Capital-to-assets -0.3407 (0.0000) -0.3701 (0.0000) -0.6507 (0.0000) 1.0000
Loans-to-deposits -0.0285 (0.6558) 0.0488 (0.4451) -0.1821 (0.0041) 0.2591 (0.0000) 1.0000
Provision for loan losses-to-loans -0.1363 (0.0312) -0.1413 (0.0255) -0.1963 (0.0018) 0.1941 (0.0021) -0.0576 (0.3686) 1.0000 Operating expenses-to-assets -0.6034 (0.0000) -0.5110 (0.0000) -0.4864 (0.0000) 0.5704 (0.0000) 0.1249 (0.0510) 0.3808 (0.0000) 1.0000 Non-interest revenue-to-revenue 0.0561 (0.3514) 0.0631 (0.2944) -0.0457 (0.4475) 0.0347 (0.5647) 0.0655 (0.3074) 0.0188 (0.7672) -0.0325 (0.5899) 1.0000
Market share 0.1201 (0.0446) 0.2268 (0.0001) 0.7009 (0.0000) -0.1869 (0.0017) -0.0487 (0.4463) -0.0818 (0.1976) -0.1820 (0.0023) -0.0387 (0.5203) 1.0000
GDP growth rate 0.0538 (0.0371) 0.0812 (0.1757) 0.0329 (0.5840) 0.0078 (0.8969) -0.0019 (0.9761) -0.0445 (0.4829) -0.0366 (0.5432) 0.0274 (0.6486) 0.0013 (0.9825) 1.0000
31
Table 3
Dynamic panel regressions considering ROAE as dependent variable
Variable
Dependent variable: ROAE
Including all banks Excluding the bank with greatest losses a
ROAE t-1 0.4843***
(0.0661) 0.4211*** (0.1082) 0.4411*** (0.1663) 0.4173*** (0.1371)
Log (Assets) 0.0070
(0.0255) 0.0195 (0.0376) 0.0492 (0.0441) 0.0407 (0.0403)
Capital-to-assets 0.6718** (0.2761) 0.8570** (0.3383) 0.6739* (0.3988) 0.6187 (0.3813)
Loans-to-deposits -0.0316 (0.0593) 0.0043 (0.0745) 0.0372 (0.0549) -0.0076 (0.0507)
Provision for loan losses-to-loans 0.1895 (0.3684) 0.2295 (0.5066) -0.0564 (0.4327) -0.0609 (0.4007) Operating expenses-to-assets -1.4774*** (0.2109) -1.4306*** (0.3144) -0.7338 (0.5188) -0.7312 (0.4911) Non-interest revenue-to-revenue 0.0389*** (0.0092) 0.0339*** (0.0124) 0.0499*** (0.0108) 0.0484*** (0.0098)
Market share 0.4329
(1.3193) -0.5417 (1.9592) -1.2558 (1.7335) -0.9430 (1.6631)
GDP growth rate 0.3403*
(0.1820)
0.3479** (0.1675)
Constant -0.0540
(0.2684) -0.1881 (0.3855) -0.4845 (0.4532) -0.4005 (0.4142)
Number of observations 206 206 200 200
Wald chi2 Prob > chi2
1312.36 (0.0000) 882.87 (0.0000) 551.53 (0.0000) 676.77 (0.0000) Arellano-Bond test (Order 1) z Prob > z
-2.5317 (0.0114) -2.0143 (0.0440) -2.0121 (0.0442) -2.0952 (0.0362) Arellano-Bond test (Order 2) z Prob > z
-0.6180 (0.5366) -0.4961 (0.6199) -0.1702 (0.8649) -0.3288 (0.7423) Sargan test chi2 Prob > chi2
38.5834 (0.1642) 27.9925 (0.3588) 39.7507 (0.1348) 41.6914 (0.0951)
Dynamic panel regressions were run with Arellano-Bover/Blundell-Bond estimator with an error that follows an MA(1) process.
a
Excluding Banco Walmart de México.
Robust standard errors are reported in parentheses. * Significant at 10%.
32
Table 4
Dynamic panel regressions considering reduced forms of database and taking ROAE as dependent variable
Variable Dependent variable: ROAE
Excluding the biggest banks a Excluding year 2013 b
ROAE t-1 0.4163***
(0.0980) 0.3805*** (0.0971) 0.4271*** (0.0842) 0.4015*** (0.0766)
Log (Assets) 0.0241
(0.0291) 0.0294 (0.0331) 0.0097 (0.0253) 0.0096 (0.0276)
Capital-to-assets 0.9303*** (0.2699) 1.0021*** (0.2685) 0.9245*** (0.3306) 0.9326*** (0.3262)
Loans-to-deposits 0.0152 (0.0681) 0.0015 (0.0745) 0.0189 (0.0766) 0.0028 (0.0788)
Provision for loan losses-to-loans 0.1019 (0.5037) 0.1598 (0.4879) -0.3459 (0.4262) -0.3521 (0.4172) Operating expenses-to-assets -1.5670*** (0.1885) -1.5449*** (0.2067) -1.6423*** (0.2443) -1.6193*** (0.2476) Non-interest revenue-to-revenue 0.0321*** (0.0092) 0.0289*** (0.0097) 0.0301*** (0.0091) 0.0292*** (0.0089)
Market share 2.1348
(8.8085) 1.6603 (8.6655) 1.1074 (1.4261) 1.1569 (1.5218)
GDP growth rate 0.3728**
(0.1774)
0.2359 (0.1563)
Constant -0.2290
(0.2987) -0.2990 (0.3345) -0.0890 (0.2720) -0.0944 (0.2905)
Number of observations 164 164 175 175
Wald chi2 Prob > chi2
729.31 (0.0000) 834.27 (0.0000) 244.80 (0.0000) 311.95 (0.0000) Arellano-Bond test (Order 1) z Prob > z
-2.0693 (0.0385) -1.9162 (0.0553) -2.3495 (0.0188) -2.3575 (0.0184) Arellano-Bond test (Order 2) z Prob > z
-0.1919 (0.8478) -0.2735 (0.7844) -0.1276 (0.8985) -0.1932 (0.8468) Sargan test chi2 Prob > chi2
28.1641 (0.3504) 30.6674 (0.2409) 31.9094 (0.3718) 36.8857 (0.1805)
Dynamic panel regressions were run with Arellano-Bover/Blundell-Bond estimator with an error that follows an MA(1) process.
a
Excluding Banamex, Banorte, BBVA Bancomer, HSBC, Inbursa, Santander, and Scotiabank.
b
Including all banks, but considering only the period 2007-2012. Robust standard errors are reported in parentheses.
33
Table 5
Dynamic panel regressions considering ROAA as dependent variable
Variable
Dependent variable: ROAA Excluding the banks with greatest
losses a
Excluding the banks with greatest losses and the biggest banks b
ROAA t-1 0.5613***
(0.1094) 0.5156*** (0.1251) 0.5552*** (0.1074) 0.5061*** (0.1228)
Log (Assets) 0.0000
(0.0048) 0.0003 (0.0061) -0.0019 (0.0057) -0.0012 (0.0038)
Capital-to-assets 0.1309** (0.0505) 0.1201** (0.0530) 0.1163** (0.0520) 0.1168** (0.0588)
Loans-to-deposits 0.0715*** (0.0129) 0.0589*** (0.0176) 0.0622*** (0.0156) 0.0565*** (0.0181)
Provision for loan losses-to-loans -0.0131 (0.0700) 0.0052 (0.0914) 0.0183 (0.0769) 0.0127 (0.0748) Operating expenses-to-assets -0.0755 (0.1016) -0.0824 (0.1301) -0.1077 (0.0785) -0.1094 (0.0796) Non-interest revenue-to-revenue -0.0008 (0.0023) -0.0002 (0.0024) -0.0015 (0.0061) -0.0007 (0.0056)
Market share -0.0278
(0.3076) 0.0267 (0.4177) 0.4700 (1.7840) 0.6058 (0.9121)
GDP growth rate 0.0117
(0.0370)
-0.0049 (0.0465)
Constant -0.0039
(0.0480) -0.0085 (0.0597) 0.0144 (0.0557) 0.0070 (0.0414)
Number of observations 196 196 154 154
Wald chi2 Prob > chi2
226.68 (0.0000) 339.70 (0.0000) 212.24 (0.0000) 249.09 (0.0000) Arellano-Bond test (Order 1) z Prob > z
-1.8137 (0.0697) -1.7865 (0.0740) -1.8368 (0.0662) -1.8423 (0.0654) Arellano-Bond test (Order 2) z Prob > z
-0.0324 (0.9742) -0.0048 (0.9962) 0.2043 (0.8382) 0.4623 (0.6439) Sargan test chi2 Prob > chi2
21.0279 (0.7405) 25.3407 (0.4998) 23.0338 (0.6310) 23.2236 (0.6203)
Dynamic panel regressions were run with Arellano-Bover/Blundell-Bond estimator with an error that follows an MA(1) process.
a
Excluding Banco Walmart de México and Banco Fácil.
b
Excluding Banco Walmart de México, Banco Fácil, Banamex, Banorte, BBVA Bancomer, HSBC, Inbursa, Santander, and Scotiabank.
Robust standard errors are reported in parentheses. * Significant at 10%.
34
Table 6
Static panel regressions considering all banks and taking ROAE as dependent variable
Variable Random effects a Hausman-Taylor
Log (Assets) 0.0582**
(0.0250) 0.0561** (0.0249) 0.0599*** (0.0166) 0.0570*** (0.0166)
Capital-to-assets 0.2863
(0.1824) 0.2677 (0.1803) 0.3181*** (0.1150) 0.2947** (0.1153)
Loans-to-deposits 0.0792
(0.0858) 0.0543 (0.0830) -0.0145 (0.2087) -0.0500 (0.2089) Provision for loan losses-to-loans 0.3794***
(0.1037) 0.3864*** (0.0996) 0.4152*** (0.1049) 0.4227*** (0.1046) Operating expenses-to-assets -0.9188***
(0.3238) -0.9075*** (0.3224) -0.9583*** (0.1461) -0.9453*** (0.1456) Non-interest revenue-to-revenue 0.0408**
(0.0165) 0.0406** (0.0159) 0.0420*** (0.0126) 0.0418*** (0.0126)
Market share -0.4053
(0.5834) -0.3581 (0.5795) -0.1854 (0.6490) -0.1296 (0.6474)
GDP growth rate 0.3486*
(0.1937)
0.3680* (0.2143)
Foreign property -0.0912**
(0.0433) -0.0893** (0.0438) -0.0963 (0.0665) -0.0937 (0.0664)
Constant -0.5879**
(0.2627) -0.5714** (0.2622) -0.5199*** (0.1769) -0.4986*** (0.1763)
Number of observations 245 245 245 245
Wald chi2 Prob > chi2
174.64 (0.0000) 195.84 (0.0000) 132.26 (0.0000) 136.30 (0.0000)
R2 within 0.3535 0.3627
R2 between 0.4275 0.4206
R2 total 0.3853 0.3858
Hausman test chi2
Prob > chi2
8.14 (0.3204)
8.71 (0.2742)
a
For random-effects regressions, robust standard errors are reported in parentheses. * Significant at 10%.