Translation Evaluation
Shafiq Joty
∗School of Computer Science and Engineering
Nanyang Technological University
Francisco Guzm´an
∗∗Applied Machine Learning Group Facebook
Llu´ıs M`arquez
†ALT, QCRI, HBKU, Qatar Foundation
Preslav Nakov
†ALT, QCRI, HBKU, Qatar Foundation
In this article, we explore the potential of using sentence-level discourse structure for machine translation evaluation. We first design discourse-aware similarity measures, which use all-subtree kernels to compare discourse parse trees in accordance with the Rhetorical Structure Theory (RST). Then, we show that a simple linear combination with these measures can help improve various existing machine translation evaluation metrics regarding correlation with human judgments both at the segment level and at the system level. This suggests that discourse information is complementary to the information used by many of the existing evaluation metrics, and thus it could be taken into account when developing richer evaluation metrics, such as the WMT-14 winning combined metricDISCOTKparty. We also provide a detailed analysis of the relevance of various discourse elements and relations from the RST parse trees for machine translation evaluation. In particular, we show that (i) all aspects of the RST tree are relevant, (ii) nuclearity is more useful than relation type, and (iii) the similarity of the translation RST tree to the reference RST tree is positively correlated with translation quality.
∗School of Computer Science and Engineering, Nanyang Technological University. E-mail:[email protected].
∗∗Applied Machine Learning Group, Facebook. E-mail:[email protected].
†HBKU Research Complex B1, P.O. Box 5825, Doha, Qatar. E-mail:{lmarquez,pnakov}@qf.org.qa.
Submission received: 26 August 2016; revised version received: 12 December 2016; accepted for publication: 21 April 2017.
1. Introduction
From its foundations, Statistical Machine Translation (SMT) as a field had two defining characteristics. First, translation was modeled as a generative process at the sentence level. Second, it was purely statistical over words or word sequences and made little to no use oflinguistic information(Brown et al. 1993; Koehn, Och, and Marcu 2003).
Although modern SMT systems switched to a discriminative log-linear framework (Och 2003; Watanabe et al. 2007; Chiang, Marton, and Resnik 2008; Hopkins and May 2011), which allows for additional sources as features, it is generally hard to incorporate dependencies beyond a small window of adjacent words, thus making it difficult to use linguistically rich models.
One of the fruitful research directions for improving SMT has been the usage of more structured linguistic information. For instance, in SMT we find systems based on syntax (Galley et al. 2004; Quirk, Menezes, and Cherry 2005), hierarchical struc-tures (Chiang 2005), and semantic roles (Wu and Fung 2009; Lo, Tumuluru, and Wu 2012; Bazrafshan and Gildea 2014). However, it was not until recently that syntax-based SMT systems started to outperform their phrase-syntax-based counterparts, especially for language pairs that need long-distance reordering such as Chinese–English and German–English (Nadejde, Williams, and Koehn 2013).
Another less-explored way consists of going beyond the sentence-level; for exam-ple, translating at the document level or taking into account broader contextual infor-mation. The idea is to obtain adequate translations respecting cross-sentence relations and enforcing cohesion and consistency at the document level (Hardmeier, Nivre, and Tiedemann 2012; Ben et al. 2013; Louis and Webber 2014; Tu, Zhou, and Zong 2014; Xiong, Zhang, and Wang 2015). Research in this direction has also been the focus of the two editions of the DiscoMT workshop, in 2013 and 2015 (Webber et al. 2013, 2015; Hardmeier et al. 2015).
Automatic MT evaluationis an integral part of the process of developing and tuning an SMT system. Reference-based evaluation measures compare the output of a system to one or more human translations (calledreferences) and produce a similarity score indicating the quality of the translation. The first metrics approached similarity as a shallow word n-gram matching between the translation and one or more references, with a limited use of linguistic information. BLEU (Papineni et al. 2002) is the best-known metric in this family, and has been used for years as the evaluation standard in the MT community. BLEU can be efficiently calculated and has shown good correlation with human assessments when evaluating systems on large quantities of text. However, it is also known that BLEU and similar metrics are unreliable for high-quality trans-lation output (Doddington 2002; Lavie and Agarwal 2007), and they cannot tell apart raw machine translation output from a fully fluent professionally post-edited version thereof (Denkowski and Lavie 2012). Moreover, lexical-matching similarity has been shown to be both insufficient and not strictly necessary for two sentences to convey the same meaning (Coughlin 2003; Culy and Riehemann 2003; Callison-Burch, Osborne, and Koehn 2006).
Beyond all previous considerations, MT systems are usually evaluated by com-puting translation quality on individual sentences and performing some simple aggre-gation to produce the system-level evaluation scores. To the best of our knowledge, semantic relations between clauses in a sentence and between sentences in a text have not been seriously explored. However, clauses and sentences rarely stand on their own in a well-written text; rather, the logical relationship between them carries significant information that allows the text to express a meaning as a whole. Each clause follows smoothly from the ones before it and leads into the ones that come afterward. This logi-cal relationship between clauses forms acoherence structure(Hobbs 1979). In discourse analysis, we seek to uncover this coherence structure underneath the text.
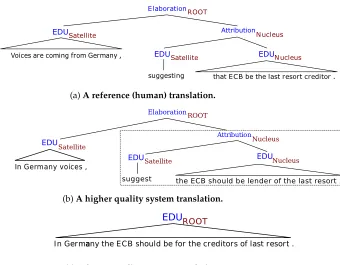
Several formal theories of discourse have been proposed to describe the coherence structure (Mann and Thompson 1988; Asher and Lascarides 2003; Webber 2004). Rhetor-ical Structure Theory (RST; Mann and Thompson 1988) is perhaps the most influential of these in computational linguistics, where it is used either to parse the text in language understanding or to plan a coherent text in language generation (Taboada and Mann 2006). RST describes coherence using discourse relations between parts of a text and postulates a hierarchical tree structure calleddiscourse tree. For example, Figure 1 in the next section shows discourse trees for three different translations of a source sentence.
Modeling discourse brings together the usage of higher-level linguistic information and the exploration of relations between clauses and sentences in a text, which makes it a very attractive goal for MT and its evaluation. We believe that the semantic and pragmatic information captured in the form of discourse trees (i) can yield better
ElaborationROOT
EDU AttributionN ucleus
Satellite
Voices are coming from Germany , EDUSatellite EDUN ucleus
suggesting that ECB be the last resort creditor .
(a)A reference (human) translation.
ElaborationROOT
EDUSatellite AttributionNucleus
In Germany voices ,
EDUSatellite EDUNucleus
suggest the ECB should be lender of the last resort .
(b)A higher quality system translation.
EDUROOT
In Germaaany the ECB should be for the creditors of last resort .
[image:3.486.64.404.351.616.2](c)A lower quality system translation.
Figure 1
MT evaluation metrics, and (ii) can help develop discourse-aware SMT systems that produce more coherent translations.
In this work, we focus on the first of the two previous research hypotheses. Specifically, we show that sentence-level discourse information can be used to produce reference-based evaluation measures that perform well on their own, but more impor-tantly, can be used to improve over many existing MT evaluation metrics regarding correlation with human assessments. We conduct our research in three steps. First, we design a simple discourse-aware similarity measure, DR-LEX, based on RST trees, gen-erated with a publicly available discourse parser (Joty, Carenini, and Ng 2015), and the well-knownall subtreekernel (Collins and Duffy 2001). The subtree kernel computes a similarity value by comparing the discourse tree representation of a system translation with that of a reference translation. We show that a simple uniform linear combination with this metric helps to improve a large number of MT evaluation metrics at the segment-level and at the system-level in the context of the WMT11 and the WMT12 metrics shared task benchmarks (Callison-Burch et al. 2011, 2012). Second, we show that tuning (i.e., learning) the weights in the linear combination of metrics using human-assessed examples is a robust way to improve the effectiveness of the DR-LEXmetric significantly. Following the idea of an interpolated combination, we put together several variants of our discourse metric (using different tree-based representations) with many strong pre-existing metrics provided by the ASIYAtoolkit for MT evaluation (Gonz`alez, Gim´enez, and M`arquez 2012). The result is DISCOTKparty, which scored best at the WMT14 Metrics task (Bojar et al. 2014), both at the system level and at the segment level. Third, we conduct an ablation study that helps us understand which elements of the discourse parse tree have the highest impact on the quality of the evaluation measure. Interestingly enough, the nuclearity feature (i.e., the distinction between main and subordinate units) of the RST tree turns out to be more important than the discourse relation types (e.g.,Elaboration, Contrast).
Note that, although extensive, this study is restricted to sentence-level evalua-tion, which arguably can limit the benefits of using global discourse properties (i.e., document-level discourse structure). Fortunately, many sentences are long and com-plex enough to present rich discourse structures connecting their basic clauses. Thus, although limited, this setting can demonstrate the potential of discourse-level informa-tion for MT evaluainforma-tion. Furthermore, sentence-level scoring is compatible with most translation systems, which work on a sentence-by-sentence basis. It could also be beneficial to modern MT tuning mechanisms such as PRO (Hopkins and May 2011) and MIRA (Watanabe et al. 2007; Chiang, Marton, and Resnik 2008), which also work at the sentence level. Finally, it could also be used for re-rankingn-best lists of translation hypotheses.
The rest of the paper is organized as follows. Section 2 introduces our proposal for a family of discourse-based similarity metrics. Sections 3 and 4 describe the experimental setting and the evaluation of the discourse-based metrics, alone and in combination with other pre-existing measures. Section 5 empirically analyzes the main discourse-based metric and performs an ablation study to better understand its contributions. Finally, Sections 6 and 7 discuss related work and present the conclusions together with some directions for future research.
2. Discourse-Based Similarity Measures
a text. For example, Asher and Lascarides (2003) proposed the Segmented Discourse Representation Theory, which is driven by sentence semantics. Webber (2004) and Danlos (2009) extended the sentence grammar to formalize discourse structure. Mann and Thompson (1988) proposed RST, which was inspired by empirical analysis of authentic texts. Although RST was initially intended to be used for text generation, it later became popular as a framework for parsing the structure of a text. This work relies on RST-based coherence structure.
RST posits a tree representation of a text, known as a discourse tree. As shown in Figure 1(a), the leaves of a discourse tree (three in this example) correspond to contiguous atomic clause-like text spans, calledelementary discourse units (EDUs), which serve as building blocks for constructing the tree. In the tree, adjacent EDUs are connected by certaincoherence relations (e.g., Elaboration,Attribution), thus forming larger discourse units, which in turn are also subject to this process of relation-based linking. Discourse units that are linked by a relation are further distinguished based on their relative importance in the text:nucleiare the core arguments of the relation, and satellitesare supportive ones. A discourse relation can be eithermononuclearor multi-nuclear. A mononuclear relation connects a nucleus and a satellite (e.g., Elaboration,
Attributionin Figure 1(a)), where a multinuclear relation connects two or more nuclei (e.g.,Joint, Contrast). Thus, an RST discourse tree comprises four types of elements: (i) EDUs that comprise textual information, (ii) the structure or skeleton of the tree, (iii) nuclearity statuses of the discourse units, and (iv) coherence relations by which adjacent discourse units are linked.
Our hypothesis in this article is that the similarity between the discourse trees of an automatic translation and of a reference translation provides additional information that can be valuable for evaluating MT systems. In particular, we believe that better system translations should be more similar to the human translations in their discourse structures than worse ones. As an example, consider the three discourse trees shown in Figure 1: (a) for a reference translation, and (b) and (c) for translations of two different systems from the WMT12 competition. Notice that the tree structure, the nuclearity statuses, and the relation labels in the reference translation are also realized in the sys-tem translation in Figure 1(b), but not in Figure 1(c); this makes (b) a better translation compared with (c), according to our hypothesis. We argue that existing metrics that only use lexical and syntactic information cannot distinguish well between the translations in Figure 1(b) and Figure 1(c).
In order to develop a discourse-aware evaluation metric, we first generate discourse trees for the reference-translated and the system-translated sentences using an RST discourse parser, and then we measure the similarity between the two trees. We describe these two steps in more detail next.
2.1 Generating Discourse Trees
Conventionally, discourse analysis in RST involves two main subtasks: (i) discourse segmentation, or breaking the text into a sequence of EDUs, and (ii)discourse parsing, or the task of linking the discourse units (which could be EDUs or larger units) into labeled discourse trees. Recently, Joty, Carenini, and Ng (2012, 2015) proposed discriminative models for discourse segmentation and discourse parsing. Their discourse segmenter uses a maximum entropy model and achieves state-of-the-art performance with an F1-score of 90.5, whereas human agreement for this task is 98.3 in F1-score.
discourse tree constituents. The inferred (posterior) probabilities are then used in a probabilistic CKY-like bottom–up parsing algorithm to find the most likely parse. Using the standard set of 18 coarse-grained discourse relations,1the discourse parser achieved anF1-score of 79.8% at the sentence level, which is close to the human agreement of 83%. These high numbers inspired us to develop discourse-aware MT evaluation metrics.2
2.2 Measuring Similarity Between Discourse Trees
A number of metrics have been proposed to measure the similarity between two labeled trees—for example, Tree Edit Distance (Tai 1979) and various Tree Kernels (TKs) (Collins and Duffy 2001; Smola and Vishwanathan 2003; Moschitti 2006). One advantage of tree kernels is that they provide an effective way to integrate tree structures in kernel-based learning algorithms like SVMs, and learn from arbitrary tree fragments as features.
Collins and Duffy (2001) proposed a syntactic tree kernel to efficiently compute the number of common subtrees in two syntactic trees. To comply with the rules (or productions) of a context-free grammar in syntactic parsing, the subtrees in this kernel are subject to the constraint that their nodes are taken with either all or none of the children. Because the same constraint applies to discourse trees, we use the same tree kernel in our work. Figure 2 shows the valid subtrees according to the syntactic tree kernel for the discourse tree in Figure 1(a). Note that in this work we use the tree kernel only to measure the similarity between two discourse trees rather than to learn subtree features in a supervised kernel-based learning framework like SVM. As an example of the latter, see our more recent work (Guzm´an et al. 2014a), which uses tree kernels over syntactic and discourse structures in an SVM preference ranking framework.
Collins and Duffy (2001) proposed two modifications of the kernel when using it in a classifier (e.g., SVM) to avoid the classifier behaving like a nearest neighbor rule: (i) to restrict the tree fragments considered in the kernel computation based on their depth, and/or (ii) to assign relative weights to the tree fragments based on their size. Because we do not use the kernel in a learning algorithm, these modifications do not apply to us; all subtrees are equally weighted in our kernel.
Figure 2 shows that, when applied to discourse trees, the syntactic tree kernel may limit us on the type of substructures that we wish to compare. For example, although matching the complete production (i.e., a parent with all of its children) may make more sense for subtrees with internal nodes only (i.e., non-terminals), we may want to relax this constraint at the terminal (text) level to allow word subsequence matches.
One way to cope with this limitation of the tree kernel is to change the represen-tation of the trees to a form that is suitable to capture the relevant information for our task. For example, in order to allow for the syntactic tree kernel to find subtree matches at the word unigram level, we can include an artificial layer of leaves (e.g., by copying the samedummylabel below each word). In this way, the words become pre-terminal nodes and can be matched against the words in the other tree.
Apart from this modification to match subtrees at the word level, we experimented with different representations of a discourse tree, each of which produces a different discourse-based evaluation metric. In this section we present two basic representations of the discourse tree, namely, DR and DR-LEX, which we will use in Section 4 to
1 See Carlson and Marcu (2001) for a detailed description of the discourse relations.
EDUSatellite EDU Satellite
EDU Satellite
Nucleus
Attribution Elaboration
EDU EDU
Satellite Nucleus
suggesting that ECB be the last resort creditor . Voices are coming from Germany ,
AttributionNucleus
EDUSatellite EDUNucleus
suggesting that ECB be the last creditor . EDU
AttributionNucleus EDU
Satellite
EDU Nucleus
ROOT ROOT
Attribution
EDU Nucleus
Elaboration
Satellite
[image:7.486.54.434.59.273.2]suggesting that ECB be the last creditor . Voices are coming from Germany ,
Figure 2
Discourse subtrees used by the syntactic tree kernel for the tree in Figure 1(a).
[image:7.486.63.435.433.626.2]demonstrate that the discourse measures are synergetic with several widely used MT evaluation metrics (DR stands for discourse representation).
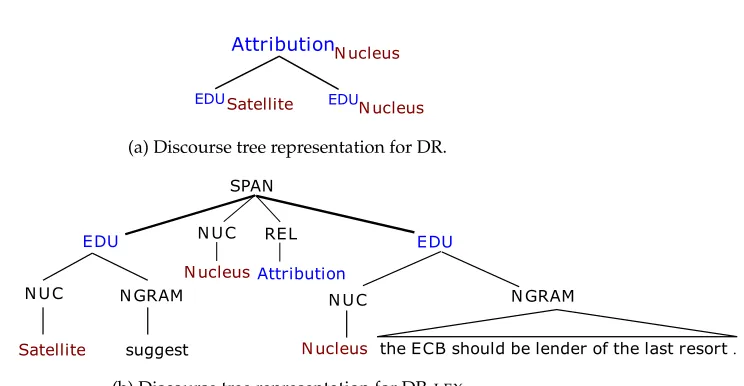
Figure 3 shows the two representations DR and DR-LEXfor the highlighted subtree in Figure 1b, that spans the text:suggest the ECB should be the lender of last resort. As shown in Figure 3(a), DR does not include any lexical item. Therefore, the syntactic tree kernel, when applied to this representation of the discourse tree, measures the similarity between two candidate translations in terms of their discourse representations only.
Attribution
Satellite
N ucleus
N ucleus
EDU EDU
(a) Discourse tree representation for DR.
SPAN
EDU EDU
N UC N GRAM N UC N GRAM
Satellite suggest N ucleus the ECB should be lender of the last resort.
N UC
N ucleus REL
Attribution
(b) Discourse tree representation for DR-LEX
Figure 3
On the contrary, DR-LEX, as shown in Figure 3(b), includes the lexical items to account for lexical matching; moreover, it separates the structure (skeleton) of the tree from its labels (i.e., the nuclearity statuses and the relation labels). This allows the syntactic tree kernel to give partial credit to subtrees that differ in labels but match in their skeletons, or vice versa. More specifically, DR-LEX uses the predefined tags SPAN and EDU to build the skeleton of the tree, and considers the nuclearity and/or the relation labels as properties, added as children, of these tags. For example, a SPAN has two properties (its nuclearity status and its relation label), whereas an EDU has only one property (its nuclearity status). The words of an EDU are placed under another predefined tag NGRAM. To allow the tree kernel to find subtree matches at the word level, we also include an additional layer ofdummyleaves (for simplicity, not shown in Figure 3(b)).
3. Experimental Setting
In this section, we describe the data sets we used in our experiments, the interpolation approach we applied to combine our discourse-based metrics with pre-existing evalua-tion metrics, and all the correlaevalua-tion measures we used for evaluaevalua-tion.
3.1 Data Sets
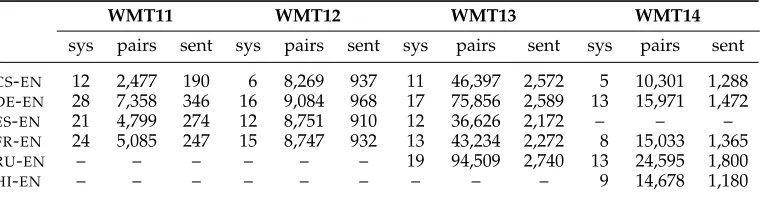
In our experiments, we used the data available for the WMT11, WMT12, WMT13, and WMT14 metrics shared tasks for translations into English.3 This includes the output from the systems that participated in the MT evaluation campaigns in those four years and the corresponding English reference translations. The WMT11 and WMT12 data sets contain 2,000 and 3,003 sentences, respectively, for each of the following four lan-guage pairs: Czech–English (CS-EN), French–English (FR-EN), German–English (DE-EN), and Spanish–English (ES-EN). In WMT13, the Russian–English (RU-EN) pair was added to the mix, and the data set has 3,000 sentences for each of the five language pairs. WMT14 droppedES-ENand included Hindi–English (HI-EN), with each language pair having 3,003 sentences, except forHI-EN, for which there were 2,507 sentences.
The task organizers provided human judgments on the quality of the systems’ translations. These judgments represent rankings of the output of five systems chosen at random, for a particular language pair and for a particular sentence. The overall cover-age (i.e., the number of unique sentences that were evaluated) was only a fraction of the total (see Table 1). For example, for WMT11FR-EN, only 247 out of 3,000 sentences have human judgments. Although the evaluation set-up of WMT evaluation is performed in a sentence-level fashion, we believe that it is adequate for our purpose. The annotation interface allowed human judges to take longer-range discourse structure into account, as they were shown the source and the human reference translations in the context of one preceding and one following sentences.4
Table 1 shows the main statistics about the data that we used fortraining, where we excluded all pairs for which: (i) both translations were judged as equally good, or (ii) the number of votes for translation1being better than translation2equals the number of votes for it being worse than translation2. Moreover, we ignored repetitions—that is, if two judges voted the same way, we did not create two training examples, but just one
3http://www.statmt.org/wmtYY/results.html, with YY in{11, 12, 13, 14}.
Table 1
Number of systems (sys), unique non-tied translation pairs (pairs), and unique sentences for which such pairs exist (sent) for the different language pairs, for the human evaluation of the
WMT11-WMT14 metric shared tasks. These statistics show what we use fortraining; the
numbers fortestingare higher, as explained in the text.
WMT11 WMT12 WMT13 WMT14
sys pairs sent sys pairs sent sys pairs sent sys pairs sent
CS-EN 12 2,477 190 6 8,269 937 11 46,397 2,572 5 10,301 1,288
DE-EN 28 7,358 346 16 9,084 968 17 75,856 2,589 13 15,971 1,472
ES-EN 21 4,799 274 12 8,751 910 12 36,626 2,172 – – –
FR-EN 24 5,085 247 15 8,747 932 13 43,234 2,272 8 15,033 1,365
RU-EN – – – – – – 19 94,509 2,740 13 24,595 1,800
HI-EN – – – – – – – – – 9 14,678 1,180
(note, however, that on testing, repetitions will be accounted for). Excluding ties and repetitions reduces the number of training pairs significantly (e.g., for WMT13CS-EN, we have 46,397 pairs, whereas initially there were 85,469 judgments in total).
Note, however, that for testing, we used the official full data sets, where we used all pairwise judgments, including judgments saying that both translations are equally good, ties in the number of wins of translation1vs. translation2and repetitions. This is important to make our results fully comparable to previously published work.
As a final analysis on the WMT corpora, we studied the complexity of the discourse trees. Recall that we imposed the limitation of working with discourse structures at the sentence level. If we want the discourse metrics to be impactful, we need to make sure that a significant number of sentences have non-trivial discourse trees.
Figure 4 shows the proportion of sentences by discourse tree depth for the WMT11, WMT12, and WMT13 data sets. We computed these statistics with our automatic discourse parser applied to the reference translations. As can be seen, the three data sets show very similar curves. One relevant observation is that more than 70% of the sentences have a non-trivial discourse tree (depth >0). Of course, the proportion of sentences decreases quickly with the tree depth. About 20% of the sentences have trees of depth 2 and slightly over 10% have trees of depth 3. The average depth for the three data sets is 1.77, with a minimum absolute value of 0 and a maximum of 32. The number of EDUs contained in those trees average to 2.77, with a minimum number of 1 and a maximum number of 33. Although the impact of discourse information is potentially higher at the paragraph level or document level, we showed that we have complex enough sentences in our data sets in terms of discourse structure. Thus, we have justified that there is potential in testing the effect of discourse information in MT evaluation metrics.
3.2 Learning Interpolation Weights for Metric Combination
0 2 4 6 8 10 0
0.1 0.2 0.3
Depth of discourse tree
Pr
oportion
of
sentences
[image:10.486.55.255.60.231.2]WMT11 WMT12 WMT13
Figure 4
Distribution of sentences by tree depth computed based on the reference translations of WMT11, WMT12, and WMT13.
as A>B>C>D>E, this would entail the following ten pairwise rankings:A>B,
A>C, A>D, A>E, B>C, B>D, B>E, C>D, C>E, and D>E. We then use a maximum entropy learning framework to learn the interpolation weights, where the classification task is to distinguish a better translation from a worse one for each pair of translation hypotheses. The log likelihood of the training data withl2regularization on the weight parameters w is:
J(w)=
N
X
i=1
yilog Sig wT(u1i −u2i)
+(1−yi) log 1−Sig(wT(u1i −u2i))
+λwTw (1)
where Sig(x) is thesigmoid(aka logistic) function, the u1i and u2i vectors represent the values of the evaluation measures we are combining for the two translations in the pair
i=(t1,t2), andyi∈ {1, 0}is the human assessment for the pair, that is, yi=1 if t1 is better than t2, otherwise yi=0. We learn the model parameters w using the L-BFGS fitting algorithm, which is time- and space-efficient. We learn the regularization strength parameterλusing 5-fold cross-validation on the training data set.5
Note that our approach to learn the interpolation weights is similar to the one used by PRO for tuning the relative weights of the components of a log-linear SMT model (Hopkins and May 2011). Unlike PRO, (i) we usedhuman judgments, not auto-matic scores, and (ii) we trained onall pairs, not on a subsample.
3.3 Correlation Measures
In our experiments, we only considered translation into English (as we had a discourse parser for English only), and we used the data described in Table 1. For evaluation, we followed the standard set-up of the Metrics task of WMT12 (Callison-Burch et al. 2012). For segment-level evaluation, we used Kendall’sτ(Kendall 1938), which can be
calculated directly from the human pairwise judgments. For system-level evaluation, we used Spearman’s rank correlation (Spearman 1904) and, in some cases, also Pearson correlation (Pearson 1895), which are appropriate correlation measures as here we have vectors of scores.
We measured the correlation of the evaluation metrics with the human judgments provided by the task organizers. As we explained earlier, the judgments represent rankings of the output of five systems chosen at random, for a particular sentence also chosen at random. From each of those rankings, we produce ten pairwise judgments (see Section 3.2). Then, using those pairwise human judgments, we evaluated the per-formance of the different MT evaluation metrics at the segment or at the system level.
3.3.1 Segment-Level Evaluation.We used Kendall’sτto measure the correlations between the segment-level scores6given by a target evaluation metric and the human judgments. Kendall’sτis defined as follows:
τ= #concordant−#discordant
#concordant+#discordant (2)
where #concordantis the number of concordant translation pairs (i.e., pairs for which the human ranking and the corresponding metric scores agree) and #discordantis the num-ber of pairs for which the human ranking and the metric score disagree. For example, if the human judgment is that the translation of systemsi for segmentkis better than the translation of systemsjfor segmentk, this pair will be considered concordant if the metric gives higher score tosithan tosjfor segmentk.
The value of Kendall’sτranges between−1 (all pairs are discordant) and 1 (all pairs are concordant), and negative values are worse than positive ones. Note that different sets of systems may be ranked for the different segments, but in the calculations we only use pairs of systems for which we have human judgments. Such direct judgments are available for a particular language pair and for a particular segment. We do not calculate Kendall’sτfor each language pair; instead, we consider all pairwise judgments as part of a single set (as implemented in the official WMT scripts).
In the original Kendall’sτ(Kendall 1938), comparisons with human or metric ties are considered neither concordant nor discordant. In the experiments in Section 4, we used the official scorers from the WMT Metrics tasks to compute Kendall’s τ. More precisely, in Sections 4.1 and 4.2 we use the WMT12 version of Kendall’sτ (Callison-Burch et al. 2012), whereas in Section 4.3 we report results using the WMT14 scorer (Mach´aˇcek and Bojar 2014). We used these two different versions of the software to allow a direct comparison to the official results that were reported for the metrics task in WMT12 (Callison-Burch et al. 2012) and WMT14 (Mach´aˇcek and Bojar 2014).
3.3.2 System-Level Evaluation.For the correlation at the system level, we first produce a score for each of the systems according to the quality of their translations based on the evaluation metrics and on the human judgments. Then, we calculate the corre-lation between the scores for the participating systems using a target metric’s scores and the human scores. We do this based on system ranks induced by the scores (us-ing Spearman’s rank correlation) or based on the scores themselves (us(us-ing Pearson correlation). Note that, following WMT, we calculate the correlation score separately
for each language pair, and then we average the resulting correlations to obtain the final score.
Segment-to-system Score Aggregation.In order to produce a system-level score based on the pairwise sentence-level human judgments, we need to aggregate these judgments, which we do based on the ratio of wins (ignoring ties), as defined for the official ranking at WMT12 (Callison-Burch et al. 2012):7
score(si)=win(swin(si)
i)+loss(si) (3)
where win(si) and loss(si) are the number of wins and losses, respectively, of systemsi against any other system in the segment-level pairwise human judgments.
Spearman’s Rank Correlation.This is the WMT12 official metric for system-level evalua-tion. To calculate it, we first convert the raw scores assigned to each system to ranks, and then we use the following formula (Spearman 1904):
ρ=1− 6
P
d2i
n(n2−1) (4)
wherediis the difference between the ranks for systemi, andnis the number of systems being evaluated. Note that this formula requires that there be no ties in the ranks of the systems (based on the automatic metric or based on the human judgments), which was indeed the case. Spearman’s rank correlation ranges between−1 and 1. However, unlike Kendall’s τ, here the sign does not matter, and high absolute values indicate better performance. In our experiments, we used the official script from WMT12.
In some experiments, we also report Pearson correlation (Pearson 1895), which was the official system-level score at WMT14. This is a more general correlation coefficient than Spearman’s and does not require that allnranks be distinct integers. It is defined as follows:
r=
Pn
i=1(Hi−H¯)(Mi−M¯)
pPn
i=1(Hi−H¯)2pPni=1(Mi−M¯)2
(5)
whereHis the vector of the human scores of all participating systems,Mis the vector of the corresponding scores as predicted by the given metric, and ¯Hand ¯Mare the means forHandM, respectively.
The Pearson correlation value ranges between −1 and 1, where higher absolute score is better. We used the official WMT14 scoring tool to calculate it.
4. Evaluation of the Discourse-Based Metrics
In this section, we show the utility of discourse information for machine translation evaluation. We present the evaluation results at the system level and at the segment level, using our two basic discourse-based metrics, which we refer to as DR and DR-LEX
(Section 2.1). In our experiments, we combine DR and DR-LEX with other evaluation metrics in two different ways: using uniform linear interpolation (at the system level and at the segment level), and using a tuned linear interpolation for the segment-level. We only present the average results over all language pairs. For clarity, in our tables we show results divided into three evaluation groups:
Group Icontains our discourse-based evaluation metrics, DR, and DR-LEX.
Group II includes the publicly available MT evaluation metrics that participated in the WMT12 metrics task, excluding those that did not have results for all language pairs (Callison-Burch et al. 2012). More precisely, they are SPEDE07PP, AMBER, METEOR, TERRORCAT, SIMPBLEU, XENERRCATS, WORDBLOCKEC, BLOCKERRCATS, andPOSF.
Group IIIcontains other important individual evaluation metrics that are commonly used in MT evaluation: BLEU (Papineni et al. 2002), NIST (Doddington 2002), ROUGE(Lin 2004), and TER (Snover et al. 2006). We calculated the metrics in this group using Asiya. In particular, we used the following Asiya versions of TER and ROUGE: TERP-A and ROUGE-W.8
For each metric in groups II and III, we present the system-level and segment-level results for the original metric as well as for the linear interpolation of that metric with DR and with DR-LEX. The combinations with DR and DR-LEX that improve over the original metrics are shown inbold, and those that yield degradation are initalic.
For the segment-level evaluation, we further indicate which interpolated results yield statistically significant improvement over the original metric. Note that testing statistical significance is not trivial in our case because we have a complex correlation score for which the assumptions that standard tests make are not met. We thus resorted to a non-parametric randomization framework (Yeh 2000), which is commonly used in NLP research.9
4.1 System-Level Results
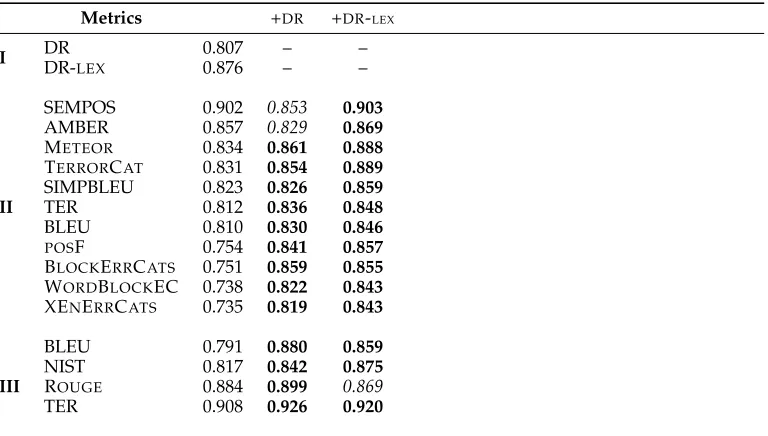
Table 2 shows the system-level experimental results for WMT12. We can see that DR is already competitive by itself: On average, it has a correlation of 0.807, which is very close to the BLEU and the TER scores from group II (0.810 and 0.812, respectively). Moreover, DR yields improvements when combined with 13 of the 15 metrics, with a resulting correlation higher than those of the two individual metrics being combined. This fact suggests that DR contains information that is complementary to that used by most of the other metrics.
As expected, DR-LEX performs better than DR because it is lexicalized (at the unigram level), and also gives partial credit to correct structures. Individually, DR-LEX
outperforms most of the metrics from group II, and ranks as the second best metric in that group. Furthermore, when combined with individual metrics, DR-LEXis able to improve 14 out of the 15 metrics. Averaging over all metrics in the table, the combination
8 These variants are described in page 19 of the ASIYAmanual (http://asiya.lsi.upc.edu/).
Table 2
Results on WMT12 at the system-level (calculated on 6 systems forCS-EN, 16 forDE-EN, 12 for
ES-EN, and 15 forFR-EN). Spearman’s correlation with human judgments.
Metrics +DR +DR-LEX
I DRDR- 0.807 – –
LEX 0.876 – –
II
SEMPOS 0.902 0.853 0.903
AMBER 0.857 0.829 0.869
METEOR 0.834 0.861 0.888
TERRORCAT 0.831 0.854 0.889
SIMPBLEU 0.823 0.826 0.859
TER 0.812 0.836 0.848
BLEU 0.810 0.830 0.846
POSF 0.754 0.841 0.857
BLOCKERRCATS 0.751 0.859 0.855
WORDBLOCKEC 0.738 0.822 0.843
XENERRCATS 0.735 0.819 0.843
III
BLEU 0.791 0.880 0.859
NIST 0.817 0.842 0.875
ROUGE 0.884 0.899 0.869
TER 0.908 0.926 0.920
of DR improves the average of the individual metrics correlation from 0.816 to 0.852 (+0.035) and DR-LEXfurther improves the average results up to 0.868 (+0.052).
Thus, we can conclude that at the system level, adding discourse information to a metric, even using the simplest of the combination schemes, is a good idea for most of the metrics.
4.2 Segment-Level Results
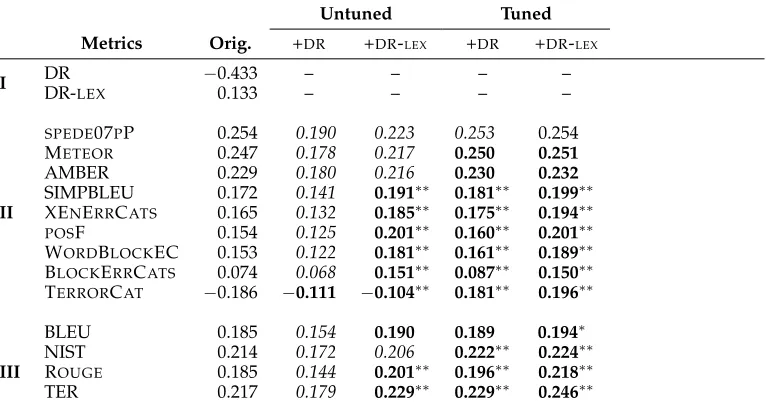
Table 3 shows the results for WMT12 at the segment-level. We can see that DR performs badly, with a high negative Kendall’sτof−0.433. This should not be surprising because (i) the discourse tree structure alone does not contain enough information for a good evaluation at the segment level, and (ii) this metric is more sensitive to the quality of the DT, which can be wrong or void. Moreover, DR is more likely to produce a high number of ties, which is harshly penalized by WMT12’s definition of Kendall’s
τ. Conversely, ties and incomplete discourse analysis were not a problem at the system level, where evidence from all 3,003 test sentences is aggregated, allowing us to rank systems more precisely. Because of the low score of DR as an individual metric, it fails to yield improvements when uniformly combined with other metrics (see Untuned +DR column in Table 3).
Table 3
Results on WMT12 at the segment-level (calculated on 11,021 pairs forCS-EN, 11,934 forDE-EN,
9,796 forES-EN, and 11,594 forFR-EN): untuned and tuned versions. Kendall’sτwith human
judgments. Improvements over the baseline are shown inbold, and statistically significant
improvements are marked with∗∗and∗for p-value<0.01 and p-value<0.05, respectively.
Untuned Tuned
Metrics Orig. +DR +DR-LEX +DR +DR-LEX
I DRDR- −0.433 – – – –
LEX 0.133 – – – –
II
SPEDE07PP 0.254 0.190 0.223 0.253 0.254
METEOR 0.247 0.178 0.217 0.250 0.251
AMBER 0.229 0.180 0.216 0.230 0.232
SIMPBLEU 0.172 0.141 0.191∗∗ 0.181∗∗ 0.199∗∗
XENERRCATS 0.165 0.132 0.185∗∗ 0.175∗∗ 0.194∗∗
POSF 0.154 0.125 0.201∗∗ 0.160∗∗ 0.201∗∗
WORDBLOCKEC 0.153 0.122 0.181∗∗ 0.161∗∗ 0.189∗∗
BLOCKERRCATS 0.074 0.068 0.151∗∗ 0.087∗∗ 0.150∗∗
TERRORCAT −0.186 −0.111 −0.104∗∗ 0.181∗∗ 0.196∗∗
III
BLEU 0.185 0.154 0.190 0.189 0.194∗
NIST 0.214 0.172 0.206 0.222∗∗ 0.224∗∗
ROUGE 0.185 0.144 0.201∗∗ 0.196∗∗ 0.218∗∗
TER 0.217 0.179 0.229∗∗ 0.229∗∗ 0.246∗∗
Following the learning method described in Section 3.2, we experimented also with tuning the interpolation weights in the metric combinations. We report results for (i) cross-validation on WMT12, and (ii) tuning on WMT12 and testing on WMT11.
Cross-validation on WMT12.For cross-validation on WMT12, we used ten folds of ap-proximately equal sizes, each containing about 300 sentences; we constructed the folds by putting together entire documents, thus not allowing sentences from a document to be split over two different folds. During each cross-validation run, we trained our pairwise ranker using the human judgments corresponding to nine of the ten folds. We then used the remaining fold for evaluation. Note that in this process, we aggregated the data for different language pairs, and we produced a single set of tuning weights for all language pairs.10
The results are shown in the last two columns of Table 3 (Tuned). We can see that the tuned combinations with DR-LEXimprove over all but one of the individual metrics in groups II and III, with statistically significant differences in 10 out of the 12 cases. Even more interestingly, the tuned combinations that include the much weaker metric DR now improve over 12 out of 13 of the individual metrics, with 9 of these differences being statistically significant with p-value<0.01. This is remarkable given that DR has a strong negativeτas an individual metric at the sentence-level. Again, these results suggest that both DR and DR-LEXcontain information that is complementary to that of the individual metrics that we experimented with.
Averaging over all 13 cases, DR improves Kendall’sτfrom 0.159 to 0.193 (+0.035), and DR-LEX improves it to 0.211 (+0.053). These sizable improvements highlight the importance of tuning the linear combination when working at the segment level.
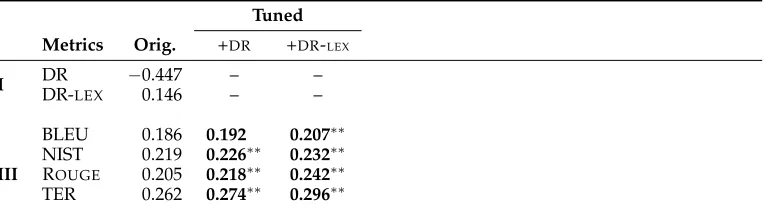
Testing on WMT11.To rule out the possibility that the improvement of the tuned metrics on WMT12 could have come from over-fitting, and also in order to verify that the tuned metrics generalize when applied to other sentences, we also tested on an additional data set: WMT11. We tuned the weights for our metric combinations on all WMT12 pairwise judgments (no cross-validation), and we evaluated them on the WMT11 data set. Because the metrics that participated in WMT11 and WMT12 are different (and even when they have the same name, there is no guarantee that they have not changed from 2011 to 2012), this time we only report results for the standard group III metrics, thus ensuring that the metrics in the experiments are consistent for 2011 and 2012.
The results, presented in Table 4, show the same pattern as before: (i) adding DR and DR-LEXimprove overall individual metrics, with the differences being statistically significant in seven out of the eight cases with p-value<0.01; and (ii) the contribution of DR-LEXis consistently larger than that of DR. Observe that these improvements are very close to those for the WMT12 cross-validation. This shows that the weights learned on WMT12 generalize well, as they are also good for WMT11.
4.3 DR-Based Metrics in a Strong MT Evaluation Measure
From the results presented in the previous sections, we can conclude that discourse structure is an important information source, which is not entirely correlated to other information sources considered so far, and thus should be taken into account when designing future metrics for automatic evaluation of machine translation output. In this section we show how the simple combination of DR-based metrics with a selection of other existing strong MT evaluation metrics can lead to a very competitive evaluation metric, DISCOTKparty (Joty et al. 2014), which we presented at the metrics task of WMT14 (Mach´aˇcek and Bojar 2014).
[image:16.486.51.433.554.660.2]ASIYA (Gim´enez and M`arquez 2010a) is a suite for MT evaluation that provides a large set of metrics using different levels of linguistic information. We used the 12 individual metrics from ASIYA’s ULC (Gim´enez and M`arquez 2010b), which was
Table 4
Results on WMT11 at the segment-level (calculated on 3,695 pairs forCS-EN, 8,950 forDE-EN,
5,974 forES-EN, and 6,337 forFR-EN): tuning on the entire WMT12. Kendall’sτwith human
judgments. Improvements over the baseline are shown inbold, and statistically significant
improvements are marked with∗∗for p-value<0.01.
Tuned
Metrics Orig. +DR +DR-LEX
I DR −0.447 – –
DR-LEX 0.146 – –
III
BLEU 0.186 0.192 0.207∗∗
NIST 0.219 0.226∗∗ 0.232∗∗
ROUGE 0.205 0.218∗∗ 0.242∗∗
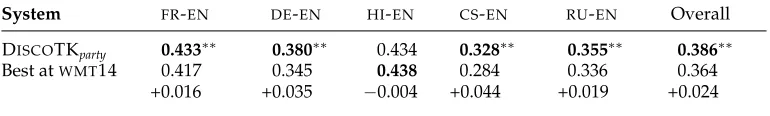
Table 5
Comparing our tuned metric to the best rivaling metric atWMT14, for each individual language
pair (this best rival differs across language pairs) at the segment-level using Kendall’sτ.
Statistically significant improvements are marked with∗∗for p-value<0.01.
System FR-EN DE-EN HI-EN CS-EN RU-EN Overall
DISCOTKparty 0.433∗∗ 0.380∗∗ 0.434 0.328∗∗ 0.355∗∗ 0.386∗∗
Best atWMT14 0.417 0.345 0.438 0.284 0.336 0.364
+0.016 +0.035 −0.004 +0.044 +0.019 +0.024
the best performing metric both at the system level and at the segment level at the WMT08 and WMT09 metrics tasks. From the original ULC, we replaced METEORby the four newer variants METEOR-ex (exact match), METEOR-st (+stemming), METEOR-sy (+synonymy lookup), and METEOR-pa (+paraphrasing) in ASIYA’s terminology
(Denkowski and Lavie 2011). We also added to the mix TERp-A (a variant of TER with paraphrasing), BLEU, NIST, and ROUGE-W, for a total of 18 individual metrics. The metrics in this set use diverse linguistic information, including lexical-, syntactic-, and semantic-oriented individual metrics.
Regarding the discourse metrics, we used five variants, including DR and DR-LEX
described in Section 2, and three more constrained variants oriented to match words between trees only if they occur under the same substructure types (e.g., the same nuclearity type). These variants are designed by introducing structural modifications in the discourse trees. A detailed description can be found in Joty et al. (2014).
We tuned the relative weights of the previous 23 individual metrics (18 ASIYA+ 5 discourse) following the same maximum entropy learning framework described in Section 3.2. As the training set, we used the simple concatenation of WMT11, WMT12, and WMT13.
DISCOTKparty was the best-performing metric at WMT14 both at the segment and at the system level, among a set of 16 and 20 participants, respectively (Mach´aˇcek and Bojar 2014). Table 5 shows a comparison at the segment level of our tuned metric DISCOTKpartyto the best rivaling metric at WMT14, for each individual language pair, using Kendall’sτ. Note that this best rival differs across language pairs, for example, forFR-EN,HI-EN, andCS-ENit isBEER, forDE-ENit isUPC-STOUT, and forRU-ENit is REDCOMBSENT. We can see that our metric outperforms this best rival for four of the language pairs, with statistically significant differences. The only exception isHI-EN, where the best rival performs slightly better, not statistically significantly.
System translations for Hindi–English were of extremely low quality, and were very hard to discourse-parse accurately.11 The linguistically heavy components of our DISCOTKparty (discourse parsing, syntactic parsing, semantic role labeling, etc.) may suffer from the common ungrammaticality of the translation hypotheses for HI-EN, whereas other, less linguistically heavy metrics seem to be more robust in such cases.
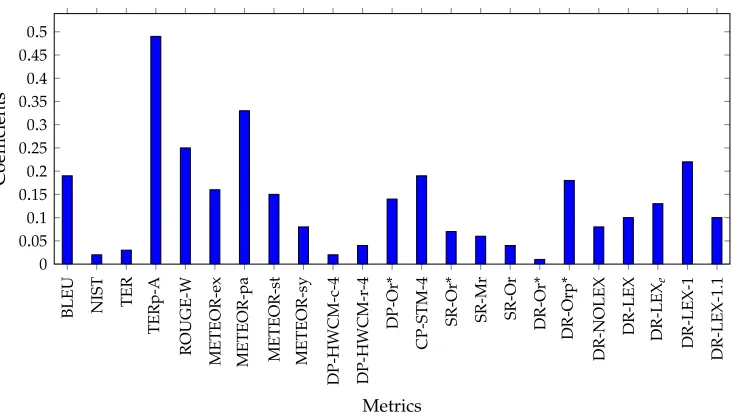
We show in Figure 5 the weights for the individual metrics combined in DISCOTKparty after tuning on the combined WMT11+12+13 data set. The horizontal axis displays all the individual metrics involved in the combination. The first block of metrics (from BLEU to DR-Orp*) consists of the 18 ASIYAmetrics. The last five (from
11 Note that the Hindi–English language pair caused a similar problem for a number of other metrics at the
BLEU NIST TER
TERp-A
ROUGE-W
METEOR-ex METEOR-pa METEOR-st METEOR-sy DP-HWCM-c-4 DP-HWCM-r
-4
DP-Or*
CP-STM-4
SR-Or* SR-Mr SR-Or DR-Or*
DR-Orp*
DR-NOLEX
DR-LEX
DR-LEX-1
DR-LEX-1.1
DR-LEX
e
0 0.05 0.1 0.15 0.2 0.25 0.3 0.35 0.4 0.45 0.5
Metrics
Coef
[image:18.486.57.424.60.269.2]ficients
Figure 5
Absolute coefficient values after tuning the DISCOTKpartymetric on the WMT11+12+13 data set.
DR-NOLEXto DR-LEX1.1) metrics are the metric variants based on discourse trees. Note that all metric scores are passed through amin-maxnormalization step to put them in the same scale before tuning their relative weights.
We can see that most of the metrics involved in the metric combination play a significant role, the most important ones being TERp-A, METEOR-pa (paraphrases), and ROUGE-W. Some metrics accounting for syntactic and semantic information also get assigned relatively high weights (DP-Or*, CP-STM-4, and DR-Orp*). Interestingly, all five variants of our discourse metric received moderately high weights, with the four variants using lexical information (DR-LEX’s) being more important. In particular,
DR-LEX1 has the fourth highest absolute weight in the overall combination. This confirms again the importance of discourse information in machine translation evaluation.
5. Analysis
When dealing with evaluation metrics based on lexical matching, such as BLEU or NIST, it is easier to understand how and why they work, and what their limitations are. However, if a metric deals with complex structures like discourse trees, it is not straightforward to explain its performance.
(iii) Discourse structure (boundaries of the elementary discourse units, depth of the tree, etc.).
The previous two studies focus on quantitative aspects of the discourse trees. Section 5.3 discusses one real example to understand from a more qualitative point of view the contribution of the sentence-level discourse trees in the evaluation of good and bad translations. Finally, in Section 5.4, we discuss the issue of whether discourse trees provide information that is complementary to syntax.
5.1 Ablation Study at the System Level
We analyze the performance of our discourse-based metric DR-LEXat the system level. We use DR-LEXinstead of DR, as it exhibits the most competitive performance, and in-corporates both lexical and discourse information. We selected system-level evaluation because the metric is much more stable and accurate at the system level than at the segment level.
In our ablation experiments we contrast the original DR-LEXmetric, computed over full RST trees, to variations of the same, where the discourse trees have less information. When removing a particular element, we replace the corresponding labels by adummy
tag (∗). We have the following ablation conditions, which are illustrated in Figure 6:
1. Full: Original DR-LEXmetric with the full (labeled) RST tree structure. 2. No discourse relations: We replace all relation labels (Attribution,
Elaboration, etc.) in the tree by adummytag.
3. No nuclearity: We replace all the nuclearity statuses (i.e., Nucleus, Satellite), by adummytag.
4. No relation and no nuclearity tags: We replace both the relation and the nuclearity labels by dummy tags. This leaves the discourse structure (i.e., the skeleton of the tree) along with the lexical items.
5. No discourse structure: We remove all the discourse structure, and we only leave the lexical information. Under this representation, the evaluation metric corresponds to unigram lexical matching.
We scored all modified trees using the same tree kernel that we used in DR-LEX, and we scored their resulting rankings accordingly. The summarized system-level results for WMT11-13 are shown in Table 6, where we used all into-English language pairs.
SPAN
NUC REL E DU EDU
Nucleus Elaboration NUC NGRAM NUC NGRAM
Nucleus to be tte r .. title s Satellite publishe d
(1)full
SPAN
NUC REL EDU EDU
Nucleus NUC NGRAM NUC NGRAM
Nucleus to better .. titles Satellite published *
(2)no rel
SPAN
NUC REL EDU EDU
*
Elaboration NUC NGRAM NUC NGRAM
to be tte r .. title s publishe d
(3)no nuc
SPAN
NUC REL EDU EDU
NUC NGRAM NUC NGRAM
to better .. titles published *
* *
*
(4)no nuc & no rel NGRAM
to better .. titles published
[image:20.486.47.416.57.439.2](5)no discourse
Figure 6
Different discourse trees for the same example translation: “to better link the creation of content for all the titles published,” with decreasing amount of discourse information. The five
[image:20.486.59.432.575.662.2]representations correspond to the ones used in the ablation study.
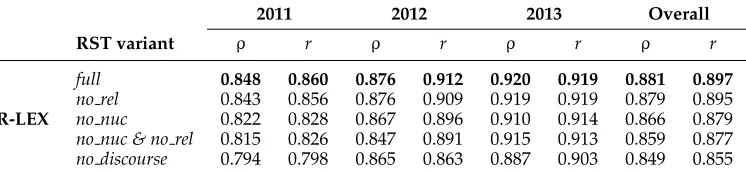
Table 6
System-level Spearman (ρ) and Pearson (r) correlation results for the ablation study over the
DR-LEXmetric across the WMT{11,12,13}data sets and overall.
2011 2012 2013 Overall
RST variant ρ r ρ r ρ r ρ r
DR-LEX
full 0.848 0.860 0.876 0.912 0.920 0.919 0.881 0.897
no rel 0.843 0.856 0.876 0.909 0.919 0.919 0.879 0.895
no nuc 0.822 0.828 0.867 0.896 0.910 0.914 0.866 0.879
no nuc & no rel 0.815 0.826 0.847 0.891 0.915 0.913 0.859 0.877
Table 7
System-level Spearman (ρ) and Pearson (r) correlation results for the ablation study over the
DR-LEXmetric across language pairs for the WMT{11,12,13}data sets.
CS-EN DE-EN ES-EN FR-EN
RST variant ρ∗ r ρ r ρ r ρ r
DR-LEX
full 0.890 0.893 0.782 0.840 0.970 0.952 0.943 0.940
no rel 0.894 0.892 0.775 0.833 0.968 0.952 0.942 0.939
no nuc 0.899 0.885 0.739 0.802 0.958 0.949 0.935 0.925
no nuc & no rel 0.895 0.884 0.720 0.798 0.935 0.950 0.940 0.917
no discourse 0.833 0.861 0.738 0.743 0.942 0.930 0.936 0.919
Interestingly, the nuclearity status (no rel) is more important than the type of re-lation (no nuc). Eliminating the latter yields a tiny decrease in performance, whereas ignoring the former causes a much larger drop. Although this might seem counterintu-itive at first (because we think that knowing the type of discourse relation is important), this can be attributed to the difficulty of discourse parsing machine translated text. As we will observe in the next section, assigning the correct relation can be a much harder problem than predicting the nuclearity statuses. Thus, parsing errors might be undermining the effectiveness of the discourse relation information.
Table 7 presents the results of the same ablation study but this time broken down per language pair. For each language pair, all years are considered (2011–2013). Overall, we observe the same pattern as in Table 6, namely, that all layers of discourse information are helpful to improve the results, and that the nuclearity information is more important than the discourse relation types.12
However, some differences are observed depending on the language pair. For ex-ample, Spanish–English exhibits larger improvements (ρgoes from 0.942 to 0.970) than French-English (ρgoes from 0.936 to 0.943). This is despite both language pairs being mature in terms of the expected quality for these systems. On another axis, the German– English language pair shows much lower overall correlation compared to Spanish– English (0.782 vs. 0.970). This can be the effect of the inherent difficulty of this language pair because of long-distance reordering and so forth. However, note that adding all the discourse layers increasesρfrom 0.738 to 0.782. These observations are consistent with our findings in the next section, where we explore the different parts of the discourse trees at a more fine-grained level.
5.2 Discriminating Between Good and Bad Translations
In the previous section, we analyzed how different parts of the discourse tree contribute to the performance of the DR-LEXmetric. In this section, we take a different approach: We investigate whether the information contained in the discourse trees helps to differ-entiate good from bad translations.
In order to do so, we analyze the discourse trees generated for three groups of translations: (i) gold, the reference translations; (ii) good, the translations of the top-two best (per language pair) systems; and (iii)bad, the translations of the worst-two
(per language pair) systems. Our hypothesis is that there are characteristics in thegood -translation discourse trees that make them more similar to thegold-translation trees than thebad-translation trees. The characteristics we analyze here are the following: relation labels, nuclearity labels, tree depth, and number of words. We perform the analysis at the sentence level, by comparing the trees of thegold,good, andbadtranslations.
5.2.1 Discourse Relations. There are 18 discourse relation labels in our RST parser. We separately computed the label frequency distributions from the RST trees of all gold,
good, andbadtranslation hypotheses. Figure 7 shows the histogram for the ten most frequent classes on the Spanish–English portion of the WMT12 data set. We can see that there are clear differences between thegoodand thebaddistributions, especially in the frequencies of the most common tags (ElaborationandSame-Unit). Thegoodhypotheses have a distribution that is much closer to the human references (gold). For example, the frequency difference for theElaborationtag betweengoodandgoldtranslation trees is 58, which is smaller than the difference betweenbadandgold, 323. In other words, the trees forbadtranslations exhibit a surplus ofElaborationtags.
If we compare the entire frequency distribution across different relations for the whole WMT12, we observe that the Kullback–Leibler (KL) divergence (Kullback and Leibler 1951) between the goodand the golddistributions is also smaller than the KL divergence between thebadandgold: 0.0021 vs 0.0039, and a similar tendency holds for WMT13. This means thatgoodtranslations have discourse trees that encode relation tags that match thegoldtranslation trees. This suggests that the relation tags should be an important part of the discourse metric.
0 500 1000 1500 2000 2500
Condition Temporal Cause Enablement Contrast Background Joint Attribution Same.Unit Elaboration Relation
Fr
equency
[image:22.486.57.411.376.623.2]BAD GOOD GOLD
Figure 7
Distribution of discourse relations forgold,good, andbadautomatic translations on WMT12
WMT_2011 WMT_2012 WMT_2013
0.2 0.3 0.4 0.5 0.6 0.7
ElaborationAttribution Joint
Same.UnitBackgroundElaborationAttribution Joint
Same.UnitBackgroundElaborationAttribution Joint
Same.UnitBackground Relation
F
1
measu
re
[image:23.486.61.404.69.223.2]good bad
Figure 8
F1score for each of the top-five relations ingood- vs.bad-translation trees across the
WMT{11,12,13}data sets.
In a second step, we computed the micro-averaged F1score for each relation label, taking thegoldtranslation discourse trees as a reference. Note that computing standard parsing quality metrics that span over constituents (e.g., F1score over the constituents), would require the leaves of the two trees to be the same. In our case, we work with two different translations (onegoldand one MT-generated), which makes their RST trees not directly comparable. Therefore, we apply an approximation, and we measure F1score over the total number of instances of a specific tag, regardless of their position in the tree. Furthermore, we also consider that every instance of a predicted tag is correct if there is a corresponding tag of the same type in thegoldtree. Effectively, this makes the number oftrue positivesfor a specific tag equal to the minimum number of instances for that tag in either the hypothesis or thegoldtrees. Although this is a simplification, this gives us an idea of how closely the RST trees forgood/badtranslation approximate the trees from the references.
The results for the five most prevalent relations are shown in Figure 8. We can see systematically higher F1scores forgood-translation trees compared withbadones across all relations and all corpora. This supports our hypothesis at the discourse relation level—that is, discourse trees forgoodtranslations contain more similar discourse labels to the reference translation trees. Note, however, that F1 scores vary across relations and they are not very high (highest is around 70%), indicating that they are hard to predict.
Figure 9 contains the same information, but this time broken down by language pair. For each language pair and corpus year, we micro-average the results for the five most frequent discourse relations. Again, we observe a clear advantage for the
good-translation trees over thebadones for all language pairs and for all years. Some differences are observed across language pairs, which do not always have an intuitive explanation in terms of the difficulty of the language pair.13 For instance, larger gaps are observed forES-ENandDE-EN, compared to the rest. This correlates very well with
WMT_2011 WMT_2012 WMT_2013
0.40 0.45 0.50 0.55 0.60
es−en fr−en cs−en de−en ru−en es−en fr−en cs−en de−en ru−en es−en fr−en cs−en de−en ru−en Language pair
F
1
measu
re
[image:24.486.55.407.70.223.2]good bad
Figure 9
F1score for each language pair ingood- vs.bad-translation trees across the WMT{11,12,13}data
sets: micro-averaging the scores of the top-five relations.
the results in Table 7, clearly connecting the discourse similarity and the quality of the evaluation metrics.
5.2.2 Nuclearity and Other Tree Information.Nuclearitydescribes the role of the discourse unit within the relation, which can be central (Nucleus) or supportive (Satellite). Here, we study the distribution of these labels together with two extra elements from the trees: the EDUs and the depth of the discourse tree (Depth). The results are shown in Figure 10. For the number of Nucleus, Satellite, and EDU labels, we compute the simplified F1 scores in the same way that we did for relation labels, focusing on the number of instances. For the tree Depth, we compute the micro-averaged root-mean-squared-error, or RMSE.
As with the discourse relations, we observe better results for the nuclearity labels and the other tree elements from thegood-translation trees, compared with thebadones. This is consistent across all years (higher F1or lower RMSE). Note that the F1values for nuclearity labels are significantly higher than the F1scores for discourse relations (now moving in the 0.78–0.82 interval, compared with F1average scores below 0.60 in the case of discourse relations). This helps to explain the larger impact of the nuclearity elements in the evaluation measure (see Tables 6 and 7). Since predicting discourse segments is easier than predicting nuclearity labels (F1 values close to 0.89), the EDU structure contributes to improving the evaluation measure; this corresponds mainly to theno nuc & no relcase in the ablation study (again, see Tables 6 and 7).
Finally, Figure 11 shows the results by language pair. We show the micro-averaged F1 scores of the nuclearity labels and EDUs (upper charts), and the RMSE for Depth (lower charts). Once again, the F1and RMSE results forgoodtranslations are better than those for bad ones, sometimes by large margins. The only exception is for Depth in
FR-EN (WMT13). Looking at the overall scores and at the size of the gaps between the scores forgoodandbad, we can see that they are consistent with the per-language results of Table 7, showing once again the direct relation between matching discourse elements and the correlation with the human assessments of the discourse-based DR-LEXmetric.
WMT_2011 WMT_2012 WMT_2013
0.70 0.75 0.80 0.85
EDU
Nucleus Satellite EDU Nucleus Satellite EDU Nucleus Satellite
Nuclearity relations and EDUs
F
1
measu
re
good bad
0.85 0.90 0.95 1.00 1.05 1.10
WMT_2011 WMT_2012 WMT_2013
Tree depth
[image:25.486.60.424.70.391.2]RMSE goodbad
Figure 10
F1scores for the nuclearity relations and EDUs (upper chart), and RMSE for Depth (lower chart)
ingood- vs.bad-translation trees, across the WMT{11,12,13}data sets.
the translation, according to the human assessments; (ii) Different levels of discourse structure and relations provide different information, which shows smooth accumula-tive contribution to the final correlation score; (iii) Both discourse relations and nuclear-ity labels have sizeable impact on the evaluation metric, the latter being more important than the former. The last point emphasizes the appropriateness of the RST theory as a formalism for the discourse structure of texts. Contrary to other discourse theories (e.g., the Discourse Lexicalized Tree Adjoining Grammar [Webber 2004] used to build the Penn Discourse Treebank [Prasad et al. 2008]), RST accounts for the nuclearity as an important element of the discourse structure.
5.3 Qualitative Analysis of Good and Bad Translations
In the previous two sections we provided a quantitative analysis of which discourse information has the biggest impact on the performance of our discourse-based measure (DR-LEX) and also which parts of the discourse trees help in distinguishinggoodfrom
WMT_2011 WMT_2012 WMT_2013
0.750 0.775 0.800 0.825
cs−en de−en es−en fr−en ru−en cs−en de−en es−en fr−en ru−en cs−en de−en es−en fr−en ru−en
Nuclearity
F
1
measu
re
good bad
WMT_2011 WMT_2012 WMT_2013
0.9 1.0 1.1 1.2
cs−en de−en es−en fr−en ru−en cs−en de−en es−en fr−en ru−en cs−en de−en es−en fr−en ru−en Tree depth
[image:26.486.56.382.69.369.2]RMSE goodbad
Figure 11
Micro-averaged F1scores for each language pair for nuclearity and EDU, and RMSE for Depth in
good- vs.bad-translation trees across the WMT{11,12,13}data sets.
real example ofgoodvs.badtranslations, and showing how the discourse trees help in assigning similarity scores to distinguish them.
Figure 12 shows a real example with discourse trees for a reference (a) and two alternative translations, one (b) being better than the second (c). The examples are extracted from the WMT11 data set (CS-EN), and the discourse trees are obtained with our automatic discourse parser. Discourse trees are presented with the unfolded format introduced in Figure 3(b).
Translation 12(b) gets a DR-LEX score of 0.88, which is higher than the score for
translation 12(c), 0.75. Part of the difference is explained by the fact that translation 12(b) provides better word-based translation, including complete EDU constituents (e.g.,is “the greatest golf hole in Prague”). But also, 12(b) obtains many more subtree matches with the reference at the level of the discourse structure. This translation has the same discourse structure and labels as the reference, with the only exception of the top-most discourse relation (Jointvs.Attribution). This tendency is observed across the data sets, and it is quantitatively verified in previous Section 5.2 (i.e., good translations tend to share the tree structure and labels with the reference translations).
SP AN NUC REL EDU SP AN ROOT Joint NUC NGRAM NUC REL SP AN EDU Nucleus ʺ Voldemort ʺ
bears no meaning to K
aucky Nucleus Same-Unit NUC REL EDU EDU NUC NGRAM Nucleus Elaboration NUC NGRAM NUC NGRAM Nucleus is ʺ
the greatest golf hole in Prague .
ʺ
Nucleus
and the only term
Satellite
he correctly guessed in the test
(a) Refer ence translation SPAN NUC REL EDU SPAN ROOT Attributi on NUC NGRAM NUC REL SPAN EDU Satell ite
" Voldemort " Kauckemu he sa
ys Nucleus Same-Unit NUC REL EDU EDU NUC NGRAM Nucleus Elaboration NUC NGRAM NUC NGRAM Nucleus
is " the grea
test golf hol
e i
n Prague . "
Nucleus
nothing , and the onl
y term
Satell
ite
that the t
est cor
rectly guessed ,
(b) A better translation with DR-L E X scor e 0 . 88 SPAN NUC REL SPAN SPAN ROOT Joint NUC REL EDU EDU NUC REL EDU EDU Nucleus Attributi on NUC NGRAM NUC NGRAM Nucleus Cause NUC NGRAM NUC NGRAM Satell ite 'voldemort' kauc kemu Nucleus
he says not
hi
ng ,
Nucleus
and the only deadl
ine
Satell
ite
that the t
est cor
rectly projected is ' the greates
t golf j
amka in Prague '
[image:27.486.71.429.56.660.2]