Munich Personal RePEc Archive
Microfinance institutional growth: How
driven forces impact their financial
integration?
Sandra, Kendo and Chicot, Eboue
Economics Department, Lorraine University, CEREFIGE Research
Center
1 March 2016
Online at
https://mpra.ub.uni-muenchen.de/70225/
1
Microfinance institutional growth: How driven forces impact their
financial integration?
Sandra KENDO1and Chicot EBOUE
Department of Economics and Management Lorraine University – CEREFIGE Research Center
Abstract.
This article analyses the growth of microfinance by examining how some driven forces heighten more or less their financial integration. Three main driven forces identify: agency costs, financial development and trade-off in microfinance. The author samples 542 microfinance institutions. Quantile regression applies to analyze difference effects. The results first reveal that high financial development can easily improve financial integration of microfinance, by expanding rate of external investors. Nevertheless, as viewed, high financial integration can also reach where financial development is low. Then, there is inverse link between agency costs and financial integration of MFIs. At last outreach performs better than financial performance in improving their financial integration. There is no mission drift across quantiles and status. Microfinance institutions that plan to increase their average loans with an increase of their number of active borrowers perform better in a financial integration.
Keywords. Financial integration, microfinance, financial development, agency costs, financial performance and outreach.
Jel. G21; G32; O57
1 Corresponding author: [email protected]
2 1. Introduction
The microfinance has developed during this last three decades. Its success is partly
because of two mains observations. One is the ability of microfinance institutions to reach the
poor's (Littlefield, Morduch, et Hashemi 2003; Hartarska et Nadolnyak 2008; Rai et Ravi 2011).
This improves financial inclusion rate in less developed countries. Some pessimistic views
argue there is neither real effect, nor the effect of microfinance on poverty is not clear (Kah,
Olds, et Kah 2005; Morris et Barnes 2005; Bateman 2010; Duflo 2010). Nevertheless, despite
this debate, the importance of microfinance actions in less developed countries is real.
The second is a raise of external funds in microfinance industry. It explains rapid growth
of some microfinance institutions (Ghosh et al. 2003). The cost of external funds because of
their origins (domestic and international) settles the efficiency of microfinance institutions.
Cheap external funds impel low loan costs that expand microfinance. Efficient microfinance
institutions can attract more poor clients. Reverse effects occur with entry of inefficient
microfinance institutions that benefit from low costs of external funds. In this case, an increase
of external funds cost could lessen the inefficient MFIs, but there could be a raise of loans
interest rate linked to an increase of external funds cost.
So, an increase of microfinance is real through financial integration set up with external
investors. External investors in microfinance industry are commercials banks, foreign banks,
venture capitalists and private investors. External investors taking part in capital improve the
microfinance institutions financing sources. The neoclassical theory argues that growth of
microfinance explained by a financial integration occurred between microfinance institutions
and external investors (Giannetti and Ongena, 2009 P. 182). Contributing this paper is to
identify and analyze the impact of driven forces that can heighten more or less microfinance
3 As the financial theory stated, setting up financial integration by two main control
reasons namely an increase of the degree of financial development and decrease of agency
costs. Let argue that a high financial development encourages financial integration. If the
financial development degree is low, only larger firms will be more financially integrated,
because they will be able to bear high markets and contractual costs (Khanna and Palepu, 2000).
Microfinance institutions with specific behavior could impel some mission drifts. They could
increase moral hazard incentives that highlights trade-off between financial performance and
outreach. Purpose of considering trade-off in microfinance, explains its impact on financial
integration. So, in this study we consider three main driven forces that can impact microfinance
financial integration. They are: financial development, agency costs and trade-off between
financial performance and outreach. The study evaluates driven forces impact on financial
integration of microfinance.
It samples 542 microfinance institutions between 1997 to 2013. Quantile regression
applies to analyze difference effects. The results first reveal that high financial development
can easily improve financial integration of microfinance, by expanding rate of external
investors. Nevertheless, as viewed, high financial integration can also reach where financial
development is low. One reason gave is that only larger microfinance institutions with highest
market share can be easily financially integrated. There is inverse link between agency costs
and financial integration of microfinance institutions. At last, outreach performs better than
financial performance in improving their financial integration. There is no mission drift across
quantiles and status. Microfinance institutions that plan to increase their average loans with an
increase of their number of active borrowers perform better in a financial integration.
Rest of article is as follows. The second section examines the literature linking the
financial integration with financial development, agency cost and trade-off between outreach
4 The fourth section discusses the empirical results, and presents some robustness checks of the
results. The fifth section ends with important implications.
2. Literature review
2.1 Financial integration and financial development
Financial development has an important role in improving financial services in an
economy.Financial development includes its ability to mobilize private savings, effective
resource allocation, increasing liquidity risk diversification, reducing information asymmetries
and transaction costs, and improving alternative funds through individuals’ household savings
and undistributed corporate profits (Ang and Mackibbing, 2005).
Low financial development could weaken financial links between microfinance
institutions and external investors. Most developing countries have low financial development.
There are also large market gaps existing between microfinance institutions and commercial
banks (Vanroose et D’Espallier 2013). A solution is to improve financial sources of
microfinance by encouraging new financial opportunities. So, financial integration improves
by financial development rise financial inclusion rate through an increase of clients and
products portfolio. The gains of financial integration in microfinance are transfer of banking
practices, technology, skills and funds. An increase of external funds flows lessens the cost of
capital and increases microfinance savings (Prasad et al. 2007). External investors having good
arbitrage strategy between risk and returns, will easily manage microfinance risks. Similarly,
microfinance easily share their experience to external investors by teaching them how to finance
5 External investors taking part in microfinance capital could gain extra returns coming
from social advantages and improvement of regulation. Some external investors could more
focus on increasing of funds granted to poor, small and medium firms. Based on this, let assume
that financial development is positively linked to financial integration of microfinance. External
investors will be more confident about microfinance institutions capability and skills. They will
have high incentives to diversify their portfolio with some new financial and social investment.
The first assumption is -H.1 a positive effect of financial development on financial integration
of microfinance-.
2.2 Financial integration and agency cost
Financial institution deciding to open their capital to external investors faces agency
costs. Agency costs highlight some conflicts between the manager and shareholders. Agency
costs in microfinance growth is the conflict between managers’ objectives and pressure of
external investors. External investors can put pressure to guide loans granted with as result an
increase of default risk of borrowers. As the agency cost theory mentioned, the internal
organization depends on institutional characteristics value by the capital (Williamson 2000).
The value of capital measured by equity/assets (Berger et Di Patti 2006). Low
equity/assets or high leverage ratio lessens agency costs and increases firm value. This is real
if external investors can easily encourage or constrain manager’s decisions to act more in their
interests (Berger et Di Patti 2006). So, the existing link between financial integration and
equity/assets is negative. As microfinance institutions financially integrate, they easily lessen
the agency cost by well diversifying their capital. Microfinance institutions with high returns
6 Low agency cost means high leverage ratio for financial institutions. Sometimes, high
leverage ratio can mitigate conflicts between shareholders and managers about specifics points.
Those points are investment strategies (Myers 1977), risk (Jensen et Meckling 1976; Williams
1987), liquidation conditions and dividend policy (Stulz 1990). Later, Kar in 2012 analyzes the
impact of capital and financing structure on microfinance performance. He empirically
confirms agency cost theory by specifying an increase in leverage that raises profit efficiency
(Kar 2012). He argues that capital/assets negatively linked financial performance. There is a
nonlinear relationship between capital/assets and financial performance of microfinance. An
increase in debt/equity associates with a decrease in profitability (Kar, 2012 P.340).
Indeed, one important point that appears clearly in those studies is that a well-diversified
capital of financial institutions characterizes by low agency cost. So we assume at this stage
that -H2. there is a negative relationship between agency costs and financial integration
degree-.
2.3 Financial integration and trade-off between financial performance and
outreach
Financial integration is part of financial development mainly characterized by an
increase of financial inclusion rate in less developed countries. To insure sustainable financial
integration of microfinance, it is important to consider their financing ability and social
strategies. Besides, an improvement of micro financial intermediation is real with good
regulation and supervision. These good regulation and supervision can also impact the financial
integration.
Good or weak macroeconomic environment impacts microfinance growth (Gonzalez
2007; Krauss et Walter 2009; Ahlin, Lin, et Maio 2011). This will in their turn impact financial
7 clients and raise the rate of financial inclusion (Vanroose and D’espallier 2013, P. 1966). In a
well-developed financial sector, microfinance institutions will compete with banks that could
easily adapt their loans contracts. This competition pressure can lead to mission drift in the
microfinance clients’ portfolio. Mission drift occurs when the size of average loans increases
(Mersland and Strom, 2010 P. 29). Microfinance will increasingly choose to target better-off
clients as a reply to aggressive actions of banks in the market. Existence of mission drift is also
determined by microfinance experience (Mersland and Strom, 2010 P. 30), maturity of clients
Cull et al. 2009, P. F126) and microfinance efficiency (Hermes, Lensink, et Meesters 2009).
By considering these facts, a high mission drift is positively linked to a high-level of
financial development. One aim in this case for microfinance is to diversified their clients’
portfolio by targeting better-off clients. A high mission drift also highlights an event of
trade-off between financial performance and outreach. So, MFIs increase their financial performance
by diversifying their clients’ portfolio by targeting of better-off clients. So, let assume -H3. an
indirect and positive link between mission drift and financial integration.
3. Method
3.1Data
To carry out our tests, the study uses a panel dataset on 542 microfinance institutions
from Mix-market database merge with country-level economic data of World Bank data from
1997 to 2013. Each microfinance institution has a minimum of 10 years to a maximum of 17
years’ observations. The criteria defining our panel dataset needs that all microfinance have at
least a minimum of 10 observations on the length period of 17 years considered. The dataset
includes microfinance institutions of five sub-regions: Sub-Saharan Africa (98 MFIs), East Asia
8 Caribbean (181 MFIs), South Asia (79 MFIs) and Middle East and North Africa (31 MFIs).
The panel dataset analysis organizes on individual microfinance profile.
A classification of microfinance institutions does by the degree of financial integration
(each quantile). To make our results robust, we divide our sample in five subsamples based on
the status of microfinance. Microfinance status are banks, credit and saving cooperatives,
nonbank financial institutions (NBFIs), nongovernmental organizations (NGOs) and rural
banks. This sample as the one of Vanroose and D’Espallier (2013, P. 1969) cannot claim as a
representative data of the whole microfinance sector. Our aim by building this database is to
more diversify endogenous characteristics of microfinance.
3.2Variables
(a) Dependent variable: Financial integration
The degree of financial openness measures financial integration. Prasad et al. 2007
identify two index. The first one is official controls on capital flows consider as a binary
indicator that directly measures the capital controls but does not capture differences in the
intensity of these controls. Capital account controls highlight some constrained measures took
to control capital flow. The second one is to estimated gross stocks of foreign assets and
liabilities as a share of gross domestic product (GDP). The both measures value the financial
openness of an economy.
Giannetti and Ongena (2009) evaluate the impact of financial integration on firm
performance by considering the rate foreign lending in the gross loan portfolio. As a financial
integration measure they used the percentage of foreign lending which is a ratio of foreign banks
9 domestic loans in the grow loans portfolio. But according to the literature review above, a proxy
of financial integration is the level external funds compare with total financing sources.
For example, an analysis of Kenyan microfinance sector shows the importance of debt
funds rate to the deposits and compulsory savings2. As already mentioned, financial integration
in microfinance considers participation of external investors in the capital. For that, let
identified five subgroups of capital sources: Domestic debt, international debt, compulsory
savings, deposits collected and equity.
Annual reports of Kenyan microfinance in 2012, 2013 and 2014 consider three types of
microfinance institutions. There are, microfinance that gives only credit financed by
borrowings, microfinance banks and banks mainly financed by borrowings, deposits and equity.
If we exclude banks, only two important sources remain which are deposits and borrowings.
Between 2012 and 2014, liabilities increase for whole Kenyan microfinance actors. For debt
funds, an increase is just for microfinance given only credit and banks. The debt funds of
microfinance increases between 2011 and 2012 and decrease in 2013.
Different observations appear for financial integration analysis according to
microfinance status. Microfinance that gives only credit with high rate of international debt
register a slowdown of their financial performance. The slowdown expresses a decline of
returns and operational self-sufficiency. Managing international debt without deposits and with
equity and compulsory savings is not enough. Besides, some microfinance institutions that
gives only credit have domestic debt, compulsory savings and equity greater than external
debts. They register better results with a raise of their financial performance. As example, those
microfinances are Jitegemea Credit Scheme, SISDO and JEHU microfinance. For microfinance
2The study case of financial integration analysis is the Kenya microfinance sector did through the reports of 22
10 banks, their capital is more diverse with domestic debt and international debt that are less
important than compulsory savings and deposits. A good financial integration is real for
microfinance if total savings is greater than debt funding. The success of their financial
integration insures an equilibrium between external funds, domestic savings and equity.
Therefore, their financial performance indicators are positive. This specific result contributes
to consider the percentage of borrowing as a proxy measure of financial integration calculate
as the ratio of total borrowing over total funds (total deposits plus total borrowings). The
microfinance financial integration index is defined as follows:
Let consider the graph 1 below that shows the different stage of financial integration of
a microfinance institution.
[Insert graph 1]
Graph 1 shows the financial integration level measures as the percentage of borrowings to total
funds. The graph shows three part for the financial integration curve. The first one where
financial integration curve is nearest 0. The second part where the financial integration curve is
between 0 and 1. The last part where the financial integration curve is nearest 1. This can be
resume by the line below.
The value of financial integration indicator of microfinance is between 0 and 1.
If FI = 0, there is no financial integration, this means the main and only financing sources for
microfinance is total deposits collected.
1
0.5
0
Full financial integration High financial
integration None
financial integration
11 If FI = 1, there is full integration, and external funds as borrowings mainly finance
microfinance loans granted.
(b)Variables of interest
i. Financial development
The data source of financial development indicators is World Bank Indicators (WBI)
database. Three probable measures analyze the financial development process. They are the
domestic credit provided by the financial sector (DC_FS), Automated teller machines (ATM)
and interest rate spread (spread). The one consider in our study is domestic credit provided by
financial sector.
ii. Leverage effects
One measure of agency cost is equity/assets. Equity/assets is a measure of leverage for
firms. There is an inverse relation between equity/assets and leverage. If leverage effects are
high, then equity/assets will be low. This induces low agency cost linked to high leverage ratio.
iii. Financial performance
Financial performance and outreach are indicators that analyze microfinance
performance. To measure financial performance, Mixmarket proposes four indicators. They are
return on assets (ROA), return on equity (ROE), financial self-sufficiency (FSS) and operational
self-sufficiency (OSS). FSS and OSS measure ability of microfinance to cover their cost (Kar,
2012 P.331). ROE and ROA measure ability of microfinance to make returns (Hartarska 2005).
This study considers two indicators of financial performance ROA and OSS. Return on assets
(ROA) equals to net operating income, less taxes on assets. Most microfinance clearly values
their return on assets more than return on equity. Equity is ambiguous with mix value of real
12 The second group of dependent variables is outreach where we distinguish breadth of
outreach to depth of outreach (Cull et al. 2011; Kar 2012). Breadth of outreach measure the
number of active clients (Cull, Morduch, et others 2007); Kar 2012 P.332). Depth of outreach
evaluates the quality of outreach to poor. Its associated indicators are average loans, average
loan amount adjusted by GNI per capita and percent of female loan clients.
(c) Control variables
i. Microfinance institutions’ control variables
The microfinance control variables are size, financial intermediation degree and status.
The assets per GNI measures the microfinance institutions size. Graph 2 below shows the
relationship between assets growth and borrowings. There is a positive correlation between
assets growth and percentage of borrowings. Large microfinance institutions more use external
funds than small ones.
[Insert graph 2]
As graph 2 suggests, the more borrowings increase, the more assets raise. Just a few
part of large microfinance borrows high amounts, a huge number of small size used less external
funds.
The financial intermediation measures microfinance ability to collect deposits that
finance loans granted. So, if a microfinance collects high deposits, then its level of financial
intermediation is high. Thus, financial intermediation here is a dummy variable; with 1 if a
microfinance has a high financial intermediation and 0 otherwise. The legal type of
microfinance considered are four (BANK, COOP, NBFI and NGO).
13 For the macroeconomic environment, we consider six factors which are: GDP per capita
growth, remittances received (REMI) and aid received (AID). Their values are extracting from
WDI data base. Economic growth measures by GDP per capita growth (GDPPC) indicates
dynamic changes in real GDP divided by the population. As financial development-economic
growth link theory reveals, a high financial development is positively link to a high economic
growth level (King and Levine, 1993).
Its related observation is extracting from World Bank indicators (WDI) data base.
Remittances could raise financial inclusion and financial performance of microfinance in
developing countries. So, an expecting sign is a positive link between remittances and
microfinance performance. But a negative link between remittances and financial integration.
Net official aid (AID) refers to aid flows (net of repayments) from official donors to countries
and territories.
3.3Models and estimation methods
The regression model in outspoken form is:
( ) ( ) ( ) ℎ( ) !(" ) # (1)
i is for microfinance and t for time. FI is for financial integration. FD is for financial
development. is a vector of microfinance performance (social and financial). is for
leverage and is negatively linked to cost agency. is a set of institution-specific
variable " includes a set of macro-economic control variables for the country. The
empirical model valued for financial integration as dependent variables $ is as follows:
14 & is a 1XK vectors of observable variables for microfinance “I” at time “t”. is
unobservable effect considered sometimes as unobserved component, latent variable, or
unobserved heterogeneity (Wooldridge, 2010, P.251). If i referred to individual, then is
individual’s effects or individual heterogeneity. # represents idiosyncratic errors or
idiosyncratic disturbances related to variations across t and i. Many financial behavior studies
rely on performance indicators with unobserved effects interacting with explanatory variables
(Wooldridge, 2010 P. 299).
What’s more, microfinance empirical studies apply methods as ordinary least squares
(OLS), general least square (GLS) or general method of moments (GMM). Those methods
highlight mean effects and don’t consider distributional effects. However, financial integration
distributional graph (graph 3) below shows important changes along the pathway. Despite
general increase of financial integration (see graph 3), there are differences across quantiles.
[Insert graph 3]
Thus, we use quantile regression that considers those limits that can influence our panel
data specification. This allows us to highlight the effects of independent variables X along the
entire distribution. A basic approach developed by Koenker and Bassett (1978) relies on
quantile parameter heterogeneity. One of their main hypothesis is that control variable effects
is exogenous. But as we can note in our study financial intermediation is endogenous to
financial integration. Koenker and Bassett (1978) quantile regression shows some limits.
Standard errors estimated are not consistent in the presence of heteroscedasticity. Therefore,
quantile regression estimators in this case are biased. One solution is to estimate a conditional
quantile regression. By this method, main control variable is modeled as endogenous variable.
For that Abadie, Angrist and Imbens (2002) developed an approach based on instrumental
15 So, the analysis of the driven forces impacts on financial integration will consider a
conditional quantile for our panel data. Their results will be compare to those of general least
square (GLS). The first step of our analysis will be a Hausman test where different coefficient
parameters will be estimated. It will find out probable fixed effects across quantiles or not.
4. Results
4.1Descriptive facts
[Insert table 1]
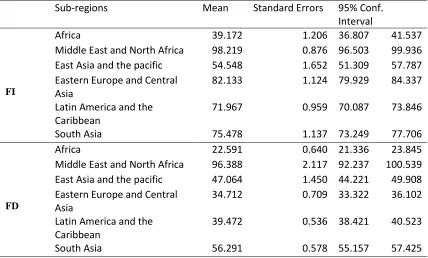
The cross-regions evidence summaries in table 1 as a comparable analysis of financial
integration and financial development focuses on analysis of the role of private savings in the
financial development. Subregions where financial development is low as Africa and East Asia
and the pacific register also a low financial integration. Nevertheless, there are also subregions
with low financial development linked to high financial integration. These are the cases of Latin
America and the Caribbean and Eastern Europe and Central Asia. Those evidence for
developing countries reveals two ending remarks about the financial development theory. On
the one hand as the theory says, less increase of financial products and services can appear as a
great constrain for a good financial integration. On the other hand, when the financial
development is low, only larger firms in that economic context are more financially integrated
as Khanna and Palepu (2000) argued.
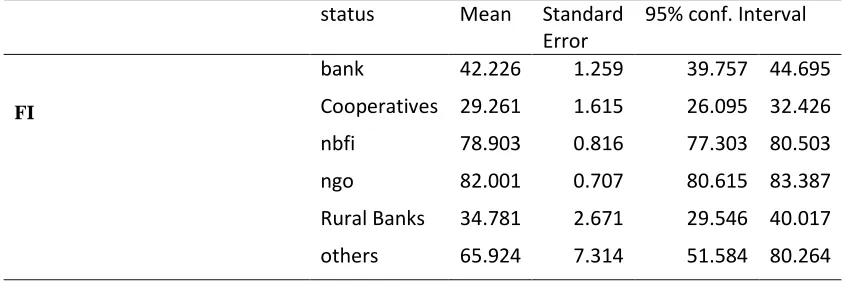
[Insert table 2]
According to more cross evidence present in table 2, there is another cause that settle a
high financial integration happening which is the status of financial actors. NGOs and
16 the Caribbean and Eastern Europe and Central Asia where there is less financial development,
high financial integration is mainly leaded by NGO and NBFI.
[Insert graph 4]
Quantile graph analysis did with graph 4 reveals links between financial integration and
driven forces. Such driven forces are financial development (dc_fs), agency cost (equity/assets),
microfinance performance (ROA, OSS, average loan per gross national income (avloan_gni)
and active borrowers (lnacbor)). Mean curve of financial development shows a positive link
with financial integration. But in some areas of the curve there is a decrease of financial
development degree when financial integration converges to full integration. Agency cost curve
shows some area of increase and other of decrease. In fact, an increase of financial integration
is due to an alternative increase and decrease of agency costs. Financial performance (ROA)
positively increase across quantiles of financial integration and is above the mean value.
An analysis of quantile graph shows two types of behavior for the curves of financial
development and financial performance. There is an alternative increase and decrease of
financial integration linked to an increase of financial development. According to the curves of
outreach (breadth and depth), the first part is decreasing with a reshape point where there is an
increasing process. If outreach approach is considering, through the different quantile of
financial integration, there is a decline of the number of active borrowers instead the fact of a
decreasing value of average deposits.
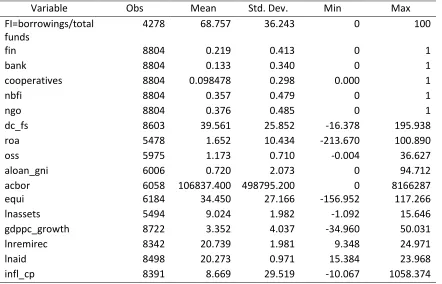
[Insert table 3]
Table 3 presents the descriptive statistics on both depend and independents variables.
The mean value of financial integration is 68.757 with a high standard deviation equals to
36.243. This high value of standard deviation of financial integration suggests a possible
17 4.2Results and discussion
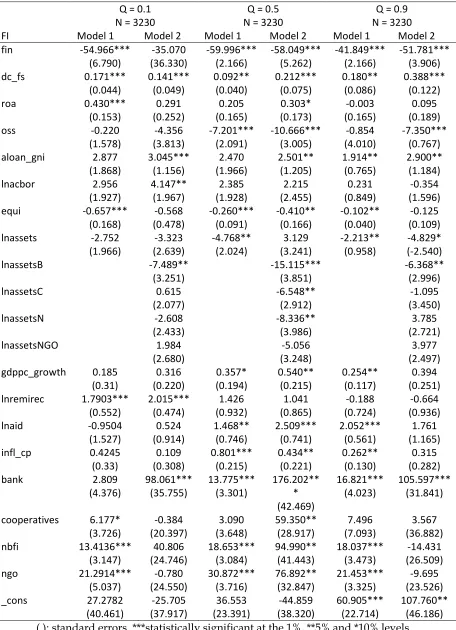
Table 4 shows main results for financial integration testing predictions for the three
driven forces considered. The first assumption is a positive relationship between financial
development and financial integration. The second one is a positive relationship between
leverage and financial integration. The third one is positive link between mission drift, and
financial integration. Table 4 shows 3 main columns divided according to each quantile (Q=
0.1; Q=0.5 and Q=0.9).
[Insert table 4]
Let first examines the impact of financial development across the different quantiles.
Financial development positively and significantly impacts financial integration of MFIs. An
eased access of credit and deposits services encourages by regulation improvement insure good
development of financial institutions. Each financial institution easily interacts with others, and
a direct result is more commercial banks loans for microfinance. The level of liabilities
increases with the level of borrowings.
If we consider the effect across the different quantiles, the effect of financial
development is greater in quantile having higher financial integration. For quantile Q=0.9 the
financial development effect is 0.388 and for quantiles 0.1 and 0.5 their respective values are
0.141 and 0.212. An increase of borrowings slowdowns the rate of deposits. This partial
conclusion appears with financial intermediation signs. The more microfinance institutions
collect deposits, the more they are financial intermediated.
Thus an increase of financial integration degree for microfinance is negatively linked to
the percentage of deposits collected. But, as noted in the applied case of Kenyan microfinance,
18 funds and total deposits. External funds (borrowings) has to increase but less than the total
deposit, to insure them a good performance.
Let consider now the leverage effect measures by the percentage of equity to assets.
Equity/assets is significantly and negatively linked to financial integration. Obviously, a
decrease of equity to assets equal to a decline of agency cost and inversely to a raise of leverage.
So, the result show a decrease of agency costs induces an increase of financial integration of
microfinance. Across the quantiles, the agency costs effects are differently weighted. In model
(2) reducing agency cost is higher in quantiles 0.1 and 0.5. For quantile Q=0.9, reducing agency
cost is less important. Thus, microfinance institutions that are less financially integrated needs
to raise their leverage ratio. This is true because they can reduce their agency costs.
Next, let analyze the trade-off in microfinance impacts on financial integration.
Microfinance targeting an increase of returns measures by return on assets (ROA), less
improves their financial integration. Besides, an analysis across status reveals none significant
effect. Microfinance targeting a decrease of cost measures by operational self-sufficiency
(OSS), also less improves their financial integration. As the results show, there is a significant
and inverse relationship between OSS and financial integration for quantile Q=0.5. the
associated parameter value is -10.666.
If microfinance choose to improve outreach, two distinguished effects are depth of
outreach effect and breadth of outreach effect. As remarked, an increase of average loan induces
an increase of financial integration level across the quantiles with differentiate associated
values. Quantile with low financial integration values the impact of average loan is positive. In
quantile Q = 0.1 its coefficient parameters is equal to 3.045. In quantiles Q=0.5 and Q=0.9 the
respective parameter values are 2.501 and 2.90. The breadth of outreach measures by the
19 Q=0.1, there is a significant effect of the number of active clients. An increase of the number
of active borrowers raises the financial integration of microfinance.
The increase of average loan is consecutive to an increase of the number of active
borrowers. So, there is no appearance of mission drift with financial integration. This is real in
quantile Q=0.1 where microfinance is less financial integrated. Therefore, by considering
microfinance performance, outreach has great effect on financial integration more than financial
performance. Microfinance that plans to increase their average loans with an increase of their
number of active borrowers perform better in a financial integration.
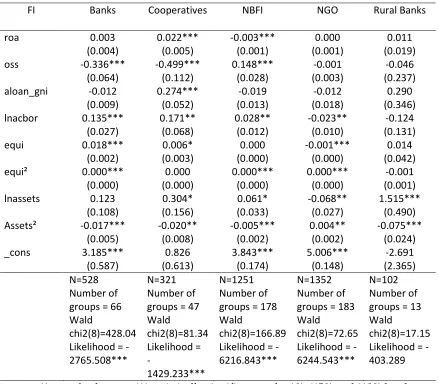
Robustness check of trade-off impacts is done according to each microfinance status.
According to results, increasing profit and decreasing costs both improve financial integration
of credit and savings cooperatives. But, for NBFIs effects are reverse. NBFIs are more
financially integrated if they don’t focus on profit, but on increasing income that covers their
cost. So in short, financial integration of NBFIs is improved by minimizing their cost with less
profit.
[Insert table 5]
In addition, an analysis of outreach according to microfinance status as table 5 shows,
reveals for credit and savings cooperatives a cumulative increase of average loans and number
of active borrowers. There is no mission drift appearance for cooperatives when they choose to
be more financially integrated. In the cases of banks and NBFIs, increasing the number of active
clients raise their financial integration. So, microfinance that attracts new clients send a good
signal to external investors on their ability to extend their clients’ portfolio. It is good incentive
for external investors to more invest in their capital. Nevertheless, for NGOs, an increasing of
20 What’s more, let analyze additional significant effects of assets size, economic growth,
aids and inflation. An increase of assets induces a decline of financial integration in
microfinance. This fact is significantly true for banks, cooperatives and NBFI. According to the
robustness check, the assets size of all microfinance are negatively and significantly linked to
their financial integration level. Nevertheless, an increase of NGOs assets raises their financial
integration.
Economic growth has a positive impact on financial integration of microfinance.
Economic growth increases financial integration in top quantiles Q = 0.5 and 0.9. The highest
value is in quantile Q = 0.5. Similarly, increasing aid positively impacts financial integration.
For less financially integrated microfinance, increasing remittances help them to improve their
financial integration. Inflation is positively linked to financial integration of microfinance. A
high consumption price implies high external funds in microfinance.
5. Conclusion
To conclude, this study analyses the growth of microfinance by examining how some
driven forces heighten more or less their financial integration. Three main driven forces
identify: agency costs, financial development and trade-off in microfinance. There are two
added values related to this study: an empirical value and a theoretical value. First, most
currents microfinance analysis used panel data approach with a GLS method applied for fixed
or random effects. Those methods highlight mean effects and don’t consider distributional
effects. Thus, the use of quantile regression considers those limits. This allows us to highlight
different weighted effects of driven forces along the entire distribution of financial integration.
In an empirical view related to microfinance studies, this is our first added value. So in our
21 institutions are more financially integrated and another group where they are less financially
integrated. We saw different weighted impacts of driven forces along the quantiles and
microfinance status on financial integration degree.
The second is on theoretical approach where we also highlight the effect of those driven
forces on the financial integration. As we argue, the first assumption is a positive relationship
between financial development and financial integration. The second one is a positive
relationship between leverage and financial integration. The third one is positive link between
mission drift, and financial integration.
The results show first that high financial development can easily improve financial
integration of microfinance, by expanding rate of external investors. Nevertheless, as viewed,
high financial integration can also reach where financial development is low. One reason gave
is that only larger microfinance with highest market share can be easily financially integrated.
There is inverse link between agency costs and financial integration of microfinance. At last,
outreach performs better than financial performance in improving their financial integration.
There is no mission drift across quantiles and status. Microfinance institutions that plan to
increase their average loans with an increase of their number of active borrowers perform better
in a financial integration.
All in all, an improvement of financial integration in microfinance relies on financial
development, agency cost and outreach. Increasing financial performance of microfinance
slowdowns their financial integration. For developing countries an environmental context
where microfinance can easily borrow will improve developing the whole financial sector. Less
financially integrated microfinance needs the support of policy makers. External investors have
to manage two problems associated to less financially integrated microfinance. Those problems
are: adverse selection and moral hazard of microfinance institutions. Policy makers could help
22 decrease the moral hazard negative effect. One result will be more external investors that raise
capital of microfinance. Policy makers could also ease formal environment to clear
microfinance sector. This will appear for external investor as a good signal to choose efficient
project where to invest. Thus, this action will lessen adverse selection problem managing by
external investors.
23 References
Ahlin, Christian, Jocelyn Lin, et Michael Maio. 2011. « Where does microfinance flourish?
Microfinance institution performance in macroeconomic context ». Journal of Development
Economics 95 (2): 105‑20.
Armendáriz, Beatriz, Ariane Szafarz, et others. 2011. « On mission drift in microfinance
institutions ». The handbook of microfinance 341: 366.
Bateman, Milford. 2010. Why doesn’t microfinance work?: the destructive rise of local
neoliberalism. Zed Books.
Berger, Allen N., et Emilia Bonaccorsi Di Patti. 2006. « Capital structure and firm performance:
A new approach to testing agency theory and an application to the banking industry ». Journal
of Banking & Finance 30 (4): 1065‑1102.
Cull, Robert, A. Demirguc-Kunt, Jonathan Morduch, B. Armendáriz, et M. Labie. 2011.
« Microfinance trade-offs: regulation, competition and financing ». Handbook of Microfinance,
Washington: World Scientific Publishing, 141‑57.
Cull, Robert, Jonathan Morduch, et others. 2007. « Financial performance and outreach: a
global analysis of leading microbanks* ». The Economic Journal 117 (517): F107‑33.
Duflo, Esther. 2010. Lutter contre la pauvreté : Tome 2, La politique de l’autonomie. Seuil.
Ghosh, Saibal, D. M. Nachane, Aditya Narain, et Satyananda Sahoo. 2003. « Capital
requirements and bank behaviour: an empirical analysis of Indian public sector banks ». Journal
of International Development 15 (2): 145‑56.
Gonzalez, Adrian. 2007. « Resilience of microfinance institutions to national macroeconomic
events: An econometric analysis of MFI asset quality ».
24 Harris, Milton, et Artur Raviv. 1991. « The theory of capital structure ». the Journal of Finance
46 (1): 297‑355.
Hartarska, Valentina. 2005. « Governance and performance of microfinance institutions in
Central and Eastern Europe and the newly independent states ». World development 33 (10):
1627‑43.
Hartarska, Valentina, et Denis Nadolnyak. 2008. « An impact analysis of microfinance in
Bosnia and Herzegovina ». World Development 36 (12): 2605‑19.
Hermes, Niels, Robert Lensink, et Aljar Meesters. 2009. « Financial Development and the
Efficiency of Microfinance Institutions ». SSRN Scholarly Paper ID 1396202. Rochester, NY:
Social Science Research Network. http://papers.ssrn.com/abstract=1396202.
Jensen, Michael C., et William H. Meckling. 1976. « Theory of the firm: Managerial behavior,
agency costs and ownership structure ». Journal of financial economics 3 (4): 305‑60.
Kah, Jainaba ML, Dana L. Olds, et Muhammadou MO Kah. 2005. « Microcredit, Social
Capital, and Politics: The Case of a Small Rural Town" Gossas, Sendgal ». Journal of
Microfinance/ESR Review 7 (1): 121‑52.
Kar, Ashim Kumar. 2012. « Does capital and financing structure have any relevance to the
performance of microfinance institutions? » International Review of Applied Economics 26 (3):
329‑48.
Krauss, Nicolas, et Ingo Walter. 2009. « Can microfinance reduce portfolio volatility? »
Economic Development and Cultural Change 58 (1): 85‑110.
Littlefield, Elizabeth, Jonathan Morduch, et Syed Hashemi. 2003. « Is microfinance an effective
25 Morris, Gayle, et Carolyn Barnes. 2005. « An assessment of the impact of microfinance: a case
study from Uganda ». Journal of Microfinance/ESR Review 7 (1): 4.
Myers, Stewart C. 1977. « Determinants of corporate borrowing ». Journal of financial
economics 5 (2): 147‑75.
———. 2001. « Capital structure ». Journal of Economic perspectives, 81‑102.
Prasad, Eswar S., Kenneth Rogoff, Shang-Jin Wei, et M. Ayhan Kose. 2007. « Financial
globalization, growth and volatility in developing countries ». In Globalization and Poverty,
457‑516. University of Chicago Press. http://www.nber.org/chapters/c0114.pdf.
Rai, Ashok, et Shamika Ravi. 2011. « Do spouses make claims? Empowerment and
microfinance in India ». World Development 39 (6): 913‑21.
Stulz, RenéM. 1990. « Managerial discretion and optimal financing policies ». Journal of
financial Economics 26 (1): 3‑27.
Vanroose, Annabel, et Bert D’Espallier. 2013. « Do microfinance institutions accomplish their
mission? Evidence from the relationship between traditional financial sector development and
microfinance institutions’ outreach and performance ». Applied Economics 45 (15): 1965‑82.
doi:10.1080/00036846.2011.641932.
Williams, Joseph. 1987. « Perquisites, risk, and capital structure ». The Journal of Finance 42
26 Table 1. Mean of financial integration and financial development by sub-regions in
developing countries
Sub-regions Mean Standard Errors 95% Conf.
Interval
FI
Africa 39.172 1.206 36.807 41.537
Middle East and North Africa 98.219 0.876 96.503 99.936 East Asia and the pacific 54.548 1.652 51.309 57.787 Eastern Europe and Central
Asia
82.133 1.124 79.929 84.337
Latin America and the Caribbean
71.967 0.959 70.087 73.846
South Asia 75.478 1.137 73.249 77.706
FD
Africa 22.591 0.640 21.336 23.845
Middle East and North Africa 96.388 2.117 92.237 100.539 East Asia and the pacific 47.064 1.450 44.221 49.908 Eastern Europe and Central
Asia
34.712 0.709 33.322 36.102
Latin America and the Caribbean
39.472 0.536 38.421 40.523
South Asia 56.291 0.578 55.157 57.425
27 Table 2. Mean of financial integration by Status of MFIs
status Mean Standard Error
95% conf. Interval
FI
bank 42.226 1.259 39.757 44.695
Cooperatives 29.261 1.615 26.095 32.426
nbfi 78.903 0.816 77.303 80.503
ngo 82.001 0.707 80.615 83.387
Rural Banks 34.781 2.671 29.546 40.017 others 65.924 7.314 51.584 80.264
28 Table 3. Summary statistics
Variable Obs Mean Std. Dev. Min Max
FI=borrowings/total funds
4278 68.757 36.243 0 100
fin 8804 0.219 0.413 0 1
bank 8804 0.133 0.340 0 1
cooperatives 8804 0.098478 0.298 0.000 1
nbfi 8804 0.357 0.479 0 1
ngo 8804 0.376 0.485 0 1
dc_fs 8603 39.561 25.852 -16.378 195.938
roa 5478 1.652 10.434 -213.670 100.890
oss 5975 1.173 0.710 -0.004 36.627
aloan_gni 6006 0.720 2.073 0 94.712
acbor 6058 106837.400 498795.200 0 8166287
equi 6184 34.450 27.166 -156.952 117.266
lnassets 5494 9.024 1.982 -1.092 15.646
gdppc_growth 8722 3.352 4.037 -34.960 50.031
lnremirec 8342 20.739 1.981 9.348 24.971
lnaid 8498 20.273 0.971 15.384 23.968
infl_cp 8391 8.669 29.519 -10.067 1058.374
29 Table 4. Links between financial integration, financial development and microfinance
performance along the quantiles
Q = 0.1 N = 3230
Q = 0.5 N = 3230
Q = 0.9 N = 3230
FI Model 1 Model 2 Model 1 Model 2 Model 1 Model 2
fin -54.966***
(6.790) -35.070 (36.330) -59.996*** (2.166) -58.049*** (5.262) -41.849*** (2.166) -51.781*** (3.906)
dc_fs 0.171***
(0.044) 0.141*** (0.049) 0.092** (0.040) 0.212*** (0.075) 0.180** (0.086) 0.388*** (0.122)
roa 0.430***
(0.153) 0.291 (0.252) 0.205 (0.165) 0.303* (0.173) -0.003 (0.165) 0.095 (0.189)
oss -0.220
(1.578) -4.356 (3.813) -7.201*** (2.091) -10.666*** (3.005) -0.854 (4.010) -7.350*** (0.767) aloan_gni 2.877
(1.868) 3.045*** (1.156) 2.470 (1.966) 2.501** (1.205) 1.914** (0.765) 2.900** (1.184)
lnacbor 2.956
(1.927) 4.147** (1.967) 2.385 (1.928) 2.215 (2.455) 0.231 (0.849) -0.354 (1.596)
equi -0.657***
(0.168) -0.568 (0.478) -0.260*** (0.091) -0.410** (0.166) -0.102** (0.040) -0.125 (0.109)
lnassets -2.752
(1.966) -3.323 (2.639) -4.768** (2.024) 3.129 (3.241) -2.213** (0.958) -4.829* (-2.540)
lnassetsB -7.489**
(3.251)
-15.115*** (3.851)
-6.368** (2.996)
lnassetsC 0.615
(2.077)
-6.548** (2.912)
-1.095 (3.450)
lnassetsN -2.608
(2.433)
-8.336** (3.986)
3.785 (2.721)
lnassetsNGO 1.984
(2.680)
-5.056 (3.248)
3.977 (2.497) gdppc_growth 0.185
(0.31) 0.316 (0.220) 0.357* (0.194) 0.540** (0.215) 0.254** (0.117) 0.394 (0.251) lnremirec 1.7903***
(0.552) 2.015*** (0.474) 1.426 (0.932) 1.041 (0.865) -0.188 (0.724) -0.664 (0.936)
lnaid -0.9504
(1.527) 0.524 (0.914) 1.468** (0.746) 2.509*** (0.741) 2.052*** (0.561) 1.761 (1.165)
infl_cp 0.4245
(0.33) 0.109 (0.308) 0.801*** (0.215) 0.434** (0.221) 0.262** (0.130) 0.315 (0.282)
bank 2.809
(4.376) 98.061*** (35.755) 13.775*** (3.301) 176.202** * (42.469) 16.821*** (4.023) 105.597*** (31.841) cooperatives 6.177*
(3.726) -0.384 (20.397) 3.090 (3.648) 59.350** (28.917) 7.496 (7.093) 3.567 (36.882)
nbfi 13.4136***
(3.147) 40.806 (24.746) 18.653*** (3.084) 94.990** (41.443) 18.037*** (3.473) -14.431 (26.509)
ngo 21.2914***
(5.037) -0.780 (24.550) 30.872*** (3.716) 76.892** (32.847) 21.453*** (3.325) -9.695 (23.526)
_cons 27.2782
(40.461) -25.705 (37.917) 36.553 (23.391) -44.859 (38.320) 60.905*** (22.714) 107.760** (46.186)
( ): standard errors. ***statistically significant at the 1%, **5% and *10% levels
30 Table 5. Links between financial integration and microfinance performance along the types of
MFIs
FI Banks Cooperatives NBFI NGO Rural Banks
roa 0.003
(0.004) 0.022*** (0.005) -0.003*** (0.001) 0.000 (0.001) 0.011 (0.019)
oss -0.336***
(0.064) -0.499*** (0.112) 0.148*** (0.028) -0.001 (0.003) -0.046 (0.237) aloan_gni -0.012
(0.009) 0.274*** (0.052) -0.019 (0.013) -0.012 (0.018) 0.290 (0.346) lnacbor 0.135***
(0.027) 0.171** (0.068) 0.028** (0.012) -0.023** (0.010) -0.124 (0.131)
equi 0.018***
(0.002) 0.006* (0.003) 0.000 (0.000) -0.001*** (0.000) 0.014 (0.042)
equi² 0.000***
(0.000) 0.000 (0.000) 0.000*** (0.000) 0.000*** (0.000) -0.001 (0.001)
lnassets 0.123
(0.108) 0.304* (0.156) 0.061* (0.033) -0.068** (0.027) 1.515*** (0.490) Assets² -0.017***
(0.005) -0.020** (0.008) -0.005*** (0.002) 0.004** (0.002) -0.075*** (0.024)
_cons 3.185***
(0.587) 0.826 (0.613) 3.843*** (0.174) 5.006*** (0.148) -2.691 (2.365) N=528 Number of groups = 66 Wald
chi2(8)=428.04 Likelihood = - 2765.508***
N=321 Number of groups = 47 Wald chi2(8)=81.34 Likelihood = - 1429.233*** N=1251 Number of groups = 178 Wald
chi2(8)=166.89 Likelihood = - 6216.843***
N=1352 Number of groups = 183 Wald
chi2(8)=72.65 Likelihood = - 6244.543***
N=102 Number of groups = 13 Wald
chi2(8)=17.15 Likelihood = - 403.289
( ): standard errors. ***statistically significant at the 1%, **5% and *10% levels
31 Graph 1. Percentage of borrowings according to the level of financial development
Source. Author
0
5
0
1
0
0
1
5
0
2
0
0
D
o
m
e
s
ti
c
c
re
d
it
p
ro
v
id
e
d
b
y
t
h
e
f
in
a
n
c
ia
l
s
e
c
to
r
0 .2 .4 .6 .8 1
32 Graph 2. Relationship between borrowings and assets
Source. Author
0
5
1
0
1
5
2
0
2
5
A
s
s
e
ts
g
ro
w
th
(
ln
a
s
s
e
ts
)
0 .2 .4 .6 .8 1
Percentage of borrowings
33 Graph 3. Financial integration pathway
Source. Author
0
.2
.4
.6
.8
1
Q
u
a
n
ti
le
s
o
f
p
e
rc
e
n
ta
g
e
o
f
b
o
rr
o
w
in
g
s
0 .25 .5 .75 1
34 Graph 4. Quantile graph relationship between financial integration, financial development, agency costs and microfinance performance
Source. Author 0 .0 0 0 .5 0 1 .0 0 1 .5 0 In te rc e p t
0 .2 .4 .6 .8 1
Quantile 0 .0 0 0 .0 0 0 .0 0 0 .0 0 0 .0 0 0 .0 1 d c _ fs
0 .2 .4 .6 .8 1
Quantile -0 .2 0-0 .1 5-0 .1 0-0 .0 5 0 .0 0 0 .0 5 e q u i_ a s s
0 .2 .4 .6 .8 1
Quantile 0 .0 0 0 .2 0 0 .4 0 0 .6 0 0 .8 0 ro a
0 .2 .4 .6 .8 1
Quantile -0 .0 4 -0 .0 2 0 .0 0 0 .0 2 0 .0 4 o s s
0 .2 .4 .6 .8 1
Quantile -0 .1 5 -0 .1 0 -0 .0 5 0 .0 0 a v lo a n _ g n i
0 .2 .4 .6 .8 1
Quantile -0 .0 8 -0 .0 6-0 .0 4 -0 .0 2 0 .0 0 0 .0 2 ln a c b o r
0 .2 .4 .6 .8 1