DEVELOPMENT AND VALIDATION OF DIFFERENCE
SPECTROSCOPIC METHOD FOR DETERMINATION OF
BUPROPION IN ITS TABLET DOSAGE FORM
Patel Neelam*1, Vaghela Pooja2 and Sanjay Gohil3
1
Shri B.M. Shah College of Pharmacy, Modasa, Gujarat, India. 2
Shantilal Shah College of Pharmacy, Bhavanagar, Gujarat, India.
3
S.K.Patel College of Pharmaceutical Education & Research, kherva, Gujarat, India.
ABSTRCT
A simple, accurate & precise difference spectroscopy method was
developed for determination of Bupropion in its pharmaceutical dosage
form. The proposed method depends upon measuring the amplitude of
absorbance on difference spectra of Bupropion in 0.001N NaOH and
0.001N HCl at 234nm and 254nm respectively. The calibration curve
linear over the range 2.5-30 µg/ml with correlation coefficient (r)
0.9998. The percentage of recovery found to be 99.20-98.30%. The
developed method validated statistically and was applied successfully
for routine analysis of Bupropion in its Tablet Dosage form.
KEYWORDS: Bupropion, Difference spectroscopy, Antidepressant.
INTRODUCTION
Bupropion(BUP), (±)-2-(tert-butylamino)-1-(3chlorophenyl)propan-1-one. It is dopamine -
noradrenaline reuptake inhibitor and has also been shown to act as a noncompetitive α3β4
nicotinic antagonist primarily used as an antidepressant and smoking cessation aid.It is also
used in Sexual dysfunction Obesity, Attention-deficit hyperactivity disorder, Crohn's disease
and Mood stabilizer in patients with bipolar depression.[1-3]
Literature survey revealed that some various bioanalytical methods have been reported for
Bupropion, which includes HPLC& UPLC/MS/MS, LC/MS/MS in Human Plasma[4-6], HPLC
in dog plasma[7],LC-MS in Rat Plasma., Spectrophometric, HPLC, and stability studies in
UV[8-12] in Tablet dosage form.
*Correspondence for Author
Patel Neelam
Shri B.M. Shah College of Pharmacy, Modasa, Gujarat, India. Article Received on 27 Dec 2015,
To the best of author’s knowledge, Differerance spectroscopic method development not yet
been reported for estimation of BUP. So, it was thought of interest to develop such an
approach for the quantitative analysis of BUP in pharmaceutical formulation.
MATERIALS AND METHODS
Bupropion pure powder was obtained as a gift sample from Cadila Healthcare Limited
(Ahmedabad, India). All the reagents used were of AR grade and procured from S. D. Fine
chemicals. A Shimadzu UV-1700 double beam UV-Visible spectrophotometer attached with
computer operated software UV probe 2.0 with spectral width of 2 nm, wavelength accuracy
of 0.5 nm and pair of 1 cm matched quartz cells was used to measure absorbance of the
resulting solutions. A Sartorius (CP224S) analytical balance and ultrasonic cleaner (Frontline
FS-4) sonicator were used during the study. Tablets of Bupropion were purchased from local
pharmacy.
A standard stock solution of Bupropion (1mg/ml) was prepared by dissolving 100 mg pure
drug in 100ml volumetric flask with 0.001N HCl: Methanol (80:20) as diluent. Aliquots of
working standard (100 μg/ml) solution of Bupropion were suitably diluted with diluents to
obtain the final concentration in the range of 2.5-30 μg/ml. The amplitude of absorbance of
difference spectra of Bupropion in 0.001N NaOH and 0.001N HCl at 234nm and 254nm
respectively was used for measurement. Linear correlation was obtained by plotting
Amplitude of absorbance versus concentrations of Bupropion.
For analysis of Bupropion in tablet dosage form, ten tablets were accurately weighed and
powdered for analysis. A quantity of accurately weigh powder equivalent to 100 mg of
Bupropion was transferred to a 100 ml volumetric flask, sonicated for 15 minutes with
diluent to dissolve the drug as completely as possible and diluted up to to100 ml with diluent.
This resulting solution was diluted to produce 100 μg/ml of sample solution .Again suitable aliquots from 100 μg/ml further diluted to achieve 20 μg/ml. The solution was filtered through 0.45 μ Millipore PVDF filter; filtrate was collected after discarding first few ml.
RESULT AND DISCUSSION Method development
In Difference spectroscopic method the absorption spectra of equimolar solutions of Drug in
It may be generated automatically using a double beam recording spectrophotometer with the
solution 1 in the sample cell and the solution 2 in the reference cell (Fig. 2). The absorbance
was measured at two wavelengths, one being the peak maxima and other being peak minima.
For this measurement, equimolar solution of Bupropion was prepared separately in 0.001 N
HCl as well as in 0.001 N NaOH at a concentration of 20 µg /ml. They were scanned in the
wavelength range of 200-400 nm. Data were recorded at an interval of 1 nm. From the
difference spectrum of drug in two different form, absorbances were measured at selected
wavelength i.e. 234 nm Peak maxima and 258 nm Peak minima. The amplitude, which is sum
of magnitude of absorbances at above two wavelengths, was selected for the measurement. It
was calculated and used to obtain the concentration. The isobestic points (points representing
zero absorbance corresponding to cutting points of acidic and alkaline spectra) was recorded
at 244 nm ,which were identical irrespective of the pH of solution in reference cell. There
was no change in isobestic points, which reveals that there was no interference by additives.
Fig. 2 difference absorption spectra of basic solution of bupropion against acidic solution.
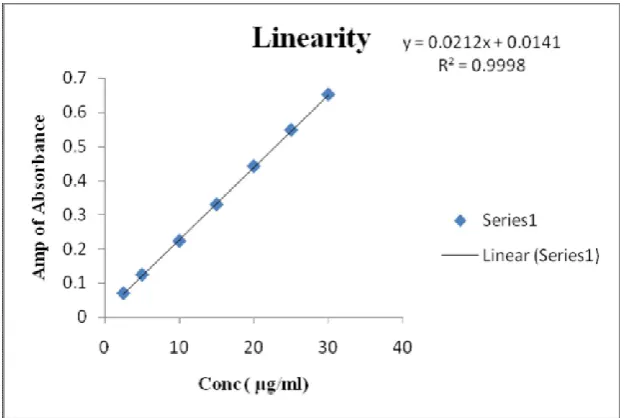
Fig 3 calibration curve of bupropion by difference spectroscopic method
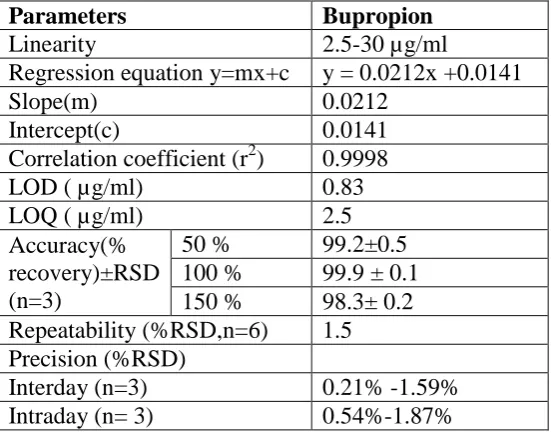
The developed method was validated as per ICH guidelines [12] and validation parameters are
summarized in Table 1.
Linear correlation (fig.3) was obtained between Amplitude of absorbance at 234nm & 258nm
versus concentrations of Bupropion in the ranges of 2.5 – 30 µg/ml.
Recovery studies were done by spike placebo method by adding known quantity of drug (50
%, 100 % and 150 % levels) to placebo mixtures were sonicated and filtered through 0.45µ
[image:4.595.142.456.351.560.2]precise and reproducible. The LOD and LOQ values were calculated based on signal to noise
ratio equation as per ICH guidelines.Low value of LOD and LOQ describe the method as
sensitive.
The assay results obtained was 99.9 ± 0.19 (Table 2), indicate the excipients do not interfere
during the analysis normally present in the tablet.
Table 1.Regression analysis data and validation parameters by proposed Difference Spectroscopic method
Parameters Bupropion
Linearity 2.5-30 µg/ml
Regression equation y=mx+c y = 0.0212x +0.0141
Slope(m) 0.0212
Intercept(c) 0.0141
Correlation coefficient (r2) 0.9998
LOD ( µg/ml) 0.83
LOQ ( µg/ml) 2.5
Accuracy(% recovery)±RSD (n=3)
50 % 99.2±0.5
100 % 99.9 ± 0.1
150 % 98.3± 0.2
Repeatability (%RSD,n=6) 1.5
Precision (%RSD)
Interday (n=3) 0.21% -1.59%
Intraday (n= 3) 0.54%-1.87%
a
Limit of detection,bLimit of quantification ,cRelative standard deviation
Table 2.Analysis of bupropion in tablets by proposed difference spectroscopic method Formulation Label Claim (mg) Amount found % Assay*± SD
Tablet 300 299.70 99.9±0.19
*Avarage of three determination,dStandard deviation
CONCLUSION
Based on the results, obtained from the analysis of Bupropion using described method, it can
be concluded that Bupropion has linear response in the range of 2.5 – 30 μg/ml with
coefficient of correlation, (r2) = 0.9998 by this method.
The result of the analysis of pharmaceutical formulation by the proposed method is highly
reproducible and reliable and is in good agreement with label claim of the drug. The additive
[image:5.595.161.437.265.481.2]with determination of Bupropion. The method can be used for the routine analysis of
Bupropion in dosage form.
ACKNOWLEGMENT
All Authors were thankful to S K Patel Pharmaceutical Education & Research,Ganpat
Vidhyanagar,Mehsana for providing facilities to carry out work.
REFERRANCE
1. Satoskar RS, Bhandarkar SD, Ainapure SS. Pharmacology and pharmacotherapeutics.
14th ed., 1995; 539- 45.
2. Rang HP, Dale MM, Ritter JM, Moore PK. Essentials of Pharmacology. 5th ed., 2003;
370-71.
3. Colin D. Therapeutic drugs. 2nd ed. Churchill livingstone, 1998; 11.
4. Loboz KK, Gross AS, Ray J,McLachlan AJ. “HPLC assay for bupropion and its major
metabolites in human plasma” J Chromatogr B, 2005; 823(2): 115-121.
5. Rebecka C, Evan D. Stereoselective analysis of bupropion and hydroxybupropion in
human plasma and urine by LC/MS/MS. Journal of Chromatography B, 2007; 857: 67–
75.
6. Wang X, Vernikovskaya DI, Abdelrahman DR, Hankins GD, Ahmed MS, Nanovskaya
TN. Simultaneous quantitative determination of bupropion and its three major metabolites
in human umbilical cord plasma and placental tissue using high-performance liquid
chromatography-tandem mass spectrometry. J Pharm Biomed Anal., 2012; 70: 320.
7. Virginia B, Eric Y, John D, Jack H. High-throughput liquid chromatography-tandem
mass spectrometry determination of bupropion and its metabolites in human, mouse and
rat plasma using a monolithic column. J of Chromatogr B, 2004; 804: 277–287.
8. Dandan Z, Bo Y, Mingxi Q, Famei Li. HPLC determination and pharmacokinetics of
sustained-release bupropion tablets in dogs. J of Pharm and Biomed Anal, 2003; 33:
287-293.
9. Hu L, Wang Z, Xu R, Ma J, Wang X, Zhang X. Determination of bupropion and its main
metabolite in rat plasma by LC-MS and its application to pharmacokinetics.
Pharmazie, 2011; 66: 924-8.
10.Yeniceli D, Ak D, Dogrukol. The Retention Behaviour of Bupropion Hydrochloride in
Reversed Phase Ion Pair LC and Validated Analysis of the Drug in Pharmaceuticals.
UV Spectrophotometric Method in Bulk and Pharmaceutical Dosage Form. International
J of Pharma and Pharmaceutic. Sci Res., 2013; 3(3): 103-107.
12.ICH, Q2A Text on validation of analytical procedures. International Conference on