Abstract— This paper aims to design an intelligent flow measuring instrument. The objectives of this work are (i) to extend the linearity range of venturi and (a) to eliminate the dependency of venturi to pipe diameters ratio, (b) the dependency of liquid density, and (c) the effect of liquid temperature on the output. The output of venturi is differential pressure, which is converted to voltage by using data conversion unit. An ANN block is added in cascade to the data conversion unit. This arrangement helps to linearise the overall system and makes it independent of ratio between venturi to pipe diameter, liquid density and temperature. Since the proposed intelligent flow measuring instrument produces output independent of liquid density, temperature and ratio between venturi to pipe diameter, the proposed work avoids the requirement of repeated calibration when any or a combination of the liquid and parameters are changed.
Index Terms— Artificial neural networks, Flow Measurement, Venturi, Sensor Modeling
I. INTRODUCTION
Flow control is a very important process in any industry, since control of many parameters in industry is achieved by control of flow. For example temperature control is done by controlling the flow of steam; pressure control in pneumatic or hydraulic driven instruments is done by flow of air or liquid, etc. Control of flow can be achieved only by accurately measuring the flow. In other cases, inaccurate flow measurements or failure to take measurements can cause serious (or even disastrous) results. With most liquid flow measuring instruments derives its principle from Bernoulli laws, the flow rate is determined inferentially by measuring the liquid's velocity or the change in kinetic energy. Velocity depends on the pressure differential that is forcing the liquid through a pipe or a conduit. Because the pipe's cross-sectional area is known, the average velocity is an indication of the flow rate. Many sensors are used for this purpose; Venturi finds a very wide application because of its high sensitivity and ruggedness. However the problem of offset, high non-linear response characteristics, dependence of output on the ratio between venturi and pipe diameter, liquid density and temperature have restricted its use and further imposing difficulties. To overcome the difficulties faced due to the nonlinear response characteristics of the venturi, several techniques have been suggested which are tedious and time consuming. Further, the process of
“An Intelligent Flow Measuring Technique Using Venturi”
Santhosh K V, Research Scholar, Dept of Electrical Engineering, National Institute of Technology, Silchar, India, email: [email protected]
calibration needs to be repeated every time the diameter ratio or liquid is changed. The problem of nonlinear response characteristics of a venturi further aggravates the situation when there is change in liquid temperature. Since the output of venturi is dependent on flow rate as well as temperature of the liquid.
To overcome the above difficulties, a smart flow measurement technique is proposed in this paper using artificial neural network. This network is to train the system to extend linearity range and makes the output independent of ratio of diameter between venturi and pipe, liquid density and temperature.
In [1], calibration of orifice is discussed. In [2], measurement of flow for different area of venturi nozzle is discussed. In [3] Calibration of flow meter is done with the help of microcontrollers. In [4] & [11], a simulation model of venturi flow meter for measurement of flow rate is discussed. In [5], [7], [8], [10] & [12], linearization of venturi is discussed using neural network algorithms. In [6], different flow measurements are discussed. In [9], linearization of venturi flow meter is discussed using mathematical computations. In [13], linearization of capacitive level sensor and making the output independent of liquid using neural network algorithm is discussed. Linearization of capacitive pressure sensor and making the output independent of physical parameters of diaphragm using neural network algorithm is discussed in [14].
The paper is organized as follows: after introduction in Section-I, a brief description on venturi model is given in Section-II. The output of the venturi is pressure; a brief discussion on data conversion i.e. pressure to voltage converter is discussed in Section-III. Section-IV deals with the problem statement followed by proposed solution in Section-V. Finally, result and conclusion is given in Section-VI.
II. VENTURIFLOWMETER
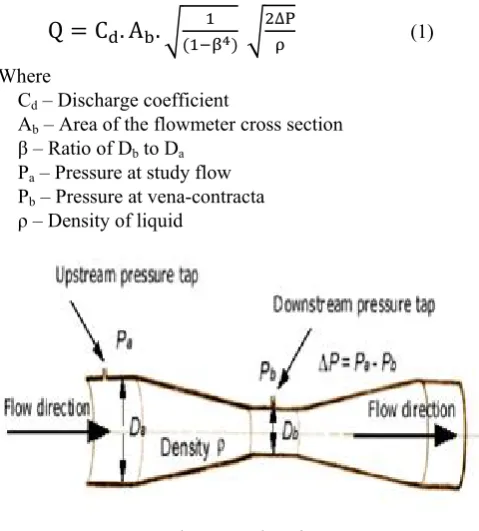
A venturi (shown in Fig. 1) is a device used for measuring the volumetric flow rate. It uses the Bernoulli's principle which gives a relationship between the pressure and the velocity of the fluid. When the velocity increases, the pressure decreases and vice versa. A venturi nozzle is a tapered structure. It is usually placed in a pipe in which fluid flows. When the fluid reaches the venturi nozzle, the fluid is forced to converge to go through the small hole. The point of maximum convergence actually occurs shortly downstream of the venturi nozzle, which is called vena-contracta point. As it flows so, the velocity and the pressure
An Intelligent Flow Measuring Technique Using
Venturi
β – Ratio of Db to Da
Pa – Pressure at study flow
Pb – Pressure at vena-contracta
[image:2.595.48.288.123.389.2]ρ – Density of liquid
Fig. 1. Venturi nozzle
The effect of temperature on the density [17-18] is shown by
ρ
⁄ (2)
Where:
ρt – specific density of liquid at temperature ‘t oC’
ρto – specific density of liquid at temperature ‘to oC’
Pt – pressure at temperature‘t oC’
Pto – pressure at temperature ‘to oC’
k – Bulk modulus of liquid
α – temperature coefficient of liquid
The block diagram representation of the proposed instrument is shown in Fig 2.
[image:2.595.309.538.353.526.2]
Fig. 2. Block diagram of the proposed flow measuring technique
III. DATACONVERSIONUNIT
In this section, characteristic of venturi is simulated to understand the difficulties associated with the available measuring scheme. For this purpose, simulation is carried out with three different ratios of diameter between venturi and pipe is considered. These are β = 0.3, 0.6 and 0.9. Three different specific densities as ρ = 500 Kg/m3, 1000 Kg/m3
and 1500 Kg/m3 are chosen. For different temperatures, like
[image:2.595.309.543.531.723.2]t = 25 oC, 50 oC, 75 oC and 100 oC, are used to find the output differential pressure of venturi nozzle with respect to various values of input flow considering a particular diameter ratio between venturi and pipe, liquid density and temperature. These output pressure are used as inputs of data conversion circuit and output voltages are generated. The MATLAB environment is used for simulating.
Fig.3. Input flow Vs output voltage for variation of flow rate and temperature for diameter ratio of 0.3 and liquid density of 500 kg/m3
Fig.4. Input flow Vs output voltage for variation of flow rate and diameter ratio for temperature of 25 oC and liquid density of 500 kg/m3 Flow Venturi Data conversion unit ANN
Temperature Sensor
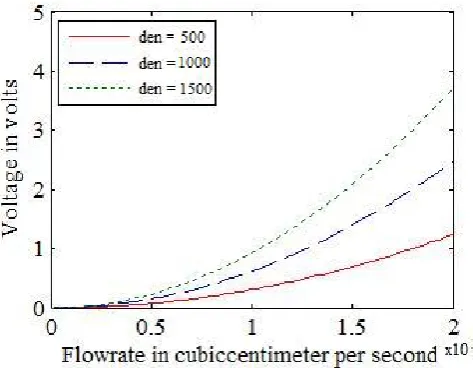
[image:2.595.46.285.594.713.2]Fig.5. Input flow Vs output voltage for variation of flow rate and liquid density for diameter ratio of 0.3 and temperature of 25 oC
Fig 3, Fig 4 and Fig 5 shows the variation of voltage with the change in input flow rate considering different values of diameter ratio, liquid density and temperature.
It has been observed from the above graphs that the relation between input flow rate and voltage output of data conversion unit has a non linear relation. Datasheet of venturi nozzle suggests that the input range of 10% to 60% of full scale is used in practice as linear range.. These are the reasons which have made the user to go for calibration techniques using some circuits. Further, the output voltage also varies with the change in diameter ratio, liquid density and temperature. These conventional calibration techniques have drawbacks that its time consuming and need to be calibrated every time when venturi nozzle is changed in the system or there is a change in liquid temperature or other liquid is used for measurement. Further, the use is restricted, to a portion of full scale for linearity.
To overcome these drawbacks, this paper makes an attempt to design a flow measuring technique incorporating intelligence to produce linear output and to make the system independent of diameter ratio, liquid density and temperature using the concept of artificial neural network.
V. PROBLEMSOLUTION
The drawbacks discussed in the earlier section are overcomed by adding an Artificial Neural Network (ANN) model in cascade with data converter unit. This model is designed using the neural network toolbox of MATLAB.
[image:3.595.51.288.55.239.2]The first step in developing a neural network is to create a database to train, validate and test the network. Output voltages of the system for the change in flowrate, diameter ratio, liquid density and temperature form the input matrix; target matrix would be the expected linear response of venturi meter as shown in Fig 6. Back propagation neural network is considered here [20-22].
Fig.6. Target graph
The functionality of ANN can be explained as given below. First the data is initialized; like training base (60\%), test base (20\%), validation base (20\%), number of layers and neurons, type of the transfer functions, number of iteration and estimate error threshold. The network is trained to compute the weights. Once the weights are computed, it is verified to have mean square error (MSE) is less than estimate error threshold (Th) for at least 10 consecutive readings. If the above condition is satisfied the whole model is saved, else the iteration for updates of ANN parameters continue till it reaches the maximum number of iteration and then the model is saved with caution that desired performance has not reached. Else the system will accept a new set of data to satisfy the conditions. After the network is trained, Mean Squared Error (MSE) is the average squared difference between outputs and targets. Lower value of MSE is better. Zero MSE means no error. Regression R measures the correlation between outputs and targets. An R value of 1 means a close relationship, 0 a random relationship.
[image:3.595.304.545.579.752.2]Initially, only one hidden layer is chosen and training, validation and testing is completed. The result is shown in Table 1. Since the value of R and MSE were not near the expected values, number of hidden layers is increased by one more and training, validation and testing are done again. This continuous till an appropriate number of hidden layer is formed out which results in acceptable values of R an MSE. In this case it is 4 as seen from Table 1. Fig 7 shows the structure of the neural network considered in the present case.
Table 1. Comparison of number of hidden layer with R and MSE
Layers Training Validation Test
1 R 0.876878 0.898654 0.900966
MSE 6.87E-02 1.10E-02 2.10E-02
2 R 0.93215 0.91253 0.987452
MSE 3.76E-03 5.87E-03 9.95E-02
3 R 0.99991 0.999932 0.99998
MSE 3.12E-06 1.43E-06 8.82E-06
4 R 0.99999 0.9999987 0.9999956
MSE 7.33E-08 5.17E-08 3.99E-08
5 R 0.999993 0.9999992 0.9999988
Fig.7. Structure of neural network model
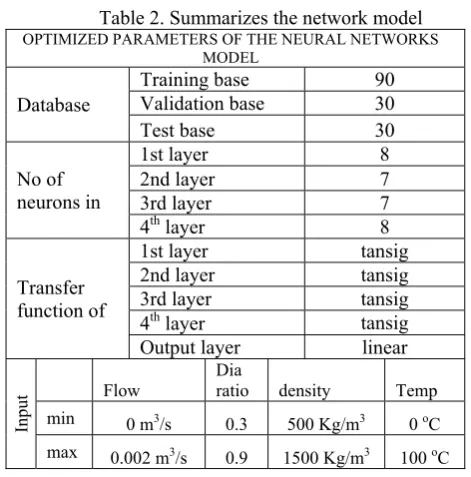
[image:4.595.52.285.55.184.2]With the details mentioned the network is trained, validated and tested. Table 2 summarizes the various parameters of the measured network model.
Table 2. Summarizes the network model OPTIMIZED PARAMETERS OF THE NEURAL NETWORKS
MODEL
Database
Training base 90 Validation base 30
Test base 30
No of neurons in
1st layer 8
2nd layer 7
3rd layer 7
4th layer 8
Transfer function of
1st layer tansig
2nd layer tansig
3rd layer tansig
4th layer tansig
Output layer linear
Input
Flow
Dia
ratio density Temp min 0 m3/s 0.3 500 Kg/m3 0 oC
max 0.002 m3/s 0.9 1500 Kg/m3 100 oC
VI. RESULT AND CONCLUSIONS
The proposed ANN is trained, validated and tested with the simulated data. Once the training is over, for the system with venturi nozzle along with other modules in cascade as shown in Fig 2, it is subjected to various test inputs corresponding to different flow rate at a particular diameter ratio, liquid density and temperature all within the specified range. These inputs are taken from the data obtained using an experimental setup and are given in Table 3 For testing purposes, the range of flow rate is considered from 0 to 0.002 m3/s, range of diameter ratio is 0.3 to 0.9, range of
specific density 500 kg/m3 to 1500 kg/ m3 and temperature
ranges 0 oC to 100 oC. The outputs of system with ANN are
shown in Table 3 corresponding to various input flow rate at different values of diameter ratio, liquid density and temperature. The input output result is plotted and is shown in Fig 8. The output graph is matching the target graph as shown in Fig 6.
It is evident from Fig 8, that the proposed measuring system discussed has incorporated intelligence to the venturi nozzle by increasing the linearity range of the venturi nozzle. Also, the output is made independent of diameter ratio, liquid density and temperature. Thus, if the liquid under measure is replaced by another liquid or ratio of diameter between venturi and pipe is changed then the system does not require any calibration. Similarly, if there is a change in liquid temperature then the system need not be calibrated to give the accurate reading.
In [3], [5], [7], [8], [9], [10] and [12], mainly the extension of linear range is discussed. The proposed work is a clear significant improvement over the existing reported works. The proposed work not only solves the task of extension of linear range but also makes the system output independent of physical dimension of venturi and pipe, density of liquid under measure and temperature of the liquid. Finally, the system need not be repeatedly calibrated to produce linear and accurate results upon wide variation of physical dimension of venturi nozzle, liquid density and temperature. Table 3 exhibits the good performance of the proposed intelligent flow measuring technique. Mesured flow rate using the proposed technique matches with the results obtained from a practical experimental setup.
Measurement noise is not considered in the present work. Performance of proposed measuring technique in presence of measurement noise will be taken up in future. An embedded system will be attempted incorporating the design technique to make if suitable for practical application.
APPENDIX
The results of the proposed technique when subjected to the practical data are tabulated in Table 3 and on seeing the results it is found matching the expected results.
Table 3. Results of proposed system for real data considering different physical parameters
Beta = 0.36, t = 25 oC, ρ = 1000 Kg/m3 Actual
flowrate in 10-3 m3/s
Vout from Data conv
Unit ANN o/p
Measured flowrate in 10-3 m3/s
0.1 0.18 0.25 0.1
0.2 0.41 0.5 0.2
0.3 0.6852 0.75 0.3
[image:4.595.43.279.252.491.2]0.5 1.1658 1.25 0.5
0.6 1.448561 1.499854 0.6
0.7 1.582 1.75 0.7
0.8 1.862 2 0.8
0.9 1.912 2.25 0.9
1 2 2.5 1
1.1 2.3425 2.75 1.1
1.2 2.6582 3.000256 1.2
1.3 2.985 3.25 1.3
1.4 3.258 3.5 1.4
1.5 3.541 3.75 1.5
1.6 3.758 4 1.6
1.7 3.895 4.25 1.7
1.8 4.232 4.5185 1.8
1.9 4.652 4.75 1.9
2 4.88 5 2
Beta = 0.6, t = 25 oC, ρ = 1000 Kg/m3
Actual flowrate
in 10-3 m3/s
Actual flowrate in
10-3 m3/s
Actual flowrate
in 10-3 m3/s
Actual flowrate in
10-3 m3/s
0.1 0.1 0.25 0.1
0.2 0.31 0.5 0.2
0.3 0.52 0.75 0.3
0.4 0.78 1 0.4
0.5 0.985 1.25 0.5
0.6 1.18 1.5 0.6
0.7 1.39 1.75 0.7
0.8 1.667 2 0.8
0.9 1.896 2.25 0.9
1 2.0158 2.5 1
1.1 2.221 2.75 1.1
1.2 2.615 3 1.2
1.3 2.9 3.25 1.3
1.4 3.11 3.5 1.4
1.5 3.39 3.75 1.5
1.6 3.48 4 1.6
1.7 3.685 4.25 1.7
1.8 3.854 4.5 1.8
1.9 3.8785 4.75 1.9
2 4.102 5 2
Beta = 0.6, t = 25 oC, ρ = 1000 Kg/m3 Actual
flowrate in 10-3 m3/s
Actual flowrate in
10-3 m3/s
Actual flowrate
in 10-3 m3/s
Actual flowrate
in 10-3 m3/s
0.1 0.1 0.249985 0.1
0.2 0.195 0.5 0.2
0.3 0.298 0.75 0.3
0.4 0.354 1 0.4
0.5 0.42 1.25 0.5
0.6 0.578 1.5 0.6
0.7 0.657 1.75 0.7
0.8 0.839 1.998745 0.8
0.9 0.865 2.25 0.9
1 0.975 2.5 1
1.1 1.0015 2.75 1.1
1.2 1.187 3 1.2
1.3 1.41 3.25 1.3
1.4 1.523 3.5 1.4
1.5 1.68 3.7500145 1.5
1.6 1.87 4 1.6
1.7 2.17 4.25 1.7
1.8 2.285 4.5 1.8
1.9 2.4352 4.75 1.9
2 2.548 5 2
REFERENCES
[1] J. E. Lawley, “Orifice meter calibration'', 57th International School of Hydrocarbon Measurement, document ID: 16233, 1982.
[2] Shigeru Yanagiharaa, Osamu Mochizukia, Kyosuke Satoa, Keizo Saitob, “Variable area venturi type exhaust gas flow meter'' , JSAE Review, Science direct, vol 20, No 2 pp 265 - 267, April 1999. [3] Jian Qiu Zhang, Yong Yan, “A self validating differential pressure
flow sensor'', IEEE conference Proceedings on Instrumentation and Measurement Technology, Budapest, May 2001.
[4] Man Gyun Na, Yoon Joon Lee, In Joon Hwang, “A smart software sensor for feedwater flow measurement monitoring'', IEEE transactions on Nuclear Science,vol 52, No 6, pp 3026 - 3034, December 2005.
[5] Lijun Xu, Hui Li, Shaliang Tang, Cheng Tan, Bo Hu, “Wet Gas Metering Using a Venturi-meter and Neural Networks'', IEEE conference Proceedings on Instrumentation and Measurement Technology, Canada, May 2008.
[6] Pereira M, “Flow meters: Part 1'', IEEE Magazine on Instrumentation and Measurement, vol.12, No 1, pp 18 - 26, February 2009.
[7] Pereira J.M.D, Postolache O, Girao P.M.B.S, “PDF-Based Progressive Polynomial Calibration Method for Smart Sensors Linearization'', IEEE transactions on Instrumentation and Measurement, vol.58, No 9, pp 3245 - 3252, September 2009
[8] Heon Young Yang, Sung Han Lee, Man Gyun Na, “Monitoring and Uncertainty Analysis of Feedwater Flow Rate Using Data-Based Modeling Methods'', IEEE transactions on Nuclear Science, vol. 56, No 4, pp 2426 - 2433, August 2009.
[9] Lijun Xu, Shaliang Tang, “Wet gas metering using a Venturi-meter and Support Vector Machines'', IEEE conference Proceedings on Instrumentation and Measurement Technology, Singapore, May 2009. [10] Fang Lide, Cao Suosheng, Li Jinhai; Cheng Hao, “Venturi Wet Gas measurement based on homogenous and chisholm model'', International Conference on Computer and Automation Engineering, Thailand, 2009.
Measurement and Analysis'', 4th Edition, CRC Press, June 2003. [17] Rodrigo J. Plaza, “Sink or Swim: The Effects of Temperature on
Liquid Density and Buoyancy'', California state science fair, 2006. [18] “Density of Fluids - Changing Pressure and Temperature'', The
Engineering toolbox, 2004. [19] Sensorone DMD331 datasheets 2008,
[20] H. Nielsen, R, “Theory of the back propagation neural network'', International Joint Conference on Neural Networks, USA, 1989. [21] S. Haykin, “Neural Networks: a comprehensive foundation'', 2nd
Edition, Prentice Hall India Press, 2001.