106
©IJRASET: All Rights are Reserved
Development of Multi Modal System for Extraction
of SpO2 from Photoplethysmographic Waveforms
Shahrukh Sheikh1, Muzaffar Khan2
1
Anjuman college of Engineering, Nagpur, Maharashtra, India
Abstract: The Non-invasive remote physiological monitoring of soldiers on the battlefield has the potential to provide fast, accurate status assessments that are key to improving the survivability from critical injuries. The development of WPI’s wearable wireless pulse oximeter, designed for field-based applications, allowed for the optimization of important hardware features such as physical size and power management. However, software-based digital signal processing (DSP) methods are also required to perform physiological assessments. This research evaluated DSP methods that were capable of providing arterial oxygen saturation (SpO2) measurements derived from data acquired using a single optical sensor. In vivo experiments were conducted to evaluate the accuracies of the processing methods across ranges of physiological conditions
Keywords: Arterial oxygen saturation, Photoplethysmographic, digital signal processing.
I. INTRODUCTION
It is critical to promptly acquire proper diagnosis and effective treatment in order to optimize a patient’s chance of survival. In most situations, however, timely and efficient medical care is not available. such, telemedicine applications have long been at the forefront of military research in an effort to improve the medical care received by casualties on the frontline. In recent years, the military has been working on a Warfighter Physiological Status Monitor (WPSM) that will allow combat medics to monitor the physiological status of their soldiers, thereby potentially reducing medical response times and improving remote triage capabilities. A popular method of patient monitoring is pulse oximetry, due to its non-invasive nature. An additional benefit of this modality is the extensive amount of physiological information available through its use. While arterial oxygen saturation (SpO2) measure typically provided by pulse oximeters. However, despite advances in the hardware optimization, the digital signal processing (DSP) methods required to perform such physiological measurements must still be developed for custom-designed devices.
In order to facilitate the development of a wearable medical monitoring system, the research performed here covered the first step in producing a software package capable of performing multiple physiological measurements based on pulse oximetry sensor data. Specifically, SpO2 measurements were examined since they were known to provide critical patient information during medical diagnoses. This Paper begins by discussing the needs of field medics and the potential impact of implementing a wearable monitoring system which is used in field-based applications. Current and developing technologies in this research area are covered first, followed by an examination of the fundamental techniques for extracting physiological measurements from photoplethysmographic (PPG) waveforms.
II. RESEARCH OBJECTIVES
While steady progress has been made in the development of an optimized the hardware structure for a wearable pulse oximeter, limitations in commercially available software solutions still exist. The processing software employed by manufacturers to perform physiological measurements can be expensive, proprietary, and does not provide all the measurement features desired in a wearable pulse oximeter. As a result, the newly-developed hardware platform designed at WPI requires custom-developed software routines to perform physiological measurements based on sensor data. Therefore, the goal of this research was the development of a library of software-based processing methods that could be employed to advance the development of the WPI wearable pulse oximeter that is being designed for military and mass casualty applications. The specific research objective were to.
1) Objective: Evaluate and characterize a set of software-based processing methods capable of measuring SpO2 based on a set of PPG signals.
III. THE PHOTOPLETHYSMOGRAPHIC SIGNAL
107
©IJRASET: All Rights are Reserved
way of obtaining these waveforms through non-invasive means. Such optical sensors consist of a light source, typically a light-emitting diode (LED), and a photodetector (PD) element. The light source is used to illuminate a region of tissue and the PD measures the amount of light exiting the tissue at a different location.
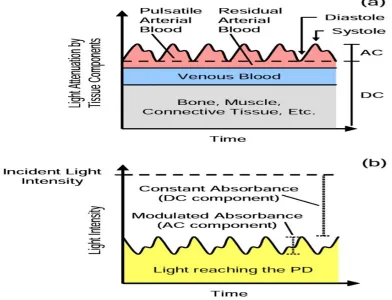
[image:2.612.109.501.241.541.2]Most illuminated constituents, such as bone, muscle, venous blood, and various other cellular structures, absorb a constant amount of light, since their volumes and densities do not change over short periods of time. The volume of the arterial blood, however, is modulated by the beating of the heart. Each time the heart contracts, an additional bolus of blood is forced through the arterial pathways. With this variation in arterial volume comes a proportional variation in light absorption that can be measured by an optical sensor. An increase in arterial blood volume causes a corresponding decrease in the amount of light that reaches the PD. The amount of light absorbed by the tissues contains two significant aspects, as shown in Figure. The first is the constant absorbance, or DC component, influenced by the nonvascular tissues and residual arterial and venous blood volumes. The second is a modulated absorbance, or AC component, caused by the variations in arterial blood volume. Together, they affect the amount of light that illuminates the PD to produce a pulsatile waveform, as shown in Figure.
Figure 3.1. Graphical representations of (a) the light absorbance of tissue components and (b) the resulting light intensity illuminating the PD
IV. THEORY OF SPO2 MEASUREMENT
Injuries sustained in a combat environment often directly affect a soldier’s cardiac and pulmonary systems, many times causing blood loss, hemothorax, pneumothorax, and other dangerous conditions. Such conditions can lead to hypoxemia, depriving vital organs of oxygen and endangering the casualty’s life. SpO2 measurements are routinely employed to detect these hypoxic events before irreversible damage is caused to tissues and organs.
A. Hemoglobin Light Attenuation:
108
©IJRASET: All Rights are Reserved
600 and 805 nm, while HbO2 has a slightly higher absorption profile between 805 and 1000 nm. Wavelengths in the red (R) and infrared (IR) regions around 660 and 900 nm are typically used in most pulse oximetry applications.
Blood with a low amount of oxygen contains an increased level of Hb and a decreased level of HbO2. As a result, the blood absorbs more light at R wavelengths and less light at IR wavelengths. Conversely, blood with a high amount of oxygen contains a reduced level of Hb and an increased level of HbO2. The blood then absorbs less light at R wavelengths and more light at IR wavelengths. These wavelength-based absorption characteristics make it possible to measure changes in SaO2 using optical means.
B. Measurement Derivation
The ratio of R-to-IR light (R/IR) absorbed by arterial blood changes with SaO2 in an inversely proportional manner, as shown in Figure. As such, Equation 4.1 can be used to approximate this relationship and to calculate SpO2:
SpO2= A –B •(R/RI)……. 4.1
where (R/IR) is the ratio of R and IR light absorbed by the arterial blood, A and B are calibration coefficients, and SpO2 is the estimate of SaO2.
Equation depicts the equivalent mathematical function: R=(R/IR)=(ACr/DCr)/(ACir/DCir)……. 4.2
where ACR is the AC amplitude of the R signal, DCR is the DC offset of the R signal, ACIR is the AC amplitude of the IR signal, DCIR is the DC offset of the IR signal, and R is the resulting “ratio-of-ratios”. Combining Equations 4.1 and 4.2 results in Equation 4.3, which estimates SaO2 based on normalized R and IR PPG signals.
SpO2= A –B •R ………..4.3
where R is defined by Equation 4.2, A and B are coefficients derived through empirical calibration, and SpO2 is the resulting estimate of SaO2.
It should be noted that the relationship between R and SpO2 is not perfectly linear. Howerver, most clinical work does not require measurements over the full range of SaO2.
C. SpO2 Calculation
Analysis of PPG signals to determine SpO2 involved two initial steps: measurement of the DC and AC components. Once these values were obtained from both the R and IR PPGs, the ratio R was calculated using Equation 4.2. The instantaneous R values produced by a given processing method were plotted against corresponding instantaneous reference SpO2 values obtained from the Nonin Xpod®. The linear regression equation derived from the comparison was used to convert the R values to SpO2 values, providing the final measurements for the processing method.
V. SPO2 EXPERIMENTS
R and IR PPG data, as well as reference SpO2 measurements, were required to assess the accuracy of the SpO2 processing methods. A series of in vivo experiments were performed to obtain data over a range of SpO2 values typically monitored for clinical purposes.
A. Experimental Setup
109
©IJRASET: All Rights are Reserved
Figur5.1. Experimental setup to acquire SpO2 data.
B. In Vivo Experiments
Data were acquired from 3 healthy male volunteers, ages 24 – 25. During data recording, subjects were seated comfortably in a chair with their arms resting on the armrests. To assess the relationship between reference SpO2 values and measured SpO2 values, each subject was instructed to perform a breath-holding maneuver to induce a noticeable drop in SpO2. A 20 second baseline reading was recorded while each subject was breathing spontaneously. Following the baseline recording, each subject was instructed to hyperventilate for about 15 seconds, and then hold his breath for as long as possible to induce hypoxemia. Following the breath-holding period, each subject resumed spontaneous breathing for 20 seconds to allow the SpO2 readings to return to normal. SpO2 values were monitored during each pause in breathing to ensure that a drop in the oxygen level was noticeable. If a significant drop in SpO2 was not induced, the data were discarded and the experiment was repeated. A total of three successful data sets were recorded.
VI. DC MEASUREMENTS
Three different processing methods were employed to measure the DC components of PPG signals. The baselines and average offsets of the signals could both be used to estimate these DC values and were used to normalize the AC measurements obtained through other methods.
The first method was a moving average. A 3-second window of the most recent PPG samples was averaged to produce a DC value. This calculation was performed as required by the AC processing methods.
The second method used a LPF to track the DC level of a PPG. The chosen filter was an IIR Butterworth which allowed for a reduced number of coefficients compared to FIR filters and a smooth passband with no significant ripple. A cutoff of 0.1 Hz was used to remove the high-frequency pulsatile component generated by cardiac activity. A 5th order filter was required to maintain stability.
The third processing method followed the baseline of the PPG. The minimum value in a 3-second window of the most recent PPG samples was used as a DC value. This calculation was performed as required by the AC processing methods.
A. AC Measurements
Two different processing methods were employed to measure the pulsatile amplitudes of the R and IR PPGs. Once measured, the AC values were normalized using the results obtained from the above DC measurements. The normalized AC measurements were used to calculate R values which were converted to SpO2 values based on the empirical relationship between R and SpO2.
110
[image:5.612.98.528.74.682.2]©IJRASET: All Rights are Reserved
111
[image:6.612.136.495.86.674.2]©IJRASET: All Rights are Reserved
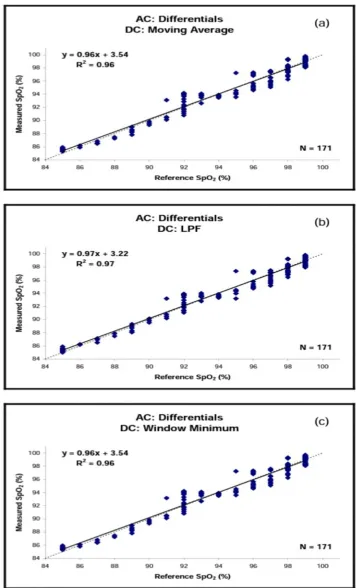
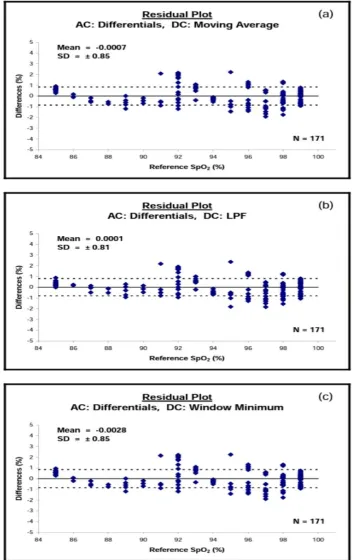
Figure 6.2. SpO2 measurements based on PPG differentials normalized using (a) a moving average, (b) LPF, and (c) window
112
[image:7.612.133.487.95.655.2]©IJRASET: All Rights are Reserved
113
[image:8.612.92.538.361.720.2]©IJRASET: All Rights are Reserved
Table 6.4. Assessment results for SpO2 processing methods.
VII. SPO2 ASSESSMENT
A. Measurement Response Times
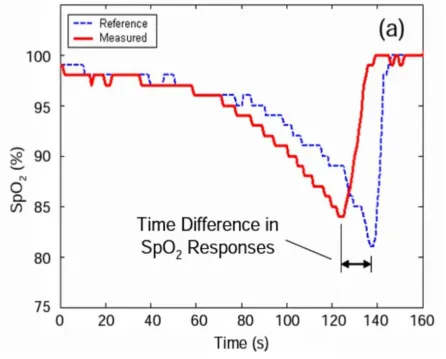
During assessment of the SpO2 processing methods, a difference in the response times was noted when comparing the SpO2 values provided by the processing methods to those obtained from the reference oximeter. As shown in Figure a, comparable drops in SpO2 were registered between 5 and 20 seconds apart by the reference source and all the processing methods. This shift was attributed to two factors: differences in sensor locations and differences in processing technique.
114
[image:9.612.86.538.74.418.2]©IJRASET: All Rights are Reserved
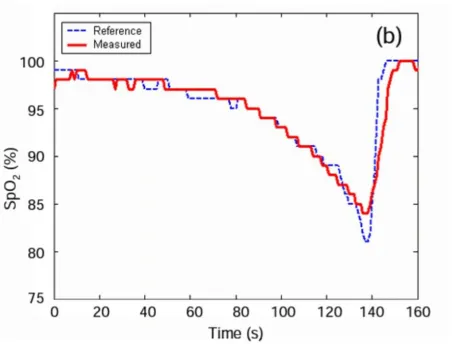
Figure 7.1. Measured and reference SpO2 values (a) as they are normally obtained in relation to each other and (b) after aligning the drops in SpO2.
VIII. CONCLUSIONS
Acquiring accurate physiological measurements from patients is vital to providing effective triage and medical care in the field. As a result, the proper selection of a set of accurate processing methods is paramount in the development of a wearable medical device designed for field-based applications. This research evaluated different processing methods as a means of performing multiple physiological measurements based on a single set of photoplethysmograms acquired by a non-invasive wearable pulse oximeter. Arterial oxygen saturation were assessed in this research since these measurements provide vital physiological information to caregivers during medical evaluations. A series of in vivo experiments were conducted to record photoplethysmographic waveforms and corresponding reference values measure. The data were then used to characterize the accuracies of the processing methods evaluate during the study.
Since a number of resulting data trends between sets of measured and reference values did not always appear to be linear, alternative regression equations were applied to the data sets to determine what form of equation best estimated the data’s relationship.
Although the miniaturized wearable pulse oximeter developed in our lab has been optimized for physical size and power, further evaluations must be conducted to understand the limitations of each signal processing method in terms of suitability for implementation in a microcontroller environment.
REFERENCES
[1] C. J. Obusek, "Warfighter Physiological Status Monitoing (WPSM)," in The Warrior, 2001, pp. 6 - 8.
[2] G. S. F. Ling, B. K. Day, P. Rhee, and J. M. Ecklund, "In Search of Technological Solutions to Battlefield Management of Combat Casualties," presented at SPIE Conference on Battlefield Biomedical Technologies, 1999.
[3] "Notes from TATRC Off-Site Meeting," Worcester Polytechnic Institute, Worcester, MA Aug. 2003.
[4] S. P. McGrath, E. Grigg, S. Wendelden, G. Blike, M. DeRosa, A. Fiske, and R. Gray, "ARTEMIS: A Vision for Remote Triage and Emergency Management Information Integration," Dartmouth College, Hanover, NH Nov. 2003.
115
©IJRASET: All Rights are Reserved
[6] S. M. Wendelken, S. P. McGrath, and G. T. Blike, "A Medical Assessment Algorithm for Automated Remote Triage," presented at 25th Annual International Conference of the IEEE EMBS, 2003.
[7] S. Wendelken, S. McGrath, G. Blike, and M. Akay, "The Feasibility of Using a Forehead Reflectance Pulse Oximeter for Automated Remote Triage," presented at IEEE 30th Annual Northeast Conference, 2004.
[8] J. W. Lebak, J. Yao, and S. Warren, "Implementation of a Standards-Based Pulse Oximeter on a Wearable, Embedded Platform," presented at EMBC, 2003. [9] J. Yao, R. Schmits, and S. Warren, "A Wearable Standards-Based Point-of-Care System for Home Use," presented at EMBC, 2003.
[10] J. Yao and S. Warren, "Design of a Plug-and-Play Pulse Oximeter," presented at Second Joint EMBS/BMES Conference, 2002.
[11] S. Warren, J. Yao, R. Schmitz, and L. Nagl, "Wearable Telemonitoring Systems Designed with Interoperability in Mind," presented at 25th Annual International Conference of the IEEE EMBS, 2003.
[12] J. Muhlsteff, O. Such, R. Schmidt, M. Perkuhn, H. Reiter, J. Lauter, J. Thijs, G. Musch, and M. Harris, "Wearable Approach for Continuous ECG - and Activity Patient-Monitoring," presented at 26th Annual International Conference of the IEEE EMBS, 2004.
[13] J. Y. Hwang, J. M. Kang, Y. W. Jang, and H. C. Kim, "Development of Novel Algorithm and Real-Time Monitoring Ambulatory System Using Bluetooth [14] Module for Fall Detection in the Elderly," presented at 26th Annual International Conference of the IEEE EMBS, 2004.
[15] A. Tura, M. Badanai, D. Longo, and L. Quareni, "A Medical Wearable Device with Wireless Bluetooth-Based Data Transmission," Measurement Science Review, vol. 3, pp. 1 - 4, 2003.
[16] V. Kremin, "Remote Health-Monitoring System," in Circuit Cellar, 2003, pp. 10 - 17.
[17] M. V. Scanlon, "Acoustic Sensor for Health Status Monitoring," presented at IRIS Acoustic and Seismic Sensing, 1998.
[18] M. V. Scanlon, "Acoustic Sensor Pad for Physiological Monitoring," presented at 19th Annual International Conference of the IEEE EMBS, 1997.
[19] H. H. Asada, P. Shaltis, A. Reisner, S. Rhee, and R. C. Hutchinson, "Mobile Monitoring with Wearable Photoplethysmographic Biosensors," in IEEE Engineering in Medicine and Biology Magazine, 2003, pp. 28 - 39.
[20] N. Aydin, A. Astaras, L. Wang, T. Arslan, A. F. Murray, S. P. Beamont, and D. R. S. Cumming, "Design and Implementation Considerations for an Advanced Wireless Interface in Miniaturized Sensor Microsystems," presented at 25th Annual International Conference of the IEEE EMBS, 2003.
[21] P. Lukowicz, U. Anliker, J. Ward, G. Troster, E. Hirt, and C. Neufelt, "AMON: A Wearable Medical Computer for High Risk Patients," presented at Proceedings of the 6th International Symposium on Wearable Computers, 2002.
[22] U. Anliker, J. A. Ward, P. Lukowicz, G. Troster, F. Dolveck, M. Baer, F. Keita, E. B. Schenker, F. Catarsi, L. Coluccini, A. Belardinelli, D. Shklarski, M. Alon, E. Hirt, R. Schmid, and M. Vuskovic, "AMON: A Wearable Multiparameter Medical Monitoring and Alert System," IEEE Transactions on Information Technology in Biomedicine, vol. 8, pp. 415 - 427, 2004.
[23] "Nonin WristOx 3100," Nonin, 2006.
[24] P. O. Isaacson, D. W. Gadtke, and T. L. Johnson, "Finger Clip Pulse Oximeter." USA: Nonin Medical Inc., 1998. [25] S. P. Athan and J. E. Scharf, "Portable Pulse Oximeter." USA: University of South Florida, 1996.
[26] R. S. Potratz, "Condensed Oximeter System and Method with Noise Reduction Software." USA: Nellcor Puritan Bennett Inc., 1998. S. M. Metev and V. P. Veiko, Laser Assisted Microtechnology, 2nd ed., R. M. Osgood, Jr., Ed. Berlin, Germany: Springer-Verlag, 1998.
[27] J. Breckling, Ed., The Analysis of Directional Time Series: Applications to Wind Speed and Direction, ser. Lecture Notes in Statistics. Berlin, Germany: Springer, 1989, vol. 61.
[28] S. Zhang, C. Zhu, J. K. O. Sin, and P. K. T. Mok, “A novel ultrathin elevated channel low-temperature poly-Si TFT,” IEEE Electron Device Lett., vol. 20, pp. 569–571, Nov. 1999.
[29] M. Wegmuller, J. P. von der Weid, P. Oberson, and N. Gisin, “High resolution fiber distributed measurements with coherent OFDR,” in Proc. ECOC’00, 2000, paper 11.3.4, p. 109.
[30] R. E. Sorace, V. S. Reinhardt, and S. A. Vaughn, “High-speed digital-to-RF converter,” U.S. Patent 5 668 842, Sept. 16, 1997. [31] (2002) The IEEE website. [Online]. Available: http://www.ieee.org/
[32] M. Shell. (2002) IEEEtran homepage on CTAN. [Online]. Available: http://www.ctan.org/tex-archive/macros/latex/contrib/supported/IEEEtran/ [33] FLEXChip Signal Processor (MC68175/D), Motorola, 1996.
[34] “PDCA12-70 data sheet,” Opto Speed SA, Mezzovico, Switzerland.
[35] A. Karnik, “Performance of TCP congestion control with rate feedback: TCP/ABR and rate adaptive TCP/IP,” M. Eng. thesis, Indian Institute of Science, Bangalore, India, Jan. 1999.
[36] J. Padhye, V. Firoiu, and D. Towsley, “A stochastic model of TCP Reno congestion avoidance and control,” Univ. of Massachusetts, Amherst, MA, CMPSCI Tech. Rep. 99-02, 1999.