How Quality Management Can Help in Process
Control: Case Studies from Cyprus
Ioannis Angeli
Abstract- In this big, competitive world that we live in, almost no company can survive without adopting a scientific approach and specific methodologies and Quality tools. A lot has been written around the world about the Quality Improvement tools and process control, their kinds, their purpose of use, the way and place that they are applied, advantages, application difficulties, case studies and other. The success of any application, of any quality tool or application of design tool lies in certain facts that vary from each industry and place, as well as the means that are allocated. However, there are always similarities in parameters, difficulties and methodologies, such as the human factor, education and others.
These common reference points aim to present the current paper based on case studies and applications within Cyprus industries and organisations during the last twenty years from the author. The paper will report which Quality/ process Improvement Tools have been applied, where, witch methodology have been applied, the degree of success and ways for better implementation. The paper will concentrate on those tools which were used in the process control in a variety of organizations. The main purpose of this paper is not to present scientific research work or something new but to present case studies from the island of Cyprus (1.5 million population) from small to medium size organizations (SMES). Companies of this size can benefit from those cases from the practitioners point of view. It is important to report common findings, problems and suggestions that are based on long-term experience from applications of Quality Tools in many organisations. It will also demonstrate the means that have been used, as well as the choices that are available and finally what exists in the market.
Index Terms- : Process control, Quality Management, Quality Tools, Case studies on Quality Tools, Statistical Process Control,
I. INTRODUCTION TO TECHNIQUES AND QUALITY IMPROVEMENT TOOLS (QIT)
These are all the Scientific methods, tools/techniques supporting the decision making by facts and data. These quality assurance techniques for quality improvement tend to be used mainly by technical experts but also by shop floor operators when they have been trained [5, 3]. This is where the philosophies of the so called "Gurus" find their place: "Institute modern methods of training on the job" (Deming), "Employee Education" (Crosby).
Manuscript received 28/12/2010; revised 24/01/2011.Dr Ioannis Angeli is a member of the academic staff of the Department of Mechanical Engineering and Materials Science and Engineering, Cyprus University of Technology, 31, Archbipishop Kyprianos, 3036 Lemesos, Cyprus, Conduct telephone +357 25002324 (E-mail: [email protected]).
With the basic training completed in problem - solving, working as teams with communication skills, most staff and employees are ready to become actively involved in a task force for improvement. It is at this stage that the appropriate training by professionals for that group may be called for. Quality Improvement Tools (QIT) when properly trained and implemented using self directed work teams, enable companies to attain dramatic increases in productivity and product quality. They help people at a particular section or even from diverse areas in the company to work together with greater efficiency and are therefore able to compete more effectively with foreign and domestic rivals, using the facts and data collected.
There are many general skills, tools and techniques for product and service quality improvements which a lot of organizations have adopted throughout the world and can yield tremendous benefits in a very short period of time. They can be easily learned and applied by all levels of staff and by the majority of the shop floor in a company.
Some of the most important tools/techniques and skills for quality improvements are demonstrated very briefly on the next few pages. This part of the paper will help people who are not so well familiar with QIT, to understand just how many techniques exist, their uses, and where they can be applied. With this approach, the second part of the paper, where the applications of some techniques are demonstrated will have greater comprehension.
1. Seven Basic Quality Tools
a. Cause and Effect Diagrams
Also known as the 'fishbone' diagram because of its shape, or the Ishikawa diagram from the originator. It represents the relationship between some `effects' and the possible `causes' influencing it.
b. Flow Charts
These are the first steps of a team, looking for improving a process through a pictorial representation, showing all the steps of a process.
c. Pareto Charts
These are among the most commonly used graphic techniques. These are a sorted vertical bar graphs which help to determine priority actions and distinguish between the important few and unimportant many.
d. Run Charts
Perhaps these are the simplest of the statistical tools. They display observation points over a specified time period.
e. Histograms
They are used to display how frequently something occurs, to present the distribution of data values.
f. Scatter Diagrams
They are diagrams used to study the possible relationship between two variables.
These charts are a group of charts that control and analyse a process. They are charts with chronological order where statistically the upper and lower control limits on both sides are calculated as well as the average of the activity. These are XbarR, MXMR, XMR, p, np, C, U.
2. Techniques used during the stage of design
Quality Function Deployment (QFD)
QFD was developed in Japan by Toyota in the late 70's. Since then its use is growing rapidly and simultaneously achieving a competitive advantage in quality, cost and timing. "QFD is the most powerful approach to product/process design which employs a collection of tools to highlight where engineering effort should be expected and just as importantly, where not to invest time and money. In many respects it has parallels with FMEA (i.e identify elements- sources of problems, relative severity of problem add up points score and focus on priorities) in its ability to help determine where quality technology and engineering effort (e.g. Taguchi methods) should be applied." [5].
The technique is not limited to products only: the concept is equally applicable to the strategic running of a business. It is a formal mechanism for assuring that the "voice of the customer" is heard throughout development. It is also ensuring that customers’ requirements are achieved by all functional activities of a company. QFD is also known by the terms customer Driven Engineering and Matrix Product Planning. . The whole definition is based in a line or successive processes with basic tools of the house of quality that is a series of matrices where in the vertical axis the customer needs are recorded and rated called “Whats”, and in the horizontal axis the way that these customers needs can be accomplished by the company “Hows”.
- Failure Mode and Effect Analysis (FMEA)
According to BS 4778 the definition of FMEA is the "study of the potential failures that might occur in any part of a system, to determine the probable effect of each on all the other parts of the system and a probable operational success, the results of which are ranked in order of seriousness."
FMEA was first developed over 30 years ago and it was adopted by the Aerospace [2] industry during the 1960s.The technique can be applied to both the design and to the manufacture of components for processes and systems improvements [5].
- Taguchi Methods – Design of Experiments (DOE) Taguchi is an off-line quality engineering approach which complements on-line quality control systems such as SPC. The methodology encompasses a range of techniques for experimental design, which are applicable to most areas of product design and manufacture.
“It is the next level after the application of FMEA procedures when a particular process element requires a more in depth attack. A Taquchi experiment minimizes the number of experiments required to each variable when searching for the OPTIMUM combination. It does not require multiple EXPERIMENTS however, in which variable change and performance change are tabulated." [5]. The Taquchi methods are not only contributing to the design of experiments but also to the interpretation of Loss "The quality of a product is the (minimum) Loss imported
by the product to the society from the time the product is shipped".
3. Process Control Techniques
- Statistical Process Control (SPC)
Statistical Process Control has been available for many years, (Shewhart 1920's) and has been adopted by large manufacturing companies. However, it also has a major role to play in service companies. "SPC is a method which gives confidence that components produced are within tolerance, without having to measure every component. It is associated with the theme of controlling the process NOT the product and is a form of feed forward Control" [5].
Most quality improvement activities begin by establishing process control and then continuously improving the operating limits. However a more structured approach would start with QFD as a way of establishing the requirements, followed by process capability studies, Taguchi experiments, and finally SPC would be established on key process characteristics.
There are two fundamental ways of controlling the quality of the product. They are;
i. Action on the output (100% final inspection) ii. Action on the process (process performance and output).
Some basic tools of SPC is the average and range control chart, for variables and attribute data and p, np, c, u charts, machine capability etc. Resent developments of charts include moving average, moving range and short run SPC.
- Poke Yoke
"The provision of effective quality assurance to prevent defective products being produced is essential if complete JIT manufacture is to be realized. In order to provide this, the emphasis on quality should be moved from inspecting to prevent defects being dispatched to the customer, to preventing the manufacture of any defective products"[5].
This practice is widely used in Japan where the word used is "poka yoke" meaning fool proofing. It involves designing orientation conscious parts such as marks, signs, slots, sockets, key ways, for example, so that they can only be assembled in the correct manner and with limited amount of knowledge [2]
- Just In Time (JIT)
Just in time is an operating philosophy where its basic objectives are the elimination of waste. This is a continuing and perpetual focus. JIT is a technique based on simplicity and managers will have to be prepared to get rid of complex and often outdated ways of doing things. "This methodology allows an organization to improve competitiveness in business via improved product quality, reliability of delivery and reduced product costs. All of these can be achieved with positive cash flow due to the release of capital allowed by the reduction in stock levels"[5].
- The Kanban System
western systems, including Materials Requirement Planning (MRP), which push work through" [5].
4. Leadership and Management Techniques
- Departmental Purpose Analysis (DPA)
Departmental quality can be defined as how well a department as a whole meets its own and the outside world's bottom line and `beyond bottom line' demands and expectations [7]. Department Purpose Analysis (DPA) is a tool which assists departments to;
a) Align their objectives with the overall company mission. b) Clarify customer and supplier relationships. c) Establish measures of performance. [5]
- Quality Circles (QC's)
Quality Circles, also known as Quality Groups, are small teams which are formed voluntarily from people who are employed in similar jobs, they are gathered together in regular meetings lasting 30 to 45 minutes each, to identify and solve problems which are related to their nature of work (usually quality). [4].
- Zero Defects Policy (ZD)
The doctrine of Zero Defect which is not a quality tool but is a well structured approach, was first developed by Philip Crosby 50 years ago. This was a concept whose time had come, but it took 20 years before people realized it [1]. The idea is Zero Defects. Any company which is prepared to accept a rate of defects in its products of 5% or even 1% is not going to survive in today's market. The only acceptable level of defects is zero.
- Skills Levelling
"Skills Levelling is an approach to servicing Total Quality Organisation (TQO) with simpler employment arrangements which are organised in relation to changing tasks and not fixed jobs, are resourced by people able to express the full range of their personal skills in relation to tasks and have a fair reward structure in which the dominant factors are the level at personal skills and performance". [5]
- Management By Walking Around (MBWA)
This is a technique used by managers for communication with internal customers, external customers and their suppliers. Tom Peters suggests that 75% of managers’ time should be spent on wondering-walking around to express his interest in people and to `naive' listening. Through this leadership and constant innovation the managers should listen and protect the views and ideas of their employees, teach them through questions and take care of his people, ideas, views etc.
- Quality Management Systems (QMS) ISO 9001
The ISO 9001:2008 standard is the international standard, which specifies requirements for a QMS and aims to establish an effective system for organizing and operating a business. QMS is a tool by which an organisation directs and controls those business activities which are associated with quality. Broadly, it includes its organisational structure together with the planning, processes, recourses and documentation that the company uses in order to achieve quality objectives and to provide improvements of its products and services in line with customer expectations.
- Total Quality Management (ΤQM)
"Total Quality Management" is a genetic term for the modern approach to quality. Several attempts to define
TQM have lead to many wondering conversations. Therefore, some definitions of TQM are given below: The biggest aim is the continuous satisfaction of the customers' needs with the least of costs, by cultivating everyone's commitment to the organisation (customers, suppliers, employees).
"TQM is a cooperative form at doing business that relies on the talents and capabilities of both labor and management to continually improve quality and productivity using teams or "TQM is achieving total quality by involving everyone including suppliers and customers and everything in the organisation".
Total Quality is one in many cultures which may be exhibited by a business enterprise without specific instructions; this culture determines the way in which staff carry out their work. Most company cultures have arisen over years. Changes for the worse can be achieved overnight changes for the better can take years [6]. Total Quality is the company culture that allows you to provide quality goods and services at the lowest possible cost. TQM is to achieve Total Quality by harnessing everyone's commitments. A Total Quality Management organisation is are which is totally committed to quality: These are three factors that dictate how a TQM organisation functions and how that organisation is perceived. I) Culture, structure, systems (Lucas), or ii)People, Policy & strategy, Resources (EFQM) or iii) people, systems, tools .
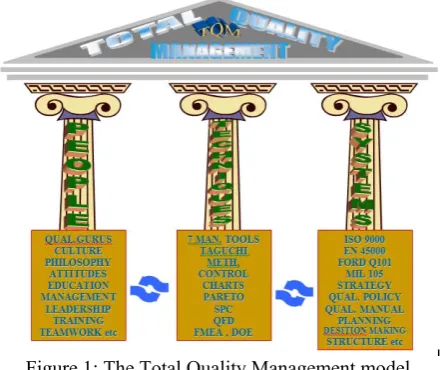
TQM is a way of life, culture, a philosophy and meaning. It is a journey of continuous improvement and not a destination. There are three elements/parameters that show the way that an organisation works and from where its support systems derive. People, the tools and the systems
[image:3.595.318.540.507.692.2]Fiqure 1 shows the TQM model, which has been created by the author, as a building of perfection that is supported by 3 columns, where their foundations lies on various basic elements. If one of the three elements (pylons) ceases to exist, then the whole building collapses. Everything should co-exist together for an organisation to survive and be successful.
Figure 1: The Total Quality Management model
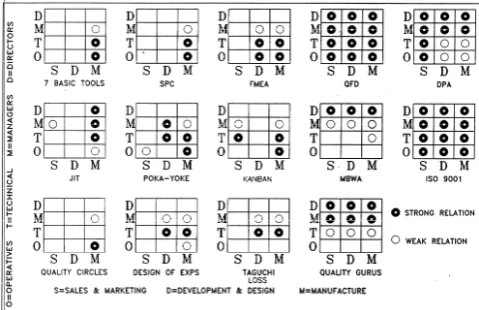
5. Quality Tools and techniques summary in a matrix form
USER (vertical axis) and the AREA/SECTION (Horizontal axis). The user axis is divided into four levels of people existing in a typical company (Director, Managers, Technical and Operatives). The area axis is split into the three sections of a company (Sales & Marketing, Development & Design and Manufacture). By drawing vertical and horizontal lines, starting from a particular point in the square boxes of a matrix, the reader can identify for whom and in which area a particular tool is applicable. The strong or weak relation between the user and the area is specified by the marks donut and circle respectively. With this methodology three answers are demonstrated at the same time: Which tool, In what area and By whom.
Figure 2: Application range of the quality tools in Manufacturing industries
II. TOOLS AND TECHNIQUE IMPLEMENTATION IN CYPRUS
In the next pages, the tools and techniques that the author had personal involvement with, will be mentioned, as well as experiences during the last twenty years (1990-2010). The personal experiences, problems, benefits and common points are mentioned from the applications of some of Quality Improvement Tools (QIT). This does not mean that there were no other QIT applications from other practitioners, perhaps with different experiences. Greater concentration will be given to tools related to process control which is closer to the theme of the conference.
The main activities and application areas for QIT are mentioned below, then, individually is analysed:
1. Education - Training
2. Quality Function Deployment (QFD)
3. Design of experiments or Taguchi experiments (DOE)
4. Statistical process control and PC's (SPC)
1. Education and Training
Definitely, before the application of any tool, a suitable explanation and training is necessary, to those persons involved and also to those who may be involved in future stages. This training in Cyprus can happen with general educational seminars, with short training programs (many of industries together) or in house training, where the training is more advantageous because it is tailored in the special needs, or nature of the company. All training courses are subsidised by the Industrial Training Authority of Cyprus which is beneficial to the companies because due to the reduced incurred by them.
2. Quality Function Deployment (QFD)
The important and advance technique of QFD has been applied in 6 cases in the services sector, in spite of the fact that the technique began and is being used in the manufacturing industry. It was used by the author in his PhD, where he used a Matrix with 72 Whats and 165 Hows investigating how CEO culture will change towards quality.
The second case is the one in the banking industry, where the customers' needs were investigated (17 Whats) and 52 Hows were identified demonstrating how the customer requirements can be fulfilled by the management. The study covered the 4 biggest banks in Cyprus. A comparison between them was also made giving excellent information to bank officials.
The third case was within the hotel sector, where it covered the customers’ needs during their stay at Hotels in Cyprus and how those needs can be fulfilled by the hotel management. The three QFD or houses of quality are shown in the slide shows attached to this paper.
The forth case was applied at the most important department of one of the biggest banks in Cyprus, Information Technology. In a single day a meeting participated by the managers of the eight departments of the bank, the internal customer requirements and the “Whats” were identified. This was followed by a departmental meeting of IT personnel to identify how these requirements could be accomplished by bank employees.
The last two research activities within which the author participated was the application of QFD in the identification of how the 8 criteria and 25 sub-criteria of the Common Assessment Framework (CAF) of the European Union can be implemented. The second investigated through a national survey the students requirements when they are attending any Cyprus university and how these requirements can be accomplish by the university officials. The research was completed four months ago.
3. Taguchi DOE Experiments
Although the Taguchi design of experiments is considered as an advance technique prior to the production, it slowly started being applied in Cyprus on a trial basis and lately in real experiments. In total, there were three experiments in Cyprus, one in 1995, in the largest pumps industry where the main purpose was to improve the surface finish of the pumps. In total seven parameters in CNC turning were examined on two levels, therefore a L8(2)7 array was used. The surface finish of the pump shafts denoted with Ra was improved by approximately 300%.
The second, similar experiment took place in 1999 in order to improve the surface finish in cylindrical surfaces in a grinding machine. Three parameters were investigated in 3 levels (settings), with one investigation of interaction. The L9(4)3 was used, resulting in an improvement of approximately 250% the surface finish process.
The Taguchi experiments are techniques that need skills, too much attention when selecting the parameters and designing the experiments. In many cases, there are additional reasons, or noise factors as it is called that affect the proceedings, but it is too difficult to find and measure them. There is always initial need for discussion, training and the formulation of the working team and during the experiments there is need for large co-ordination, communication and monitoring the process, because there is a possibility of production of non conforming products that should be identified as soon as possible from the personnel in order to stop the particular experiment and change the parameters.
4. Statistical Process Control SPC
This tool is considered as one of the most important Quality Control Tool during the production process. There is definitely a need for training all the staff, its application is easy and it brings fast results (3-6 months). The way that it was applied in Cyprus began with the expression of interest by the company. After the training, the trainer or consultant implements the tools for a period (always the consultant stayed with them at the first stages of implementation to resolve any problems or answer any questions). This was very much appreciated by the company management. The need for SPC came up mainly from the ISO 9001 certification predominantly from paragraph 8 of the ISO 9001 standard, Analysis, Measurement and improvement, where a statistical approach is a necessity.
The training always addressed management, as they would be responsible for the future training of the operators. They were trained in the traditional way, with calculations and charts by hand, and then they were trained to use computers with special SPC software. In that case all
[image:5.595.311.546.187.438.2]data was entered and analysed by the computer. There is however a third stage where the data was automatically entered into the computer through digital data acquisition devises and interfaces/translators (gage interfaces). The selection of the most appropriate solution depends on the data, the type of the company and the money they were willing to invest. Figure 3 shows the solutions that can be used mainly in the manufacturing organisation. Many other examples and gages can be seen in the presentation slides.
Figure 3. Different methods of fully computerised SPC implementation
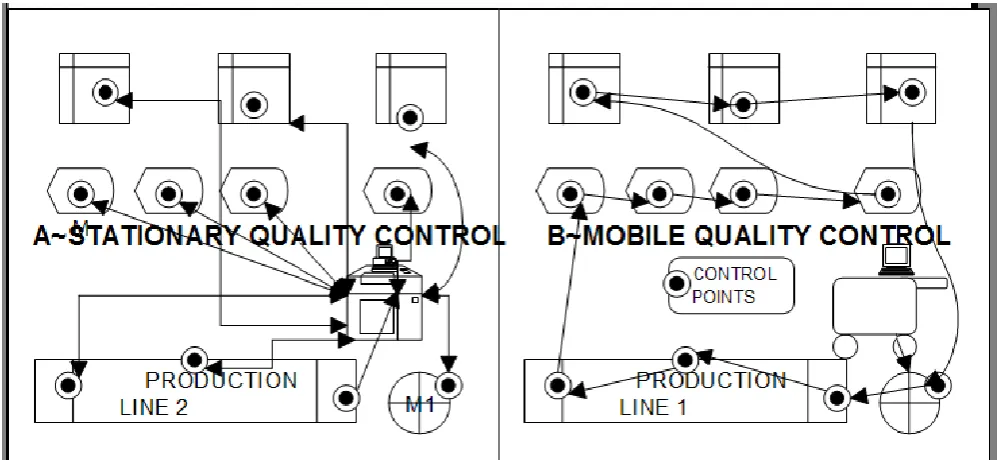
From the author’s experience in many applications with the Cypriot industries, especially the big manufacturers, mass production companies with many
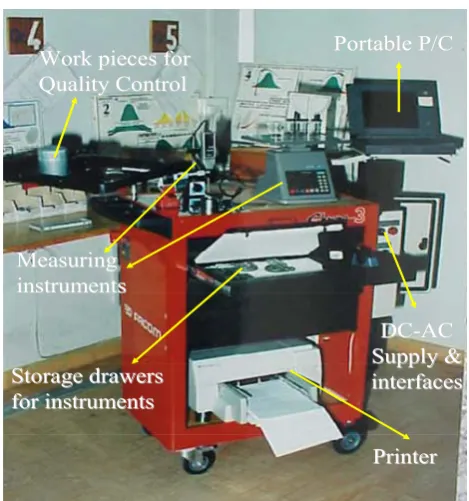
[image:5.595.52.290.548.708.2]activities and lots of checking points, showed that the traditional way of product sampling and control in a stationary workshop or control unit created many problems (loss of time, a lot of routes, inconvenient data analysis, mixing of specimens or samples etc). To deal with this, a team managed by the author developed a model mobile quality control unit. It is constituted by a trolley; see Figure 4, (below), a portable computer, the measuring instruments linked through translators to the computer, space for the placement of the work pieces/ samples, drawers to keep the instruments and a printer.
Figure 4. Mobile quality control unit
Referring to Figure 5, in case A, there is a stationary checking point, whereas case B, shows the route that the mobile control unit will follow in one factory with all the advantages. The unit was used with great success, in controlling the process thought sampling of products during production.
The applications are too many and the experiences that were gained are even more. The presentation of all the cases are beyond the scope of this paper as each one has its specifications. In the next few paragraphs some examples will be given from each application. An attempt is made to present different indicators, control charts from different companies or tools that represent a variety of companies.
Statistical Process Control (SPC) Applications
In two dairy-industries mainly in the chemistry lab. One of them works with complete automated processing. The SPC was used to tabulate all chemical analysis of milk products.
Vassiliko Cement. Completely automated processing in most departments especially in tests and analysis required by the European Union for CE marking
Two 4-star hotels with complete automated processing in all departments. All SPC tools were used. Mainly control charts were used to monitor customer complains, customer satisfaction questionnaires, all hotel consumptions (water, power, gas, etc), room problems, maintenance requests, food analysis etc.
S
SPPCCwwiitthh c
coommppuutteerrss
Portable P/C Portable P/C
DC DC--AC AC Supply & Supply & interfaces interfaces
Printer Printer Storage drawers
Storage drawers for instruments for instruments
Measuring Measuring instruments instruments
Work pieces for Work pieces for Quality Control Quality Control
Portable P/C Portable P/C
DC DC--AC AC Supply & Supply & interfaces interfaces
Printer Printer Storage drawers
Storage drawers for instruments for instruments
Measuring Measuring instruments instruments
Figure 5: Ways of doing Quality Control in a typical manufacturing organisation.
In Laiki Cyprialife, a Life insurance company, a fully automated processing took place in issuing insurance policies and in maintaining customer portfolios’. Control charts were used to monitor insurance contracts and payments.
In Laiki Insurance, a car insurance company, property insurance, etc. It has been applied only in a few departments. Similarly with Cyprialife all accidents, payments, claims were monitor by SPC control charts. In a factory that manufactures crisps, it was fully applied in all the chemical analyses and kept in electronic form. The SPC control charts and capabilities analysis (machine, operators, process) were monitored on a daily basis as required by the multinational company PepsiCo. In flour mills, it had been applied in the chemistry lab and analyses. All chemical analysis were monitored as well as production rates, non conforming products etc.
It has been applied in a higher educational institution to analyse the historic data of the students' grades, for a specific period of time. Historically data had been input into specialized SPC software, so many conclusions were extracted for the future behavior of the students.
Completely computerised application at the Electricity Authority of Cyprus (EAC) in all the districts for monitoring more than 60 performance indicators. Many decisions were made through the SPC control charts related with the behavior of the customers coming to pay their bills or applying for other services. After careful study of the mean values and the systems behavior, the Cyprus electricity Authority was the first European power production company who issued the “map of the customer”. In that document, customers were informed about the minimum and maximum time the requested service will need to be completed. In a similar project the data from a ten year period of the largest power station of Cyprus were converted into control charts so EAC could now predict how Cypriot consumption will behave in different months and seasons.
Completely computerised applications in two power stations of the Electricity Authority of Cyprus. Historic data were inputted into a specialized SPC software
so, many conclusions were extracted for the future behavior of their systems.
A major project was initiated in a factory that manufactures and fills tins and spray. All production rates, non conforming products, mechanical tests and properties are now monitored through control charts.
At Marfin Laiki Group, four years ago SPC was implemented, in certain bank branches in order to improve the customers’ waiting and service time. Waiting and service time was measured through 100% inspection for one month in the largest bank branches. Control charts gave the necessary information. Using queuing theories, statistical models about the customers behavior were also developed describing the arrival rates of the customers. The results were amazing as they able to provide the Bank’s management very reliable information so they can make decisions and propose new strategies based on the information collected.
A supermarket located in a tourist area utilized SPC tools and control charts to identify fast moving items, profit per item, number of sales per item, profit per item per square meter and many other parameters. The tools were later used to develop a strategy according to which products will be concentrated in accordance to profit and sales. Space (in m2) was allocated to special items and key profit parameters or factors were identified.
In all the above cases statistical quality control and SPC software were used. In some cases fully computerized systems for data acquisition and analysis were used. Some of them are shown in the Figure 5 and many others in the power point presentation attached with this paper.
III. FINDINGS - EPILOGUE
Below the main findings are presented to help those who decide to follow the same route.
The overwhelming majority of the companies requested the training and application of SPC were, after certification with ISO 9001 (mainly the new edition). They desperately looked for other ways of data recording and analysis, to change the bureaucratic ways that they used to follow. All those that participatedand appliedSPC, receive in
unless they were imposed on to do so from multinational companies.
In the application stages, the average staff had the biggest resistance (supervisors, inspectors, production officers). The lower staff is always willing to work with others, when they were told what needed to be done. The programs that were successful were the ones that management were most committed, involved and provided the necessary means, such as time for conferences, charts, software, measurement instruments, application officer etc. A common finding for everyone is that, now they know what they are doing, what might happen, they have statistical data that they did not had before, and most of all, they can predict the production behaviour.
The correct selection of statistical software is one of the key success factors for the continuation and indicator follow-up. The software should be provided with simple instructions, easy access and printing. The software that is most successful and easy to use, are those that work well and are easily communicate with well known platforms, such as Excel.
It would be nice for each department or officer to follow his own indicators for fast actions. This was proved to work in very big companies. The experience of the author is that the general management should assign one or two persons from the middle staff, who will take the data from each department, computerise them, make the analyses and print the charts in a appropriate form for each department. Adequate training for the software is essential for successful implementation.
The Cypriot industries will decide to pay an expensive company advisor to apply new methods or experimentation, mainly if have been imposed by the customers or by continuous losses and destabilising tendencies.
To maintain and continue all the above initiatives the trainer or consultant has to stay with them or visit them at regular intervals. This guarantee’s that the employees will follow and continue the work because they feel that they have the support they need or they have somebody to solve their problems. They will feel that somebody “outside” the company is pulling them. The trainer or the consultant has to convince them that he is not always after their money but he wants results and success for the project and the success of the company.
The aim of this proposal was to share the knowledge and experiences of the author that was gained during the last few years from real applications or case studies. The theory for each technique is easy and recorded everywhere, however when we come to application stage, things are not so easy. The proposal presents from the beginning its use, the means that are in use, the options in the market and finally, some common findings from applications given. It is the authors’ belief that this proposal will help those who want to follow the path of continuous improvement, quality and the application of concrete, scientific methods that are multi-applied throughout the world.
I haven't proven anything, nor did I mention any new Quality Improvement Tools, I just demonstrated my personal beliefs, "Experience and Knowledge that is not shared with others is useless". Twenty years of
experience could be useful.
Note: The paper is accompanied by edited transparencies using Power Point software, where representative samples from each case study and techniques are presented. With the use of slides we will help to maximise profits and the objectives of the proposal. During the presentation at the conference, the participants will see only the main slides related with the text. But they will have the opportunity to request all the slides (150) from the author. All information about the author is given on the first page of this paper.
REFERENCES
[1] Crosby Philip, Quality is Free, McGraw Hill, 1979
[2] Davey Andrew, Total Quality Management Post Graduate Diploma, The Polytechnic of Wales 1990, UK
[3] Hundy Brian, A Brief History of Quality, Manufacturing Engineering Magazine, September 1991, UK, p.p 48-52
[4] Inshikawa Kaoru, Guide to Quality Control, Asian Productivity Center, 1976
[5] Lucas Manufacturing Systems Engineering Handbook, Lucas Engineering & Systems, Mini Guide, 1988, UK
[6] Millan R.M., Total Quality, Coopers & Lybrand, UK