Katrin Erk
University of Texas at Austin
Diana McCarthy
∗∗ University of CambridgeNicholas Gaylord
∗ University of Texas at AustinWord sense disambiguation (WSD) is an old and important task in computational linguistics that still remains challenging, to machines as well as to human annotators. Recently there have been several proposals for representing word meaning in context that diverge from the traditional use of a single best sense for each occurrence. They represent word meaning in context through multiple paraphrases, as points in vector space, or as distributions over latent senses. New methods of evaluating and comparing these different representations are needed.
In this paper we propose two novel annotation schemes that characterize word meaning in context in a graded fashion. In WSsim annotation, the applicability of each dictionary sense is rated on an ordinal scale.Usim annotation directly rates the similarity of pairs of usages of the same lemma, again on a scale. We find that the novel annotation schemes show good inter-annotator agreement, as well as a strong correlation with traditional single-sense annotation and with annotation of multiple lexical paraphrases. Annotators make use of the whole ordinal scale, and give very fine-grained judgments that “mix and match” senses for each individual usage. We also find that theUsim ratings obey the triangle inequality, justifying models that treat usage similarity as metric.
There has recently been much work on grouping senses into coarse-grained groups. We demonstrate that gradedWSsim andUsim ratings can be used to analyze existing coarse-grained sense groupings to identify sense groups that may not match intuitions of untrained native speakers. In the course of the comparison, we also show that theWSsim ratings are not subsumed by any static sense grouping.
∗ Linguistics Department. CLA Liberal Arts Building, 305 E. 23rd St. B5100, Austin, TX, USA 78712. E-mail:[email protected], [email protected].
∗∗ Visiting Scholar, Department of Theoretical and Applied Linguistics, University of Cambridge, Sidgwick Avenue, Cambridge, CB3 9DA, UK. E-mail:[email protected].
Submission received: 3 November 2011; revised version received: 30 April 2012; accepted for publication: 25 June 2012.
1. Introduction
Word sense disambiguation (WSD) is a task that has attracted much work in computa-tional linguistics (see Agirre and Edmonds [2007] and Navigli [2009] for an overview), including a series of workshops, SENSEVAL (Kilgarriff and Palmer 2000; Preiss and Yarowsky 2001; Mihalcea and Edmonds 2004) and SemEval (Agirre, M`arquez, and Wicentowski 2007; Erk and Strapparava 2010), which were originally organized expressly as a forum for shared tasks in WSD. In WSD, polysemy is typically modeled through a dictionary, where the senses of a word are understood to be mutually disjoint. The meaning of an occurrence of a word is then characterized through the best-fitting among its dictionary senses.
The assumption of senses that are mutually disjoint and that have clear bound-aries has been drawn into doubt by lexicographers (Kilgarriff 1997; Hanks 2000), lin-guists (Tuggy 1993; Cruse 1995), and psychologists (Kintsch 2007). Hanks (2000) argues that word senses have uses where they clearly fit, and borderline uses where only a few of a sense’s identifying features apply. This notion matches results in psychol-ogy on human concept representation: Mental categories show “fuzzy boundaries,” and category members differ in typicality and degree of membership (Rosch 1975; Rosch and Mervis 1975; Hampton 2007). This raises the question of annotation: Is it possible to collect word meaning annotation that captures degrees to which a sense applies?
Recently, there have been several proposals for modeling word meaning in context that can represent different degrees of similarity to a word sense, as well as different degrees of similarity between occurrences of a word. The SemEval Lexical Substitu-tion task (McCarthy and Navigli 2009) represents each occurrence through multiple weighted paraphrases. Other approaches represent meaning in context through a vector space model (Erk and Pado 2008; Mitchell and Lapata 2008; Thater, F ¨urstenau, and Pinkal 2010) or through a distribution over latent senses (Dinu and Lapata 2010). Again, this raises the question of annotation: Can human annotators give fine-grained judg-ments about degrees of similarity between word occurrences, like these computational models predict?
The question that we explore in this paper is: Can word meaning be described through annotation in the form of graded judgments? We want to know whether an-notators can provide graded meaning annotation in a consistent fashion. Also, we want to know whether annotators will use the whole graded scale, or whether they will fall back on binary ratings of either “identical” or “different.” Our ques-tion, however, is not whether annotators can be trained to do this. Rather, our aim is to describe word meaning as language users perceive it. We want to tap into the annotators’ intuitive notions of word meaning. As a consequence, we use un-trained annotators. We view it as an important aim on its own to capture lan-guage users’ intuitions on word meaning, but it is also instrumental in answering our first question, of whether word meaning can be described through graded annotator judgments: Training annotators in depth on how to distinguish pre-defined hand-crafted senses could influence them to assign those senses in a binary fashion.
retaining all annotator judgments.
The result of this graded annotation can then be used to evaluate computational models of word meaning: either to evaluate graded models of word meaning, or to evaluate traditionalWSD systems in a graded fashion. They can also be used to ana-lyze existing word sense inventories, in particular to identify sense distinctions worth revisiting—we say more on this latter use subsequently.
Our aim is not to improve inter-annotator agreement over traditional sense an-notation. It is highly unlikely that ratings on a scale would ever achieve higher exact agreement than binary annotation. Our aim is also not to maximize exact agreement, as we expect to see individual differences in perceived meaning, and want to capture those differences. Still it is desirable to have an end product of the annotation that is robust against such individual differences. In order to achieve this, we average judgments over multiple annotators after first inspecting pairwise correlations between annotators to ensure that they are all doing their work diligently and with similar outcomes.
Analyzing the annotation results, we find that the annotators make use of inter-mediate points on the graded scale and do not treat the task as inherently binary. We find that there is good inter-annotator agreement, measured as correlation. There is also a highly significant correlation across tasks and with traditional WSDand lexical substitution tasks. This indicates that the annotators performed these tasks in a con-sistent fashion. It also indicates that diverse ways of representing word meaning in context—single best sense, weighted senses, multiple paraphrases, usage similarity— yield similar characterizations. We find that annotators frequently give high scores to more than one sense, in a way that is not remedied by a more coarse-grained sense inventory. In fact, the annotations are often inconsistent with disjoint sense partitions.
The work reported here is based on our earlier work reported in Erk, McCarthy, and Gaylord (2009). The current paper extends the previous work in three ways.
1. We add extensive new annotation to corroborate our findings from the previous, smaller study. In this new, second round of annotation, annotators do the two graded ratings tasks as well as traditional single-sense annotation and annotation with paraphrases (lexical substitutes), all on the same data. Each item is rated by eight annotators in parallel. This setting, with four different types of word meaning annotation on the same data, allows us to compare annotation results across tasks more directly than before.2
2. We test whether the similarity ratings on pairs of usages obey the triangle inequality, and find that they do. This point is interesting for psychological reasons. Tversky and Gati (Tversky 1977; Tversky and Gati 1982) found that similarity ratings on words did not obey the triangle inequality— although, unlike our study, they were dealing with words out of context. The fact that usage similarity ratings obey the triangle inequality is also important for modeling and annotation purposes.
1 We do not use as many raters per item as is usual in psycholinguistics, however, as our aim is to cover a sizeable amount of corpus data.
3. We examine the extent to which our graded annotation accords with two existing coarse-grained sense groupings, and we demonstrate that our graded annotations can be used to double-check on sense groupings and find potentially problematic groupings.
2. Background
In this section, we offer an overview of previous word sense annotation efforts, and then discuss alternative approaches to the annotation and modeling of word meaning.
2.1 Word Sense Annotation
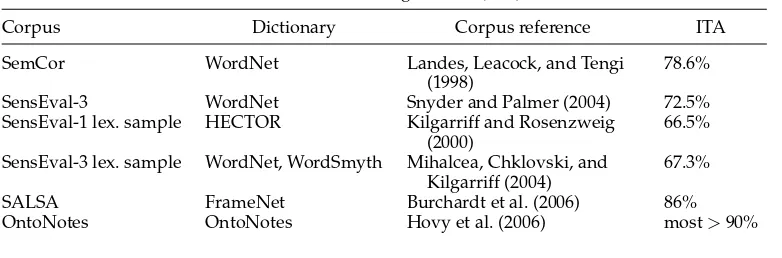
Inter-annotator agreement (also called inter-tagger agreement, or ITA) is one indicator of the difficulty of the task of manually assigning word senses (Krishnamurthy and Nicholls 2000). With WordNet, the sense inventory currently most widely used in word sense annotation, ITA ranges from 67% to 78% (Landes, Leacock, and Tengi 1998; Mihalcea, Chklovski, and Kilgarriff 2004; Snyder and Palmer 2004), depending on factors such as degree of polysemy and inter-relatedness of the senses. This issue is not specific to WordNet. Annotation efforts based on other dictionaries have achieved similar ITA levels, as shown in Table 1. The first group in that table shows two corpora in which all open-class words are annotated for word sense, in both cases using WordNet. The second group consists of two English lexical sample corpora, in which only some target words are annotated. One of them uses WordSmyth senses for verbs and WordNet for all other parts of speech, and the other uses HECTOR, with similar ITA, so the choice of dictionary does not seem to make much difference in this case.3 Next is SALSA, a German corpus using FrameNet frames as senses, then OntoNotes, again an English lexical sample corpus. Inter-annotator agreement is listed in the last column of the table; agreement is in general relatively low for the first four corpora, which use fine-grained sense distinctions, and higher for SALSA and OntoNotes, which have more coarse-grained senses.
Sense granularity has a clear impact upon levels of inter-annotator agreement (Palmer, Dang, and Fellbaum 2007). ITA is substantially improved by using coarser-grained senses, as seen in OntoNotes (Hovy et al. 2006), which uses an ITA of 90% as the criterion for constructing coarse-grained sense distinctions. Although this strategy does improve ITA, it does not eliminate the issues seen with more fine-grained annotation efforts: For some lemmas, such as leave, 90% ITA is not reached even after multiple re-partitionings of the semantic space (Chen and Palmer 2009). This suggests that the meanings of at least some words may not be separable into senses distinct enough for consistent annotation.4Moreover, sense granularity does not appear to be the only question influencing ITA differences between lemmas. Passonneau et al. (2010) found three main factors: sense concreteness, specificity of the context in which the target word occurs, and similarity between senses. It is worth noting that of these factors, only the third can be directly addressed by a change in the dictionary.
3 HECTOR senses are described in richer detail than WordNet senses and the resource is strongly corpus-based. We use WordNet in our work due to its high popularity and free availability. 4 Examples such as this indicate that there is at times a problem with clearly defining consistently
Table 1
Word sense-annotated data, with inter-annotator agreement (ITA).
Corpus Dictionary Corpus reference ITA
SemCor WordNet Landes, Leacock, and Tengi
(1998)
78.6%
SensEval-3 WordNet Snyder and Palmer (2004) 72.5%
SensEval-1 lex. sample HECTOR Kilgarriff and Rosenzweig (2000)
66.5%
SensEval-3 lex. sample WordNet, WordSmyth Mihalcea, Chklovski, and Kilgarriff (2004)
67.3%
SALSA FrameNet Burchardt et al. (2006) 86%
[image:5.486.57.436.277.342.2]OntoNotes OntoNotes Hovy et al. (2006) most>90%
Table 2
Best word sense disambiguation performance in SensEval/SemEval English lexical sample tasks.
Shared task Shared task overview Best precision Baseline
SensEval-1 Kilgarriff and Rosenzweig (2000) 77% 69%
SensEval-2 Senseval-2 (2001) 64% 51%
SensEval-3 Mihalcea, Chklovski, and Kilgarriff (2004) 73% 55%
SemEval-1 Pradhan et al. (2007) 89% (not given)
ITA levels in word sense annotation tasks are mirrored in the performance ofWSD systems trained on the annotated data. Table 2 shows results for the best systems that participated at four English lexical sample tasks. With fine-grained sense inventories, the top-rankingWSDsystems participating in the event achieved precision scores of 73% to 77% (Edmonds and Cotton 2001; Mihalcea, Chklovski, and Kilgarriff 2004). Current state-of-the-art systems have made modest improvements on this; for example, the system described by Zhong and Ng (2010) achieves 65.3% on the English lexical sample atSENSEVAL-2, though the same system obtains 72.6%, just below Mihalcea, Chklovski, and Kilgarriff (2004), on the English lexical sample atSENSEVAL-3. Nevertheless, the pic-ture remains the same with systems getting around three out of four word occurrences correct. Under a coarse-grained approach, system performance improves considerably (Palmer, Dang, and Fellbaum 2007; Pradhan et al. 2007), with the best participating system achieving a precision close to 90%.5 The merits of a coarser-grained approach are still a matter of debate (Stokoe 2005; Ide and Wilks 2006; Navigli, Litkowski, and Hargraves 2007; Brown 2010), however.
Although identifying the proper level of granularity for sense repositories has im-portant implications for improvingWSD, we do not focus on this question here. Rather, we propose novel annotation tasks that allow us to probe the relatedness between dictionary senses in a flexible fashion, and to explore word meaning in context without presupposing hard boundaries between usages. The resulting data sets can be used to compare different inventories, coarse or otherwise. In addition, we hope that they will prove useful for the evaluation of alternative representations of ambiguity in word
meaning (Erk and Pado 2008; Mitchell and Lapata 2008; Reisinger and Mooney 2010; Thater, F ¨urstenau, and Pinkal 2010; Reddy et al. 2011; Van de Cruys, Poibeau, and Korhonen 2011).
2.2 Representation of Word Meaning in Word Sense Inventories
One possible factor contributing to the difficulty of manual and automatic word sense assignment is the design of word sense inventories themselves. As we have seen, such difficulties are encountered across dictionaries, and it has been argued that there are problems with the characterization of word meanings as sets of discrete and mutually exclusive senses (Tuggy 1993; Cruse 1995; Kilgarriff 1997; Hanks 2000; Kintsch 2007).
2.2.1 Criticisms of Enumerative Approaches to Meaning.Dictionaries are practical resources and the nature of the finished product depends upon the needs of the target audience, as well as budgetary and related constraints (cf. Hanks 2000). Consequently, dictionaries differ in the words that they cover, and also in the word meanings that they distinguish. Dictionary senses are generalizations over the meanings that a word can take, and these generalizations themselves are abstractions over collected occurrences of the word in different contexts (Kilgarriff 1992, 1997, 2006). Regardless of a dictionary’s granularity, the possibility exists for some amount of detail to be lost as a result of this process.
Kilgarriff (1997) calls into question the possibility of general, all-purpose senses of a word and argues that sense distinction only makes sense with respect to a given task. For example, in machine translation, the senses to be distinguished should be those that lead to different translations in the target language. It has since been demonstrated that this is in fact the case (Carpuat and Wu 2007a, 2007b). Hanks (2000) questions the view of senses as disjoint classes defined by necessary and sufficient conditions. He shows that even with a classic homonym like “bank,” some occurrences are more typical examples of a particular sense than others. This notion of typicality is also important in theories of concept representation in psychology (Murphy 2002). Theoretical treatments of word meaning such as the Generative Lexicon (Pustejovsky 1991) also draw attention to the subtle, yet reliable, fluctuations of meaning-in-context, and work in this paradigm also provides evidence that two senses which may appear to be quite distinct can in fact be quite difficult to distinguish in certain contexts (Copestake and Briscoe 1995, page 53).
2.2.2 Psychological Research on Lexical and Conceptual Knowledge. Not all members of a mental category are equal. Some are perceived as more typical than others (Rosch 1975; Rosch and Mervis 1975; and many others), and even category membership itself is clearer in some cases than in others (Hampton 1979). These results are about mental concepts, however, rather than word meanings per se, which raises the question of the relation between word meanings and conceptual knowledge. Murphy (1991, 2002) argues that although not every concept is associated with a word, word meanings show many of the same phenomena as concepts in general—word meaning is “made up of pieces of conceptual structure” (Murphy 2002, page 391). A body of work in cognitive linguistics also discusses the relation between word meaning and conceptual structure (Coleman and Kay 1981; Taylor 2003).
senses are not entirely discrete in the mental lexicon. Whereas Klein and Murphy (2001, 2002) do provide evidence for discreteness of mental sense representations, it appears as though these findings may be due in part to the particular senses included in their studies (Klepousniotou, Titone, and Romero 2008).
Moreover, many psycholinguistic studies have indeed found evidence for process-ing differences between homonyms and polysemous words, usprocess-ing a variety of experi-mental designs, including eye movements and reading times (Frazier and Rayner 1990; Pickering and Frisson 2001) as well as response times in sensicality and lexical decision tasks (Williams 1992; Klepousniotou 2002). Brown (2008, 2010) takes the question of shared vs. separate meaning representations one step further in a semantic priming study6in which she shows that intuitive meaning-in-context similarity judgments have a processing correlate in on-line sentence comprehension. Response time to the target is a negative linear function of its similarity in meaning to the prime, and response accuracy is a positive linear function of this similarity. In other words, the more similar in meaning a prime–target pair was judged to be, the faster and more accurately sub-jects responded. This provides empirical support for a processing correlate of graded similarity-in-meaning judgments.
In our work reported here, we take inspiration from work in psychology and look at ways to model word meaning more continuously. Even though there is still some controversy, the majority of studies support the view that senses of polysemous words are linked in their mental representations. In our work we do not make an explicit distinction between homonymy and polysemy, but the data sets we have produced may be useful for a future exploration of this distinction.
2.3 Alternative Approaches to Word Meaning
Earlier we suggested that word meaning may be better described without positing disjoint senses. We now describe some alternatives to word sense inventory approaches to word meaning, most of which do not rely on disjoint senses.
2.3.1 Substitution-Based Approaches. McCarthy and Navigli (2007) explore the use of synonym or near-synonym lexical substitutions to characterize the meaning of word occurrences. In contrast to dictionary senses, substitutes are not taken to partition a word’s meaning into distinct senses. McCarthy and Navigli gathered their lexical substitution data using multiple annotators. Annotators were allowed to provide up to three paraphrases for each item. Data were gathered for 10 sentences per lemma for 210 lemmas, spanning verbs, nouns, adjectives, and adverbs. The annotation took the form of each occurrence being associated with a multiset of supplied paraphrases, weighted by the frequency with which each paraphrase was supplied. We make extensive use of theLEXSUBdataset in our work reported here. An example sentence with substitutes from theLEXSUBdataset (sentence 451) is given in Table 3.
A related approach also characterizes meaning through equivalent terms, but terms in another language. Resnik and Yarowsky (2000, page 10) suggest “to restrict a word sense inventory to distinctions that are typicallylexicalized cross-linguistically” [emphasis in original]. They argue that such an approach will avoid being too fine-grained, and that the distinctions that are made will be independently motivated by crosslinguistic
Table 3
An example of annotation from the lexical substitution data set: sentence 451.
Sentence: My interest in Europe’s defence policy is nothingnew. Annotation: original 2; recent 2; novel 2; different 1; additional 1
trends. Although substitution and translation methods are not without their own issues (Kilgarriff 1992, page 48), they constitute an approach to word meaning that avoids many of the drawbacks of more traditional sense distinction and annotation. Some cross-linguistic approaches group translations into disjoint senses (Lefever and Hoste 2010), whereas others do not (Mihalcea, Sinha, and McCarthy 2010).
2.3.2 Distributional Approaches. Recently there have been a growing number of distri-butional approaches to representing word meaning in context. These models offer an opportunity to model subtle distinctions in meaning between two occurrences of a word in different contexts. In particular, they allow comparisons between two occurrences of a word without having to classify them as having the same sense or different senses. Some of these approaches compute a distributional representation for a word across all its meanings, and then adapt this to a given sentence context (Landauer and Dumais 1997; Erk and Pado 2008; Mitchell and Lapata 2008; Thater, F ¨urstenau, and Pinkal 2010; Van de Cruys, Poibeau, and Korhonen 2011). Others group distributional contexts into senses. This can be done on the fly for a given occurrence (Erk and Pado 2010; Reddy et al. 2011), or beforehand (Dinu and Lapata 2010; Reisinger and Mooney 2010). The latter two approaches then represent an occurrence through weights over those senses. A third group of approaches is based on language models (Deschacht and Moens 2009; Washtell 2010; Moon and Erk 2012): They infer other words that could be used in the position of the target word.7
3. Two Novel Annotation Tasks
In this section we introduce two novel annotation schemes that draw on methods common in psycholinguistic experiments, but uncommon in corpus annotation. Tra-ditional word sense annotation usually assumes that there is a single correct label for each markable. Annotators are trained to identify the correct labels consistently, often with highly specific a priori guidelines. Multiple annotators are often used, but despite the frequently low ITA in word sense annotation, differences between annotator responses are often treated as the result of annotator error and are not retained in the final annotation data.
In these respects, traditional word sense annotation tasks differ in design from many psycholinguistic experiments, such as the ones discussed in the previous section. Psycholinguistic experiments frequently do not make strong assumptions about how participants will respond, and in fact are designed to gather data on that very ques-tion. Participants are given general guidelines for completing the experiment but these
Table 4
Interpretation of the five-point scale given to the annotators. This interpretation is the same for the Usim and WSsim tasks.
1 completely different 2 mostly different 3 similar
4 very similar 5 identical
guidelines generally stop short of precise procedural detail, to avoid undue influence over participant responses. All of the psycholinguistic studies discussed earlier used participants na¨ıve as to the purpose of the experiment, and who were minimally trained. Responses are often graded in nature, involving ratings on an ordinal scale or in some cases even a continuously valued dimension (e.g., as in Magnitude Estimation). Mul-tiple participants respond to each stimulus, but all participant responses are typically retained, as there are often meaningful discrepancies in participant responses that are not ascribable to error. All of the psycholinguistic studies discussed previously collected data from multiple participants (up to 80 in the case of one experiment by Williams [1992]).
The annotation tasks we present subsequently draw upon these principles of exper-imental design. We collected responses using a scale, rather than binary judgments; we designed the annotation tasks to be accomplishable without prior training and with minimal guidelines, and we used multiple annotators (up to eight) and retained all responses in an effort to capture individual differences. In the following, we describe two different annotation tasks, one with and one without the use of dictionary senses.
Graded Ratings for Dictionary Senses. In our first annotation task, dubbed WSsim (for Word Sense Similarity), annotators rated the applicability of WordNet dictionary senses, using a five-point ordinal scale.8 Annotators rated the applicability of every single WordNet sense for the target lemma, where a rating of 1 indicated that the sense in question did not apply at all, and a rating of 5 indicated that the sense applied completely to that occurrence of the lemma. Table 4 shows the descriptions of the five points on the scale that the annotators were given. By asking annotators to provide ratings for each individual sense, we strive to eliminate all bias toward either single-sense or multiple-single-sense annotation. By asking annotators to provide ratings on a scale, we allow for the fact that senses may not be perceived in a binary fashion.
Graded Ratings for Usage Similarity. In our second annotation task, dubbed Usim (for Usage Similarity), we collected annotations of word usages without recourse to dic-tionary senses, by asking annotators to judge the similarity in meaning of one usage of a lemma to other usages. Annotators were presented with pairs of contexts that share a word in common, and were asked to rate how similar in meaning they perceive those two occurrences to be. Ratings are again on a five-point ordinal scale; a rating of 1 indicated that the two occurrences of the target lemma were completely dissimilar in meaning, and a rating of 5 indicated that the two occurrences of the target lemma were identical in meaning. The descriptions of the five points on the scale, shown in Table 4,
were identical to those used in the WSsim task. Annotators were able to respond “I don’t know” if they were unable to gauge the similarity in meaning of the two occurrences.9
Annotation Procedure. All annotation for this project was conducted over the Internet in specially designed interfaces. In both tasks, all annotator responses were retained, without resolution of disagreement between annotators. We do not focus on obtaining a single “correct” annotation, but rather view all responses as valuable sources of information, even when they diverge.
For each item presented, annotators additionally were provided a comment field should they desire to include a more detailed response regarding the item in question. They could use this, for example, to comment on problems understanding the sentence. The annotators were able to revisit previous items in the task. Annotators were not able to skip forward in the task without rating the current item. If an annotator attempted to submit an incomplete annotation they were prompted to provide a complete response before proceeding. They were free to log out and resume later at any point, however, and also could access the instructions whenever they wanted.
Two Rounds of Annotation. We performed two rounds of the annotation experiments, hereafter referred to asR1 andR2.10Both annotation rounds included both a WSsim and a Usim task, labeled in the subsequent discussion as WSsim-1 and Usim-1 forR1, and WSsim-2 and Usim-2 forR2. An important part of the data analysis is to compare the new, graded annotation to other types of annotation. We compare it to both traditional word sense annotation, with a single best sense for each occurrence, and lexical substitution, which characterizes each occurrence through paraphrases. InR1, we chose annotation data that had previously been labeled with either traditional single sense annotation or with lexical substitutions. R2 included two additional annotation tasks, one involving traditional WSD methodology (WSbest) and a lexical substitution task (SYNbest). In the SYNbest task, annotators provided a single best lexical substitution, in contrast to the multiple substitutes annotators provided in the originalLEXSUBdata.11 Three annotators participated in each task in the R1, and eight annotators partici-pated inR2. InR1, separate groups of annotators participated in WSsim and Usim an-notation, whereas inR2 the same group of annotators was used for all annotation, so as to allow comparison across tasks for the same annotator as well as across annotators. In R2, therefore, the same annotators did both traditional word sense annotation (WSbest) and the graded word sense annotation of the WSsim task. This raises the question of whether their experience on one task will influence their annotation choice on the other task. We tested this by varying the order in which annotators did WSsim and WSbest. R2 annotators were divided into two groups of four annotators with the order of tasks as follows:
group 1: Usim-2 SYNbest WSsim-2 WSbest group 2: Usim-2 SYNbest WSbest WSsim-2
Another difference between the two rounds of annotation was that in R2 we per-mitted the annotators to see one more sentence of context on either side of the target
9 The “I don’t know” option was present only in the Usim interface, and was not available in WSsim. 10 The annotation was conducted in two separate rounds due to funding.
11 Annotation guidelines forR1 are athttp://www.katrinerk.com/graded-sense-and-usage-annotation
Table 5
Abbreviations used in the text for annotation tasks and rounds.
WSsim Task: graded annotation of WordNet senses on a five-point scale Usim Task: graded annotation of usage similarity on a five-point scale WSbest Task: traditional single-sense annotation
SYNbest Task: lexical substitution
R1 Annotation round 1 R2 Annotation round 2
sentence. In R1 each item was given only one sentence as context. We added more context in order to reduce the chance that the sentence would be unclear. Table 5 summarizes up the annotation tasks and annotation rounds on which we report.
Data Annotated. The data to be annotated in WSsim-1 were taken primarily from Semcor (Miller et al. 1993) and the Senseval-3 English lexical sample (SE-3) (Mihalcea, Chklovski, and Kilgarriff 2004). This experiment contained a total of 430 sentences span-ning 11 lemmas (nouns, verbs, and adjectives). For eight of these lemmas, 50 sentences were included, 25 randomly sampled from Semcor and 25 randomly sampled fromSE-3. The remaining three lemmas in the experiment had 10 sentences each, from theLEXSUB data. Each of the three annotators annotated each of the 430 items, providing a response for each WordNet sense for that lemma. Usim-1 used data from LEXSUB. Thirty-four lemmas were manually selected, including the three lemmas also used in WSsim-1. We selected lemmas which exhibited a range of meanings and substitutes in theLEXSUB data, with as few multiword substitutes as possible. Each lemma is the target in 10 LEXSUB sentences except there were only nine sentences for the lemmabar.nbecause of a part-of-speech tagging error in theLEXSUBtrial data. For each lemma, annotators were presented with every pairwise comparison of these 10 sentences. We refer to each such pair as anSPAIR. There were 45SPAIRs per lemma (36 forbar.n), adding up to 1,521 comparisons per annotator in Usim-1.
InR1, only 30 sentences were included in both WSsim and Usim. Because compar-ison of annotator responses on this subset of the two tasks yielded promising results, R2 used the same set of sentences for both Usim and WSsim so as to better compare these tasks. All data in the second round were taken fromLEXSUB, and contained 26 lemmas with 10 sentences for each. We produced the SYNbest annotation, rather than use the existing LEXSUB annotation, so that we could ensure the same conditions as with the other annotation tasks, that is, using the same annotators and providing the extra sentence of context on either side of the original LEXSUB context. We also only required that the annotators provide one substitute. As such, there were 260 target lemma occurrences that received graded word sense applicability ratings in WSsim-2, and 1,170SPAIRs (pairs of occurrences) to be annotated in Usim-2.
4. Analysis of the Annotation
4.1 Evaluation Measures
Because both graded annotation tasks, WSsim and Usim, use ratings on five-point scales rather than binary ratings, we measure agreement in terms of correlation. Because ratings were not normally distributed, we choose a non-parametric test which uses ranks rather than absolute values: We use Spearmans rank correlation coefficient (rho), following Mitchell and Lapata (2008). For assessing inter-tagger agreement on the R2 WSbest task we adopt the standardWSDmeasure of average pairwise agreement, and forR2 SYNbest, we use the same pairwise agreement calculation used inLEXSUB.
When comparing graded ratings with single-sense or lexical substitution annota-tion, we use the mean of all annotator ratings in the WSsim or Usim annotation. This is justified because the inter-annotator agreement is highly significant, with respectable rho compared with previous work (Mitchell and Lapata 2008).
As the annotation schemes differ betweenR1 andR2 (as mentioned previously, the number of annotators and the amount of visible context are different, andR2 annotators did traditional word sense annotation in the WSbest task in addition to the graded tasks) we report the results ofR1 andR2 separately.12
4.2 WSsim: Graded Ratings for WordNet Senses
In the WSsim task, annotators rated the applicability of each sense of the target word on a five-point scale. We first do a qualitative analysis, then turn to a quantitative analysis of annotation results.
4.2.1 Qualitative Analysis. Table 6 shows an example of WSsim annotation. The target is the verb dismiss, which was annotated in R2. The first column gives the WordNet sense number (sn).13 Note that in the task, the annotators were given the synonyms and full description but in this figure we only supply part of the description for the sake of space. As can be seen, three of the annotators chose a single-sense annotation by giving a rating of 5 to one sense and ratings of 1 to all others. Two annotators gave ratings of 1 and 2 to all but one sense. The other three annotators gave positive ratings (ratings of at least 3 [similar], see Table 4) to at least two of the senses. All annotators agree that the first sense fits the usage perfectly, and all annotators agree that senses 3 and 5 do not apply. The second sense, on the other hand, has an interestingly wide distribution of judgments, ranging from 1 to 4. This is the judicial sense of the verb, as in ‘this case is dismissed.’ Some annotators consider this sense to be completely distinct from sense 1, whereas others see a connection. There is disagreement among annotators, about sense 6. This is the sense ‘dismiss, dissolve,’ as in ‘the president dissolved the parliament.’ Six of the annotators consider this sense completely unrelated to ‘dismiss our actions as irrelevant,’ whereas two annotators view it as highly related (though not completely identical). It is noteworthy that each of the two opinions, a rating of 1
12 It is known that when responses are collected on an ordinal scale, the possibility exists for different individuals to use the scale differently. As such, it is common practice to standardize responses using a
z-score, which maps a responseXtoz=X−σμ. The calculation ofz-scores makes reference to the mean
Table 6
WSsim example,R2: Annotator judgments for the different senses ofdismiss.
If we see ourselves as separate from the world, it is easy todismissour actions as irrelevant or unlikely to make any difference. (902)
sn Description Ratings By Annotator Mean
1 bar from attention or consideration 5 5 5 5 5 5 5 5 5
2 cease to consider 1 4 1 3 2 2 1 3 2.125
3 stop associating with 1 2 1 1 1 2 1 1 1.25
4 terminate the employment of 1 4 1 2 1 1 1 1 1.5
5 cause or permit a person to leave 1 2 1 1 1 1 1 2 1.25
6 declare void 1 1 1 4 1 1 1 4 1.75
and a rating of 4, was chosen by multiple annotators. Because multiple annotators give each judgment, these data seem to reflect a genuine difference in perceived sense. We discuss inter-annotator agreement, both overall and considering individual annotators, subsequently.
Table 7 gives an example sentence fromR1, where the annotated target is the noun paper. All annotators agree that sense 5, ‘scholarly article,’ applies fully. Sense 2 (‘essay’) also gets ratings of ≥3 from all annotators. The first annotator seems also to have perceived the ‘physical object’ connotation to apply strongly to this example, and has expressed this quite consistently by giving high marks to sense 1 as well as 7.
[image:13.486.59.438.537.664.2]Table 8 shows a sample annotated sentence with an adjective target,neat, annotated inR2. In this case, only one annotator chose single-sense annotation by marking exclu-sively sense 4. One annotator gave ratings≥3 (similar) toallsenses of the lemma. All other annotators saw at least two senses as applying (with ratings≥3) and at least one sense as not applying at all (with a rating of 1). Sense 4 has received positive ratings (that is, ratings≥3) throughout. Senses 1, 2, and 6 have mixed ratings, and senses 3 and 5 have positive ratings only from the one annotator who marked everything as applying. Interestingly, ratings for senses 1, 2, and 6 diverge sharply, with some annotators seeing them as not applying at all, and some giving them ratings in the 3–5 range. Note that the
Table 7
WSsim example,R1: Annotator judgments for the different senses ofpaper.
This can be justified thermodynamically in this case, and this will be done in a separate paperwhich is being prepared. (br-j03, sent. 4)
sn Description Ratings Mean
1 a material made of cellulose pulp 4 1 1 1.3
2 an essay (especially one written as an assignment) 3 3 5 3.7 3 a daily or weekly publication on folded sheets; contains
news and articles and advertisements
2 1 3 2
4 a medium for written communication 5 3 1 3
5 a scholarly article describing the results of observations or stating hypotheses
5 5 5 5
6 a business firm that publishes newspapers 2 1 1 1.3 7 the physical object that is the product of a newspaper
publisher
Table 8
WSsim example,R2: Annotator judgments for the different senses ofneat.
Over the course of the 20th century scholars have learned that such images tried to make messy realityneaterthan it really is (103)
sn Description Ratings By Annotator Mean
1 free from clumsiness; precisely or deftly executed
1 5 1 4 5 5 5 5 3.375
2 refined and tasteful in appearance or behavior or style
3 4 1 4 4 3 1 3 2.875
3 having desirable or positive qualities especially those suitable for a thing specified
1 3 1 1 1 1 1 1 1.25
4 marked by order and cleanliness in appearance or habits
4 5 5 3 4 5 5 5 4.5
5 not diluted 1 4 1 1 1 1 1 1 1.375
[image:14.486.49.432.322.398.2]6 showing care in execution 1 4 1 3 4 1 3 3 2.5
Table 9
Correlation matrix for pairwise correlation agreement for WSsim-1. The last row provides the agreement of the annotator in that column against the average from the other annotators.
A B C
A 1.00 0.47 0.51
B 0.47 1.00 0.54
C 0.51 0.54 1.00
against avg 0.56 0.58 0.61
annotators who give ratings of 1 are not the same for these three ratings, pointing to dif-ferent, but quite nuanced, judgments of the ‘make reality neater’ usage in this sentence.
4.2.2 Inter-annotator Agreement. We now turn to a quantitative analysis, starting with inter-annotator agreement. For the graded WSsim annotation, it does not make sense to compute the percentage of perfect agreement. As discussed earlier, we report inter-annotator agreement in terms of correlation, using Spearman’s rho. We calculate pair-wise agreements and report the average over all pairs. The pairpair-wise correlations are shown in the matrix in Table 9. We have used capital letters to represent the individ-uals, preserving the same letter for the same person across tasks. In the last row we show agreement of each annotator’s judgments against the average judgment from the other annotators. The pairwise correlations range from 0.47 to 0.54 and all pairwise correlations were highly significant (p 0.001), with an average of rho=0.504. This is a very reasonable result given that Mitchell and Lapata (2008) report a rho of 0.40 on a graded semantic similarity task.14 The lowest correlation against the average
Table 10
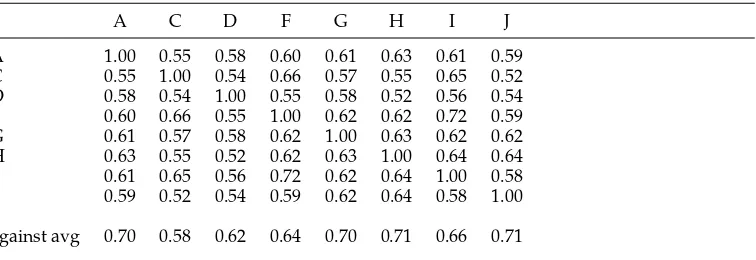
Correlation matrix for pairwise correlation agreement for WSsim-2. The last row provides the agreement of the annotator in that column against the average from the other annotators.
A C D F G H I J
A 1.00 0.55 0.58 0.60 0.61 0.63 0.61 0.59 C 0.55 1.00 0.54 0.66 0.57 0.55 0.65 0.52 D 0.58 0.54 1.00 0.55 0.58 0.52 0.56 0.54 F 0.60 0.66 0.55 1.00 0.62 0.62 0.72 0.59 G 0.61 0.57 0.58 0.62 1.00 0.63 0.62 0.62 H 0.63 0.55 0.52 0.62 0.63 1.00 0.64 0.64 I 0.61 0.65 0.56 0.72 0.62 0.64 1.00 0.58 J 0.59 0.52 0.54 0.59 0.62 0.64 0.58 1.00
against avg 0.70 0.58 0.62 0.64 0.70 0.71 0.66 0.71
from the other annotators was 0.56. We discuss the annotations of individuals in Sec-tion 4.6, including our decision to retain the judgments of all annotators for our gold standard.
From the correlation matrix in Table 10 we see that for WSsim-2, pairwise corre-lations ranged from 0.52 to 0.72. The average value of the pairwise correcorre-lations was rho=0.60, and again every pair was highly significant (p0.001). The lowest correla-tion against the average from all the other annotators was 0.58.
[image:15.486.52.438.557.667.2]4.2.3 Choice of Single Sense Versus Multiple Senses.In traditional word sense annotation, annotators can mark more than one sense as applicable, but annotation guidelines often encourage them to view the choice of a single sense as the norm. In WSsim, annotators gave ratings for all senses of the target. So we would expect that in WSsim, there would be a higher proportion of senses selected as applicable. Indeed we find this to be the case: Table 11 shows the proportion of sentences where some annotator has assigned more than one sense with a judgment of 5, the highest value. Both 1 and WSsim-2 have a much higher proportion of sentences with multiple senses chosen than the traditional sense-annotated data sets SemCor and SE-3. Interestingly, we notice that the percentage for WSsim-1 is considerably higher than for WSsim-2. In principle, this could be due to differences in the lemmas that were annotated, or differences in the sense perception of the annotators between R1 andR2. Another potential influencing
Table 11
WSsim annotation: Proportion of sentences where multiple senses received a rating of 5 (highest judgment) from the same annotator.
Proportion
WSsim-1 46%
WSsim-2 30%
WSsim-2, WSsim first 36% WSsim-2, WSbest first 23%
SemCor 0.3%
factor is the order of annotation experiments: As described earlier, half of theR2 anno-tators did WSbest annotation before doing WSsim-2, and half did the two experiments in the opposite order. As Table 11 shows, those doing the graded task WSsim-2 before the binary task WSbest had a greater proportion of multiple senses annotated with the highest response. This demonstrates that annotators in a word meaning task can be influenced by factors outside of the current annotation task, in this case another annotation task that they have done previously. We take this as an argument in favor of using as many annotators as possible in order to counteract factors that contribute noise. In our case, we counter the influence of previous annotation tasks somewhat by using multiple annotators and altering the order of the WSsim and WSbest tasks. Another option would have been to use different annotators for different tasks; by using the same set of annotators for all four tasks, however, we can better control for individual variation.
4.2.4 Use of the Graded Scale.We next ask whether annotators in WSsim made use of the whole five-point scale, or whether they mostly chose the extreme ratings of 1 and 5. If the latter were the case, this could indicate that they viewed the task of word sense assignment as binary. Figure 1a shows the relative frequency distribution of responses from all annotators over the five scores for bothR1 andR2. Figures 2a and 3a show the same but for each individual annotator. In both rounds the annotators chose the rating of 1 (‘completely different,’ see Table 4) most often. This is understandable because each item is a sentence and sense combination and there will typically be several irrelevant senses for a given sentence. The second most frequent choice was 5 (‘identical’). Both rounds had plenty of judgments somewhere between the two poles, so the annotators do not seem to view the task of assigning word sense as completely binary. Although the annotators vary, they all use the intermediate categories to some extent and certainly the intermediate category judgments do not originate from a minority of annotators.
[image:16.486.53.386.480.639.2]We notice that R2 annotators tended to give more judgments of 1 (‘completely different’) than the R1 annotators. One possible reason is again that half our annota-tors did WSbest before WSsim-2. If this were the cause for the lower judgments, we would expect more ratings of 1 for the annotators who did the traditional word sense annotation (WSbest) first. In Table 12 we list the relative frequency of each rating for the different groups of annotators. We certainly see an increase in the judgments of 1 where
Figure 1
Figure 2
WSsim and UsimR1 individual ratings.
Figure 3
WSsim and UsimR2 individual ratings.
WSbest is performed before WSsim-2. Again, this may indicate that annotators were leaning more towards finding a single exact match because they were influenced by the WSbest task they had done before. Annotators in that group were also slightly less inclined to take the middle ground, but this was true of both groups ofR2 annotators compared with theR1 annotators. We think that this difference between the two rounds may well be due to the lemmas and data.
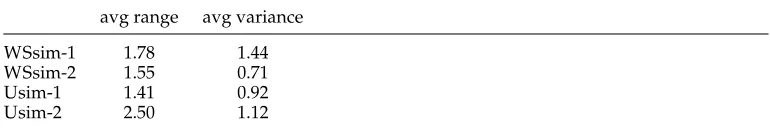
In Table 18, we show the average range15 and average variance of the judgments per item for each of the graded annotation tasks. WSsim naturally has less variation
[image:17.486.53.427.291.486.2]Table 12
The relative frequency of the annotations at each judgment from all annotators.
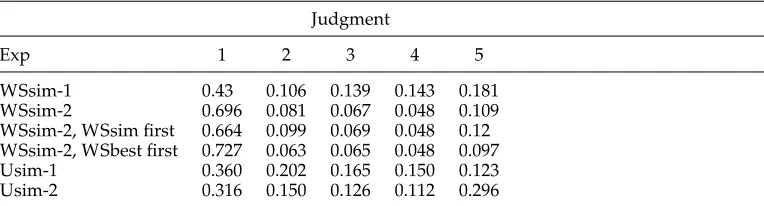
Judgment
Exp 1 2 3 4 5
WSsim-1 0.43 0.106 0.139 0.143 0.181
WSsim-2 0.696 0.081 0.067 0.048 0.109
WSsim-2, WSsim first 0.664 0.099 0.069 0.048 0.12 WSsim-2, WSbest first 0.727 0.063 0.065 0.048 0.097
Usim-1 0.360 0.202 0.165 0.150 0.123
Usim-2 0.316 0.150 0.126 0.112 0.296
compared with Usim because, for any sentence, there are inevitably many WordNet senses which are irrelevant to the context at hand and which will obtain a judgment of 1 from everyone. This is particularly the case for WSsim-2 where the annotators gave more judgments of 1, as discussed previously. The majority of items have a range of less than two for WSsim. We discuss the Usim figures further in the following section.
4.3 Usim: Graded Ratings for Usage Similarity
In Usim annotation, annotators compared pairs of usages of a target word (SPAIRs) and rated their similarity on the five-point scale given in Table 4. The annotators were also permitted a response of “don’t know.” Such responses were rare but were used when the annotators really could not judge usage similarity, perhaps because the meaning of one sentence was not clear. We removed any pairs where one of the annotators had given a “don’t know” verdict (9 inR1, 28 inR2). ForR1 this meant that we were left with a total of 1,512SPAIRs and inR2 we had a resultant 1,142SPAIRs.
4.3.1 Qualitative Analysis.We again start by inspecting examples of Usim annotation. Table 13 shows the annotation for an SPAIR of the verb dismiss. The first of the two sentences talks about “dismissing actions as irrelevant,” the second is about dismissing a person. Interestingly, the second usage could be argued to carry both a connotation of ‘ushering out’ and a connotation of ‘disregarding.’ Annotator opinions on thisSPAIR vary from a 1 (completely different) to a 5 (identical), but most annotators seem to view the two usages as related to an intermediate degree. This is adequately reflected in the average rating of 3.125. Table 14 compares the sentence from Table 8 to another sentence
Table 13
Usim example: Annotator judgments for a pair of usages ofdismiss.
Sentences Ratings
If we see ourselves as separate from the world, it is easy todismiss
our actions as irrelevant or unlikely to make any difference. 1, 2, 3, 3,3, 4, 4, 5
Table 14
Usim example: Annotator judgments for a pair of usages ofneat.
Sentences Ratings
Over the course of the 20th century scholars have learned that such
images tried to make messy realityneaterthan it really is. 3, 3, 4, 4,4, 4, 5, 5
Strong field patterns created by hedgerows give the landscape a neat, well structured appearance.
Table 15
Usim example: Annotator judgments for a pair of usages ofaccount.
Sentences Ratings
Samba-3 permits use of multipleaccountdata base backends. 1, 2, 3, 3, 3, 4, 4, 4 Within a week, Scotiabank said that it had frozen someaccounts
linked to Washington’s hit list.
with the target neat. The first sentence is a metaphorical use (making reality neater), the second is literal (landscape with neat appearance), but still the SPAIR gets high ratings of 3–5 throughout for an average of 4.0. Note that the WordNet senses, shown in Table 8, do not distinguish the literal and metaphorical uses of the adjective, either. Table 15 shows two uses of the nounaccount. The first pertains to accounts on a software system, the second to bank accounts. The spread of annotator ratings shows that these two uses are not the same, but that some relation exists. The average rating for this SPAIRis 3.0.
[image:19.486.52.437.588.665.2]4.3.2 Inter-annotator Agreement. We again calculate inter-annotator agreement as the average over pairwise Spearman’s correlations. The pairwise correlations are shown in the matrix in Table 16. In the last row we show agreement of each annotator’s judgments against the average judgment from the other annotators. For Usim-1 the range of correlation coefficients is between 0.50 and 0.64 with an average correlation of rho = 0.548. All the pairs are highly significantly correlated (p0.001). The smallest correlation for any individual against the average is 0.55. The correlation matrix for Usim-2 is provided in Table 17; the range of correlation coefficients is between 0.42 and
Table 16
Correlation matrix for pairwise correlation agreement for Usim-1. The last row provides the agreement of the annotator in that column against the average from the other annotators.
A D E
A 1.00 0.50 0.64
D 0.50 1.00 0.50
E 0.64 0.50 1.00
Table 17
Correlation matrix for pairwise correlation agreement for Usim-2. The last row provides the agreement of the annotator in that column against the average from the other annotators.
A C D F G H I J
A 1.00 0.70 0.52 0.70 0.69 0.72 0.73 0.67
C 0.70 1.00 0.48 0.72 0.60 0.66 0.71 0.69
D 0.52 0.48 1.00 0.48 0.49 0.51 0.50 0.42
F 0.70 0.72 0.48 1.00 0.66 0.71 0.74 0.68
G 0.69 0.60 0.49 0.66 1.00 0.71 0.65 0.62
H 0.72 0.66 0.51 0.71 0.71 1.00 0.70 0.65
I 0.73 0.71 0.50 0.74 0.65 0.70 1.00 0.72
J 0.67 0.69 0.42 0.68 0.62 0.65 0.72 1.00
against avg 0.82 0.78 0.58 0.80 0.76 0.80 0.81 0.76
0.73. All these correlations are highly significant (p0.001) with an average correlation of rho = 0.62. The lowest agreement between any individual and the average judgment of the others is 0.58. Again, we note that these are all respectable values for tasks involving semantic similarity ratings.
Use of the graded scale. Figure 1b shows how annotators made use of the graded scale in Usim-1 and Usim-2. It graphs the relative frequency of each of the judgments on the five-point scale. Figures 2b and 3b show the same but for each individual annotator. In both annotation rounds, the rating 1 (completely different) was chosen most frequently. There are also in both annotation rounds many ratings in the middle points of the scale, indeed we see a larger proportion of mid-range scores for Usim than for WSsim in general, as shown in Table 12. Figures 2b and 3b show that although individuals differ, all use the mid points to some extent and it is certainly not the case that these mid-range judgments come from a minority of annotators. In Usim, annotators com-pared pairs of usages, whereas in WSsim, they comcom-pared usages with sense defini-tions. The sense definitions suggest a categorization that may bias annotators towards categorical choices. Comparing the two annotation rounds for Usim, we see that in Usim-2 there seem to be many more judgments at 5 than in Usim-1. This is similar to our findings for WSsim, where we also obtained more polar judgments forR2 than forR1.
[image:20.486.48.433.598.664.2]There is a larger range on average for Usim-2 compared with the other tasks as shown earlier by Table 18. This is understandable given that there are eight annotators
Table 18
Average range and average variance of judgments for each of the graded experiments.
avg range avg variance
WSsim-1 1.78 1.44
WSsim-2 1.55 0.71
Usim-1 1.41 0.92
substantial variation by lemma. In Usim-2,fire.v,rough.a, andcoach.nhave an average range of 1.33, 1.76, and 1.93, respectively, whereassuffer.v,neat.a, andfunction.n have average ranges of 3.14, 3.16, and 3.58, respectively. The variation in range appears to depend on the lemma rather than POS. This variation can be viewed as a gauge of how difficult the lemma is. Although the range is larger in Usim-2, however, the average variance per item (i.e., the variance considering the eight annotators) is 1.12 and lower than that for WSsim-1.
Usim and the triangle inequality.In Euclidean space, the lengths of two sides of a triangle, taken together, must always be greater than the length of the third side. This is the triangle inequality:
length(longest)<length(second longest)+length(shortest)
We now ask whether the triangle inequality holds for Usim ratings. If Usim similarities are metric, that is, if we can view the ratings as proximity in a Euclidean “meaning space,” then the triangle inequality would have to hold. This question is interesting for what it says about the psychology of usage similarity judgments. Classic results due to Tversky and colleagues (Tversky 1977; Tversky and Gati 1982) show that human judgments of similarity are not always metric. Tversky (1977), varying an example by William James, gives the following example, which involves words, but explicitly ignores context:
Consider the similarity between countries: Jamaica is similar to Cuba (because of geographical proximity); Cuba is similar to Russia (because of their political affinity); but Jamaica and Russia are not similar at all. [. . . ] the perceived distance of Jamaica to Russia exceeds the perceived distance of Jamaica to Cuba, plus that of Cuba to Russia—contrary to the triangle inequality.
Note, however, that Tversky was considering similarity judgments for different words, whereas we look at different usages of the same word. The question of whether the triangle inequality holds for Usim ratings is also interesting for modeling reasons. Several recent approaches model word meaning in context through points in vector space (Erk and Pado 2008; Mitchell and Lapata 2008; Dinu and Lapata 2010; Reisinger and Mooney 2010; Thater, F ¨urstenau, and Pinkal 2010; Washtell 2010; Van de Cruys, Poibeau, and Korhonen 2011). They work on the tacit assumption that similarity of word usages is metric—an assumption that we can directly test here. Third, the triangle inequality question is also relevant for future annotation; we will discuss this in more detail subsequently.
To test whether Usim ratings obey the triangle inequality, we first convert the similarityratings that the annotators gave todissimilarity ratings: Letsavg be the mean similarity rating over all annotators, then we use the dissimilarity ratingd=6−savg (as 5 was the highest possible similarity score).
We examine the proportion of sentence triples where the triangle inequality holds (that is, we consider every triple of sentences that share the same target lemma). In those
cases where the triangle inequality is violated, we also assess the degree to which it is violated, calculated as the average distance that is missed: LetTmissbe the set of triples for which the triangle inequality does not hold, then we compute
m= 1
|Tmiss|
t∈Tmiss
length(longestt)−(length(second longestt)+length(shortestt))
This is the average amount by which the longest side is “too long.”
For the first round of annotation, Usim-1, we found that 99.2% of the sentence triples obey the triangle inequality. For the triples that miss it, the average amount by which the longest side is too long is m=0.520. This is half a point on the five-point rating scale, a low amount. InR2, all sentence triples obey the triangle inequality. One potential reason for this is that we have eight annotators for R2, and a larger sample of annotators reduces the variation from individuals. Another reason may be that the annotators in R2 could view two more sentences of context than those inR1.
Tables 19 and 20 show results of the triangle inequality analysis, but by individual annotator. Every annotator has at least 93% of sentence triples obeying the principle. For the triples that miss it, they tend to miss it by between one and two points. The results for individuals accord with the triangle inequality principle, though to a lesser extent compared with the analysis using the average, which reduces the impact of variation from individuals.
[image:22.486.49.435.518.579.2]As discussed previously, this result (that the triangle inequality holds for Usim annotation triples) is interesting because it contrasts with Tversky’s findings (Tversky 1977; Tversky and Gati 1982) that similarity ratings between different words are not metric. And although we consider similarity ratings for usages of the same word, not different words, we would argue that our findings point to the importance of consider-ing the context in which a word is used. It would be interestconsider-ing to test whether similarity ratings for different words, when used in context, obey the triangle inequality. To reference the Tversky example, and borrowing some terminology from Cruse, evoking theISLANDfacet of Jamaica and Cuba versus theCOMMUNIST STATEfacet of Cuba and Russia would account for the non-metricality of the similarity judgments as Tversky
Table 19
Triangle inequality analysis by annotator, Usim-1.
average A D E
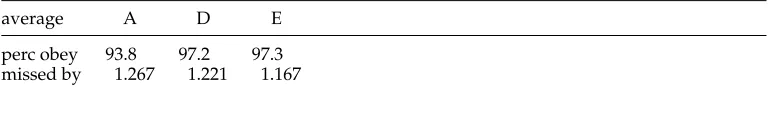
[image:22.486.49.438.618.662.2]perc obey 93.8 97.2 97.3 missed by 1.267 1.221 1.167
Table 20
Triangle inequality analysis by annotator, Usim-2.
A C D F G H I J
perc obey 94.1 97.5 98.4 97.2 93.6 97.0 97.4 97.4
Table 21
WSbest annotations.
sense selected Proportion with no yes multiple choice
WSbest 19,599 2,401 0.13
WSbest, WSsim-2 first 9,779 1,221 0.15 WSbest, WSbest first 9,820 1,180 0.11
points out, and moreover highlight the lack of an apt comparison between Jamaica and Russia at all. There is some motivation for this idea in the psychological literature on structural alignment and alignable differences (Gentner and Markman 1997; Gentner and Gunn 2001).
In addition, our finding that the triangle inequality holds for Usim annotation will be useful for future Usim annotation. Usage similarity annotation is costly (and somewhat tedious) as annotators give ratings for each pair of sentences for a given target lemma. Given that we can expect usage similarity to be metric, we can eliminate the need for some of the ratings. Once annotators have rated two usage pairs out of a triple, their ratings set an upper limit on the similarity of the third pair. In the best case, if usagess1ands2have a distance of 1 (i.e., a similarity of 5), ands1ands3have a distance of 1, then the distance ofs1 and s3 can be at most 2. For all usage triples where two pairs have been judged highly similar, we can thus omit obtaining a rating for the third pair. A second option for obtaining more Usim annotation is to use crowdsourcing. In crowdsourcing annotation, quality control is always an issue, and again we can make use of the triangle inequality to detect spurious annotation: Ratings that grossly violate the triangle inequality can be safely discarded.
4.4 WSbest
The WSbest task reflects the traditional methodology in word sense annotation where words are annotated with the best fitting sense. The guidelines17 allow for selecting more than one sense provided all fit the example equally well. Table 21 shows that, as one would expect given the number of senses in WordNet, there are more unse-lected senses than seunse-lected. We again find an influence of task order: When annota-tors did the graded annotation (WSsim-2) before WSbest, there were more multiple assignments (see the last column) and therefore more senses selected. This difference is statistically significant (χ2 test, p =0.02). Regardless of the order of tasks, we no-tice that the proportion of multiple sense choice is far lower than the equivalent for WSsim (see Table 11), as is expected due to the different annotation schemes and guidelines.
We calculated inter-annotator agreement using pairwise agreement, as is standard in WSD. There are several ways to calculate pairwise agreement in cases of multiple selection, though these details are not typically given inWSD papers. We use the size of the intersection of selections divided by the maximum number of selections from
Table 22
Inter-annotator agreement without one individual for WSbest and SYNbestR2.
average A C D F G H I J
WSbest 0.574 0.579 0.564 0.605 0.560 0.582 0.566 0.566 0.568 SYNbest 0.261 0.261 0.259 0.285 0.254 0.256 0.245 0.260 0.267
either annotator. This is equivalent to 1 for agreement and 0 for disagreement in cases where both annotators have selected only one sense. Formally, leti∈Ibe one annotated sentence. Let Abe the set of annotators and let PA={{a,a} |a,a∈A}be the set of annotator pairs. Letaibe the set of senses that annotatora∈Ahas chosen for sentence i. Then pairwise agreement between annotators is calculated as:
ITAWSbest= i∈I
{a,a}∈PA
|ai∩ai|
max(|ai|,|ai|)
|PA| · |I| (1)
The average ITA was calculated as 0.574.18 If we restrict the calculation to items where each annotator only selected one sense (not multiple), the average is 0.626.
For SE-3, ITA was 0.628 on the English Lexical Sample task, not including the multiword data (Mihalcea, Chklovski, and Kilgarriff 2004). This annotation exercise used volunteers from the Web (Mihalcea and Chklovski 2003). Like our study, it had taggers without lexicography background and gave a comparable ITA to our 0.626. We calculated pairwise agreement for eight annotators. To carry out the experiment under maximally similar conditions to previous studies, we also calculated ITA for items with only one response and use only the four annotators who performed WSbest first. This resulted in an average ITA of 0.638.
We also calculated the agreement for WSbest in R2 as in Equation 1 but with each individual removed to see the change in agreement. The results are in the first row of Table 22.
4.5 SYNbest
The SYNbest task is a repetition of theLEXSUBtask (McCarthy and Navigli 2007, 2009) except that annotators were asked to provide one synonym at most. As in LEXSUB, agreement between a pair of annotators was counted as the proportion of all the sentences for which the two annotators had given the same response.
As in WSbest, let A be the set of annotators.I is the set of test items, but as in LEXSUB we only include those where at least two annotators have provided at least one substitute: If only one annotator can think of a substitute then it is likely to be a problematic item. As in WSbest, letaibe the set19 of responses (substitutes) for an item
18 Although there is a statistical difference in the number of multiple assignments depending upon whether WSsim-2 is completed before or after WSbest, ITA on the WSbest task does not significantly differ between the two sets.
agreement between annotators is calculated as inLEXSUBas:
PA=
i∈I
{a,a}∈PA |ai∩ai| |ai∪ai|
|PA| · |I| (2)
Note that in contrast to pairwise agreement for traditional word sense annotation (WSbest), the credit for each item (the intersection of annotations from the annotator pair) is divided by the union of the responses. For traditional WSD evaluation, it is divided by the number of responses from either annotator, which is usually one. For lexical substitution this is important as the annotations are not collected over a predeter-mined inventory. InLEXSUB, thePAfigure was 0.278, whereas we obtainPA=0.261 on SYNbest. There were differences in the experimental set-up. We had eight annotators, compared with five, and for SYNbest each annotator only provided one substitute. Additionally, our experiment involved only a subset of the data used inLEXSUB. The figures are not directly comparable, but are reasonably in line.
In our task, out of eight annotators we had at most three people who could not find a substitute for any given item, so there were always at least five substitutes per item. InLEXSUBthere were 16 items excluded from testing in the full data set of 2010 because there was only one token substitute provided by the set of annotators.
We also calculated the agreement for SYNbest as in Equation 2 but with each individual removed to see the change in agreement. The results are in the second row of Table 22.
4.6 Discussion of the Annotations of Individuals
We do not pose these annotation tasks as having “correct responses.” We wish instead to obtain the annotators’ opinions, and accept the fact that the judgments will vary. Nevertheless, we would not wish to conduct our analysis using annotators who were not taking the task seriously. In the analyses that follow in subsequent sections, we use the average judgment from our annotators to reduce variation from individuals. Nevertheless, before doing so, in this subsection we briefly discuss the analysis of the individual annotations provided earlier in this section in support of our decision to use all annotators for the gold standard.
4.7 Agreement Between Annotations in Different Frameworks
In this paper we are considering various different annotations of the same underly-ing phenomenon: word meanunderly-ing as it appears in context. In dounderly-ing so, we contrast traditional WSDmethodology (SE-3, SemCor, and WSbest) with graded judgments of sense applicability (WSsim), usage similarity (Usim), and lexical substitution as in LEXSUBand SYNbest. In this section we compare the annotations from these different paradigms where the annotations are performed on the same underlying data. For WSsim and Usim, we use average ratings as the point of comparison.
4.7.1 Agreement Between WSsim and Traditional Sense Assignment. To compare WSsim ratings on a five-point scale with traditional sense assignment on the same data, we convert the traditional word sense assignments to ratings on a five-point scale: Any sense that is assigned is given a score of 5, and any sense that is not assigned is given a score of 1. If multiple senses are chosen in the gold standard, then they are all given scores of 5. We then correlate the converted ratings of the traditional word sense assignment with the average WSsim ratings using Spearman’s rho.
As described earlier, most of the sentences annotated in WSsim-1 were taken from eitherSE-3 or SemCor. The correlation of WSsim-1 andSE-3 is rho = 0.416, and the cor-relation of WSsim-1 with SemCor is rho = 0.425. Both are highly significant (p0.001). For R2 we can directly contrast WSsim with the traditional sense annotation in WSbest on the same data. This allows a fuller comparison of traditional and graded tagging because we have a data set annotated with both methodologies, under the same conditions, and with the same set of annotators. We use the mode (most common) sense tag from our eight annotators as the traditional gold standard label for WSbest and assign a rating of 5 to that sense, and a rating of 1 elsewhere. We again used Spearman’s rho to measure correlation between WSbest and WSsim and obtained rho = 0.483 (p0.001).
4.7.2 Agreement Between WSsim and Usim. WSsim and Usim provide two graded an-notations of word usage in context. To compare the two, we convert WSsim scores to usage similarity ratings as in Usim. In WSsim, each sense has a rating (aver-aged over annotators), so a sentence has a vector of ratings with a “dimension” for each sense. For example, the vector of average ratings for the sentence in Table 6 is
5, 2.125, 1.25, 1.5, 1.25, 1.75. All sentences with the same target will have vectors in the same space, as they share the same sense list. Accordingly, we can compare a pairu,u of sentences that share a target using Euclidean distance:
d(u,u)= i
(ui−ui)2
whereuiis theith dimension of the vectoruof ratings for sentenceu. Note that this gives us adissimilarityrating foru,u. We can now compare these sentence pair dissimilarities to the similarity ratings of the Usim annotation.
InR1 we found a correlation of rho=−0.596 between WSsim and Usim ratings.20 The basis of this comparison is small, at three lemmas with 10 sentences each, giving