Market Perspective
February 2015US valuations: not an obstacle to further market
progress
US equities have outperformed other major markets in recent years and
the outlook remains strong, thanks to an improving economy,
world-leading companies and brands, narrowing twin deficits, and a
strengthening dollar. All this should ensure that global capital continues
flowing to US assets. Nevertheless, some investors remain unconvinced
by the US equity bull market with a key objection being concern over
valuations (mostly made on a cyclically adjusted PE, or CAPE, basis).
We argue that US equities are not overvalued when you consider a range
of relative valuation measures, sustained strong returns on equity, low
cost of capital and the structural factors supporting US earnings.
AT A GLANCE
US equity valuations have increased as the stock market has rallied since 2009, strongly outperforming most other major markets.
While multiple expansion has been a key driver, earnings have been growing strongly.
The overall evidence does not support the view that US equities are overvalued.
On most valuation measures, US equities are only modestly above long term averages, or close to fair value. One exception is the Shiller CAPE,
but this has some important caveats. US valuations are supported by
higher returns on equity and lower costs of capital.
With the share of profits in US GDP on a structural incline since the 1970s, it is possible that US firms are becoming ‘structurally more profitable’ in an increasingly global marketplace.
US EQUITIES – THE PERFORMANCE LEADER
US equities have performed very strongly in the post-crisis period, with the S&P 500 index more than tripling since the low point of 2009 (see chart 1). This strong performance has reflected both a recovery in the US real economy that has boosted corporate earnings and an improvement in investor sentiment against a backdrop of unprecedented central bank stimulus.
US equities effectively decoupled from global equities in late 2011 (see chart 1) and subsequently performed much better. While valuations expanded as investors were prepared to put a higher multiple on US earnings, subsequent strong earnings justified this view. Chart 2 below shows that the US has delivered significantly better earnings since late 2011 and this has been a key factor underpinning the superior performance of US equities over the period.
However, while US earnings growth has been robust, it is also true that in the last three years, equity prices have expanded at a faster pace than earnings, resulting in significant price-earnings multiple expansion that discounts further strong earnings growth. The key question then is: are US equities overvalued? We examine the evidence.
Chart 1: US equities have outperformed the rest…
Source: MSCI, Bloomberg, NBER; Minack Advisors, December 2014
Chart 2: …because earnings (EPS) have been higher
Source: MSCI, IBES/DataStream, NBER; Minack Advisors; Rolling 12m EPS (operational earnings), December 2014
40 50 60 70 80 90 100 110 120 130 140 150 2007 2008 2009 2010 2011 2012 2013 2014 2015 2016 J A N U A R Y 2 0 0 7 = 1 0 0
MSCI All countries ex-US (+97% since '09 low) S&P 500 (+198% since '09 low) 40 50 60 70 80 90 100 110 120 130 140 40 50 60 70 80 90 100 110 120 130 140 2007 2008 2009 2010 2011 2012 2013 2014 2015 2016 J A N U A R Y 2 0 0 7 = 1 0 0 S&P 500
TRADITIONAL SHORT-TERM VALUATION MEASURES ARE REASONABLE
US equities are trading only slightly above long-term averages on most traditional valuation measures, yet only by a modest amount, meaning the market is still close to fair value.
Price/Earnings - The current trailing PE ratio of 19.2 is only slightly above the 30-year
average of 18.4 (see chart 3). Moreover, since US earnings are expected to continue growing robustly in 2015, the forward PE ratio is lower at 18.0 and only modestly above the 30-year average of 16.4. There is scope for further multiple expansion; a strong dollar tends to be correlated with a rising PE as capital flows to US assets.
Price/Book - Chart 4 tells a similar story, with the current price-to-book ratio of 2.6
only slightly above the 30-year average of 2.4. It’s worth remembering that price-book-ratios convey little about the composition of US balance sheets. Yet from other sources, we know that US balance sheets are in very robust shape. For example, the current cash-to-assets ratio of non-financials is around 12%, a record high level and well above the long term average of 6.7%.1
Dividends - dividends are another useful valuation guide. Despite large price gains,
the S&P 500’s current dividend yield of 2.0% has held up well thanks to strong dividend growth; notably it remains above the US 10-year Treasury yield of 1.8%. 239 of the S&P 500 constituents are currently yielding more than the Treasury yield and 87 stocks are yielding considerably more at over 3.0%.2
Chart 3: US equities: price-earnings-ratio
Source: IBES/DataStream, January 2015; Black line is avg., grey lines SD bands
Chart 4: US equities: price-book-ratio
Source: IBES/DataStream, January 2015; Black line is avg., grey lines SD bands WHAT DO CYCLICALLY ADJUSTED EARNINGS TELL US?
An issue with simple, snapshot estimates of valuation such as book and price-earnings ratios is they can be skewed by unusual one-off events that either unsustainably boost or deflate earnings. An established technique for accounting for this cyclicality in earnings was developed by Professor Robert Shiller of Yale University. Corporate earnings are ‘normalised’ for cyclicality by taking the average of the last 10 years’ earnings instead of focusing on the most recent year. As Chart 5 shows, on this
measure, US equities do appear overvalued with a current CAPE Ratio of 26.8 above the 30-year average of 23.4.
Chart 5: Shiller Cyclically Adjusted Price-Earnings Ratio (CAPE)
Source: Robert Shiller, http://www.econ.yale.edu/~shiller/data.htm, January 2015
0 2 4 6 8 10 12 14 16 18 20 22 24 26 28 30 32 34 1985 1989 1993 1997 2001 2005 2009 2013 P ri c e -t o -e a rn in g s r a ti o
Curent P/E ratio = 19.2 30-year average = 18.4 Bargains Undervalued Overvalued Very overvalued 0 0.5 1 1.5 2 2.5 3 3.5 4 4.5 5 5.5 1985 1989 1993 1997 2001 2005 2009 2013 P ri c e -t o -b o o k r a ti o Curent P/B ratio = 2.6 30-year average = 2.4 Very overvalued Overvalued Undervalued Bargains 0 5 10 15 20 25 30 35 40 45 50 1991 1993 1995 1997 1999 2001 2003 2005 2007 2009 2011 2013 2015 P ri c e -Ea rn in g s R a ti o ( C A PE, (P /E 1 0 )
Current CAPE level = 26.8 15-year average = 25.5
30-year average = 23.4
50-year average = 19.7 Average since 1881 = 16.6
Issues with CAPE
However, there are three important mitigating factors that investors should bear in mind when considering cyclically adjusted earnings:
A 10-year earnings averaging technique fails to account for the fact that over the long run, real earnings exhibit an upward trend — the failure to adjust for this tends to overstate current CAPE compared to historical averages.3
Second, inferences are sensitive to the reference periods selected — Chart 5 shows the gap between the current US equity CAPE of 26.8 and the long term average CAPE lessens progressively as the historical comparison window period is narrowed, to the point where this gap is almost eliminated when compared to the higher 15-year average CAPE of 25.5. This might also indicate the presence of structural effects that support higher CAPE ratios over time and in the last 15-30 years particularly.
Third, CAPE does a poor job of accounting for one-time substantial balance sheet write-off periods that depress earnings not just for an occasional year but over multi-year periods, as was the case in the post 2008 crisis aftermath. Failure to account for the above issues means that CAPE can give inaccurate signals. Indeed, it is worth noting that the CAPE has been indicating that US equities have been overvalued since late 2009, since when the S&P 500 index has rallied by over 100%.
“Current US equity valuations
reflect strong cash flows and
profitability and are therefore
by no means excessive. It is
true that the CAPE measure is a
little higher but on the whole,
the kinds of valuations we see
today are not the kinds of ones
we typically see at market
peaks.
Investors also shouldn’t forget
the current very favourable
backdrop — companies are
increasingly using their healthy
balance sheets to boost
dividends and share buybacks,
as well as growing CAPEX from
very low levels and engaging in
M&A activity.”
Angel Agudo
Portfolio Manager, US Equities
VALUATIONS MUST BE SEEN IN THE CONTEXT OF PREVAILING CONDITIONSValuations should be considered in the context of the current and expected operating environment for US companies. It is possible to place too much weight on long-term averages if conditions are better-than-average for earnings growth. As investors, we need to understand the different environments in which higher or lower valuations may be appropriate. In this respect, the current monetary context of zero policy rates and very low bond yields is highly unusual. There are two main valuation-supportive effects of this monetary environment:
Real economy impact: record low interest rates and bond yields benefit the real
economy through lower borrowing costs for consumers and businesses, resulting in a more favourable macro backdrop for growing corporate earnings and profit margins. This should permit higher equity valuations.
Financial impact: Very low interest rates and yields have a financial impact as
lower discount rates are applied to future corporate cash flows as well as forcing investors to look for more attractive sources of yield. With bond yields so low, demand for dividend-paying equities has increased, supporting market valuations.
RELATIVE VALUATION PERSPECTIVE: THE FED MODEL
Comparing the attractiveness of bonds versus equities leads us to a relative valuation measure known as the ‘Fed Model’. This compares the market’s earnings yield, which is the inverse of the price-earnings ratio, to 10-year Treasury yield bond yields (see Chart 6 below).
Chart 6: US earnings yield v US Treasury yield - the ‘Fed Model’
Source: DataStream, January 2015
“We have been overweight US
equities since 2011 and remain
so on the back of structural
improvements.”
Eugene Philalithis
Asset Allocation Director,
Fidelity Solutions
0.0 2.0 4.0 6.0 8.0 10.0 12.0 14.0Jan-85 Jan-89 Jan-93 Jan-97 Jan-01 Jan-05 Jan-09 Jan-13
%
US Earnings yield (%) US 10 yr Treasury yield (%)
The gap between the earnings yield and US Treasury yields remains sizeable compared to the past
In its strongest form 4, the Fed Model argues that the equity earnings yield and the 10-year Treasury yield should be in equilibrium and that equities are cheap compared to bonds when the earnings yield exceeds the Treasury yield and vice versa. The premise is that bonds and equities are essentially competing investment products, and investors should show a preference for whatever asset is yielding the best return. As the chart above shows, while the gap in favour of the US earnings yield has narrowed in the past few years, it remains substantial at almost 3.4% and well above the long-term 30 year-average of 0.2%.
RELATIVE VALUATION PERSPECTIVE: ECONOMIC VALUE ADDED (EVA)
An alternative relative valuation perspective can be gained from the Economic Value Added (EVA) measure. As the formula below shows, this is calculated by multiplying total capital (K) employed by the weighted average cost of this capital (C) and deducting this amount from net operating profit after taxes (NOPAT). If the resulting dollar figure is positive then the company or market is creating ‘economic value’ because the return it generates exceeds the cost of capital.
Proponents of the EVA measure argue it is superior to other measures such as EPS, EBITDA or sales growth because it considers the key additional dimension of the cost of capital which varies across countries. In this sense, EVA can be considered as a risk-adjusted measure, since profits generated entail differential risks that are reflected in correspondingly different costs of capital.
Figure1: Economic Value Added formula
EVA = (R-C)* K = NOPAT - (C*K)
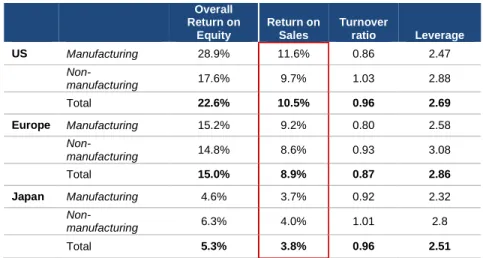
As depicted above, EVA can also be re-stated as the rate of return on capital employed (R) minus the weighted average cost of capital (C) multiplied by the total capital employed. The advantage of this method is that it emphasises that economic valued added depends critically on the extent to which the rate of return on capital exceeds its cost. Return on capital includes both returns to equity (i.e. ROE) and debt. The table below featuring a decomposition of returns shows that US companies lead the world in terms of ROE. Given similar levels of asset turnover and leverage, the critical difference is profitability, with returns on sales materially higher among both manufacturing and non-manufacturing US companies.
There any many potential factors that can be put forward for the superior ROEs of US companies. One plausible explanation is simply the fact that the US is home to more highly successful brands any other country. For example, 7 of the top 10 global brands, including the top 5, are US companies, while 14 of the top 20 brands are also American.5 Persistently higher ROEs should drive higher total shareholder returns, lending
substantial support to the case for higher relative valuations for US stocks.
Table 1: Higher US ROES justify higher relative valuations
Overall Return on Equity Return on Sales Turnover ratio Leverage US Manufacturing 28.9% 11.6% 0.86 2.47 Non-manufacturing 17.6% 9.7% 1.03 2.88 Total 22.6% 10.5% 0.96 2.69 Europe Manufacturing 15.2% 9.2% 0.80 2.58 Non- manufacturing 14.8% 8.6% 0.93 3.08 Total 15.0% 8.9% 0.87 2.86 Japan Manufacturing 4.6% 3.7% 0.92 2.32 Non-manufacturing 6.3% 4.0% 1.01 2.8 Total 5.3% 3.8% 0.96 2.51
Source: Ito Review (August 2014). Based on business results of 2012 CY. Financial and real estate industries are excluded. Companies were those included in the TOPIX 500, S&P 500, and Bloomberg European 500 & whose data were available. Based on an original analysis by Misaki Capital Inc.
While US equity valuations get strong support from the returns perspective, what about the cost of capital side - the other key element in the EVA framework? Chart 7 below depicts a proxy for the overall cost of equity by summing the 10-year Treasury yield and the equity risk premium - the amount of additional compensation required by investors to hold equity rather than debt 6. This shows that the implied cost of equity in the US has come down greatly over the last 30 years, mainly as result of a structural decline in Treasury yields. With the cost of debt also coming down, again in large part due to declining Treasury yields, the trend in the overall cost of capital has clearly been favourable for US valuations.
Chart 7: Implied cost of US equity
Source: Goldman Sachs, January 2015; ERP denotes equity risk premium
While the declining cost of debt and equity provide support for US equity valuations, other regions have experienced similar downtrends in bond yields albeit not to the same extent. However it is possible to make the case that the US’s very low political risk and favourable business environment (e.g. its excellent property rights protection framework) imply cost of equity and cost of debt discounts compared to most other regions.
ARE US COMPANIES GETTING ‘STRUCTURALLY MORE PROFITABLE’?
An oft-cited source of concern regarding US equity valuations relates to record high profit margins and the possibility that these will revert towards the mean. Chart 8 below shows the share of US corporate profits as a proportion of GDP rose to its highest ever level in 2013. Is this is a cyclical (and therefore mean-reverting) trend or a structural trend? Chart 9 below demonstrates the very distinct and sustained downtrend in the share of wages in US GDP since the 70s. This provides good evidence for the claim that structural factors are at play.
With the share of wages in US GDP declining over a very long period, the principal beneficiaries has been US companies, whose profitability is enhanced, supporting the case for higher average valuations (whether PE or CAPE) compared to the past.
Chart 8: US profits share at a record high as % of GDP
Source: US Bureau of Economic Analysis, January 2015, * corporate profits series used includes inventory valuation and capital consumption adjustments
Chart 9: US labour share at a record low as % of GDP
Source: US Bureau of Economic Analysis, January 2015
0.0 2.0 4.0 6.0 8.0 10.0 12.0 14.0 16.0 18.0 1981 1985 1989 1993 1997 2001 2005 2009 2013 %
10Y (a) ERP (b) Implied cost of equity (a+b)
6 7 8 9 10 11 12 13 1947 1953 1959 1965 1971 1977 1983 1989 1995 2001 2007 2013 Corporate profits % of GDP At 12.5% of GDP, US corporate profits * accounted for their highest share ever in US GDP in 2013 40 42 44 46 48 50 52 1947 1953 1959 1965 1971 1977 1983 1989 1995 2001 2007 2013 %
wages & salaries % of GDP
The share of wages in US GDP is at an all time low of 42.6 % and well below the long term average of 47.3% (dotted line)
While the long term decline in wages in GDP is very clear to see in Chart 9, the case for this being a structural trend that will persist in the future is strengthened if we can posit sustainable explanations. In our view, there at least are at least three very plausible drivers of declining wages that are unlikely to reverse anytime soon:
1) As a result of globalisation, not only is the addressable end market for US businesses increasing, but the accessibility of global labour supply is also improving, putting downward pressure on wages in many industries. There are many facets to this, but one good example is the trend among US companies to outsource IT functions to India and/or Indian nationals at significantly lower cost.
2) Technical progress: this is an important factor that allows US companies to produce goods and services more cheaply and effectively than in the past. The US is an acknowledged leader in many fields, especially in intellectual-property driven industries like pharmaceuticals, technology and software. A consequence of improving technology is reduced demand for human labour, putting further downward pressure on wages. Examples are the increasing use of automation, 3D printing and robotics in manufacturing.
3) Collective bargaining: Labour’s capacity for collective bargaining has reduced considerably in the past few decades. The rate of unionisation in the US labour force has fallen from over 20% in 1983 to 11.3% in 2013.7
CONCLUSION
After a sustained period of strong performance, US equity valuations have gone up significantly over the past few years. While strong earnings have been a key driver, multiples have also expanded considerably, raising concerns in some quarters about possible overvaluation. However, we found that:
US equities are only modestly overvalued on most traditional valuation measures, such as price-earnings and price-book ratios
US equities do appear overvalued based on the Shiller CAPE measure, but there are some important mitigating factors
The current unusual monetary context is highly supportive for US equity valuations
US equities are cheap on relative valuation measures such as the Fed Model The Economic Valued Added (EVA) perspective also lends strong support to US valuations owing to stronger returns on capital and low cost of capital
Higher valuations may be justified by evidence that US companies are becoming ‘structurally more profitable’ due to factors exerting downward pressure on wages. To sum up, the overall evidence suggests that US equities are fairly valued, not overvalued. Given the strong structural outlook for the US economy and corporate sector, valuations need not be an obstacle for further gains in US equities in the run up to the presidential election in 2016.
“I do not believe the
evidence supports the view
that US equities are
overvalued. On the contrary, I
believe that a positive
earnings and economic
growth outlook will ensure that
the US-led bull market
remains intact and that we
will see new highs in 2015.”
Dominic Rossi
REFERENCES
1. Goldman Sachs, November 2014 2. FWI analysis, Datastream, January 2015
3. ‘US equity valuations not an obstacle in 2014’, Pyramis Global Advisors, April 2014
4. The Fed Model is originally attributed to Ed Yardeni based on a statement by Humphrey-Hawkins in a US Federal Reserve report from July 1997
5. bestglobalbrands.com, January 2015
6. The Equity Risk Premium (ERP) provides a measure of the extra return required by investors to invest in equities compared to bonds, i.e. the return above the ‘risk-free rate’
7. US Department of Labour, January 2015
IMPORTANT INFORMATION
This document is for Investment Professionals only, and should not be relied upon by private investors.
It must not be reproduced or circulated without prior permission.
FIL Limited and its respective subsidiaries form the global investment management organisation that is commonly referred to as Fidelity Worldwide Investment. Fidelity Worldwide Investment only gives information on products and services and does not provide investment advice based on individual circumstances. Any service, security, investment, fund or product outlined may not be available to or suitable for you and may not be available in your jurisdiction. It is your
responsibility to ensure that any service, security, investment, fund or product outlined is available in your jurisdiction before any approach is made regarding that service, security, investment, fund or product.
Past performance is not a reliable indicator of future results. Returns may increase or decrease as a result of currency fluctuations.
Issued by FIL Investments International (FCA registered number 122170) a firm authorised and regulated by the Financial Conduct Authority. FIL Investments International is a member of the Fidelity Worldwide Investment group of companies and is registered in England and Wales under the company number 1448245. The registered office of the company is Oakhill House, 130 Tonbridge Road, Hildenborough, Tonbridge, Kent TN11 9DZ, United Kingdom. Fidelity Worldwide Investment’s VAT identification number is 395 3090 35.
Issuer in Germany: Issued in Germany by FIL Investments International - Niederlassung Frankfurt on behalf of FIL Pension Management, Oakhill House, 130 Tonbridge Road, Hildenborough, Tonbridge, Kent TN11 9DZ.
Issuer for Austria, Hungary, Slovakia and Czech Republic: FIL (Luxembourg) S.A., 2a rue Borschette, 1021 Luxembourg
Fidelity, Fidelity Worldwide Investment and the Fidelity Worldwide Investment logo and currency F symbol are trademarks of FIL Limited.
The availability of the investment discipline(s) and portfolio manager(s) proposed in this document is based on the situation at the time of submission and may be subject to change.
Reference in this document to specific securities should not be construed as a recommendation to buy or sell these securities, but is included for the purposes of illustration only. Investors should also note that the views expressed may no longer be current and may have already been acted upon by Fidelity Worldwide Investment.