IntroductIon
E
ven though it ranks among the American public’s greatest nui-sances, transportation planners and elected officials have done little to reduce traffic congestion. Indeed, to the extent that recent reports show traffic conges-tion has decreased in a few urban areas, credit primarily goes to the steep eco-nomic downturn, not to public policy or infrastructure investments. Cities, includ-ing Los Angeles and Washinclud-ington , D.C. , see few signs of decreasing traffic despite high unemployment and lower incomes.Moreover, while the economic reces-sion has temporarily taken traffic con-gestion off the front burner for elected officials, this is likely to change if the economy heats up at the end of 2009 and into 2010. The dip in vehicle miles traveled (VMT)—a common measure of
travel—will likely increase again as pent-up demand for travel and more fuel-effi-cient cars hit the roads. More vehicles on the same roads implies ever-climbing costs to American businesses, workers and families as it takes more time and fuel to get where we want to go.
Rising traffic congestion will signifi-cantly undermine the economic com-petitiveness of U.S. cities and regions unless policymakers earnestly try to reduce it. Perhaps part of the resistance to taking the bold actions necessary to reduce congestion is a lack of under-standing about how congestion nega-tively affects our cities and their com-petitiveness, and the benefits of achiev-ing free-flow travel on a regional scale. This study fills that void in the policy discussion by examining the economics of congestion relief. This study finds that reducing congestion can add billions of
G
ridlock
and
G
rowth
: t
he
e
ffect
of
t
raffic
c
onGestion
on
r
eGional
e
conomic
P
erformance
by David Hartgen and Gregory Fields
Policy Summary of Study No. 371
This is a policy
summary of a Reason
Foundation policy
study no. 371, titled,
Gridlock and Growth:
The Effect of Traffic
Congestion on Regional
Economic Performance,
available on reason.org.
By David T. Hartgen, Ph.D., P.E. and M. Gregory Fields Project Director: Adrian T. Moore, Ph.D.
August 2009
Gridlockand Growth: the effect of traffic conGestionon reGional
economic Performance
POLICY STUDY
dollars in additional productivity and output for cities. Free-flowing traffic increases regional productivity, which increases tax revenues. Most major cities will find that wise infrastructure investments that eliminate gridlock and produce free-flowing road conditions will more than pay for themselves by boosting the region’s economy, and thus tax revenues. Reducing congestion and increasing travel speeds enough to improve access by 10 percent to key employment, retail, education and population centers within a region increases regional production of goods and services by 1 percent. While seemingly small in percentage terms, this leads to tens of billions of dollars for a region’s employers and work-ers due to productivity and efficiency benefits.
the economIcs of traffIc
congestIon
For everyday travelers, the frustration of traffic is obvious. Understanding the impact on cities and the economy, however, is not as straightforward as many would like. From an economic perspective, congestion’s main impact is the lost productivity from more time spent traveling to work rather than working; delaying (or missing) meetings; foregoing interactions among individuals or personal activities due to long travel time; and spending more time to accomplish tasks than would otherwise be necessary if we could reliably plan for accomplishing the same things at free-flow speeds.
In short, a region’s economy does better when people spend more time working and doing things they find valuable and less time traveling to do them. We depend on our transportation system to provide access—access to people and places we want to go.
Accessibility can be defined several different ways. In this study, we define absolute accessibility as the number of residents or jobs reachable within 25 min-utes’ driving time from a given point, roughly equivalent to the average commute of the typical American worker.
Relative accessibility is defined as the percentage of regional residents or jobs within 25 minutes of a given point. Defined as such, absolute accessibility can (and will, due to increased population) increase, even as rela-tive accessibility falls when the population outside the urban center increases faster than inner-city population. For this study we compare these categories of accessibil-ity with the economic output of a given region.
We use a form of “gross national product,” or GNP, a commonly used measure of economic output (equal to the sum of the value of all goods and services pro-duced annually in the national economy) to measure economic output at the city level. Analogously, one can also think of a gross state product (GSP) or gross regional product (GRP) as the sum of the value of all goods and services produced annually by a state or urban region.
To determine the effect of congestion on GRP, we picked eight cities as representative examples, per-forming detailed modeling and analysis on each. The
results give a very good idea of the economic costs of congestion in the larger urban areas in the United States, and show the economic benefits cities can expect from making the transportation investments needed to solve congestion. The cities we analyzed to get these results were Charlotte, Detroit, Salt Lake City, Seattle, Denver, San Francisco, Dallas and Atlanta.
To determine how changes in regional economic performance related to accessibility, we first estimated the gross regional product of each region, proportional to state GSP and county income data for the base year. Dividing by the number of workers (jobs) in each region gives the regional productivity, or gross regional prod-uct per worker (job). These range from $81,700 for Salt Lake City to $125,400 for San Francisco.
The impact of severe traffic congestion on regional economies is significant. Removing today’s gridlock by building infrastructure and adding capacity to create free-flow traffic conditions throughout a region could boost productivity for workers by as much as 30 percent in highly congested areas. Moreover, congestion influ-ences different parts of the urban area in different ways. Infrastructure investments can be targeted at areas that will produce the most economic gains. Reducing congestion in major suburbs in Charlotte, for example, could net major productivity increases of 30 percent. Reducing congestion around a major university could boost productivity by nearly 20 percent. Excellent con-nectivity around the downtown and major malls, on the other hand, results in a smaller increase in productivity
of around 5 percent, or, in the Charlotte region’s case, about $5,000 per worker.
We found that urban areas with less congestion, such as Salt Lake City, would not experience dramatic improvements in productivity. Nevertheless, the region still benefits as the accumulation of improvements in travel flow boost regional productivity. In our analysis, major urban areas such as Seattle, Denver, San Francisco, Dallas and Atlanta would see dramatic improvements in regional economic performance if they achieved free-flow travel conditions on a regional level.
a new measure of how
congestIon costs urban
economIes
This report breaks new ground in several ways. Unlike many other reports of this type that use dis-tance, we use drive time to measure accessibility, for the most practical and accurate approach. First, we examine the impact of congestion on accessibility to key employment centers and destinations within an urban region, using a 25-minute drive time standard. The 25-minute drive time closely approximates the median peak-hour travel time for auto-mode commut-ers in major cities in the United States. This straight-forward measure relates directly to road speed and traffic congestion during peak hours. It is also has the benefit of being straightforward and comparable across
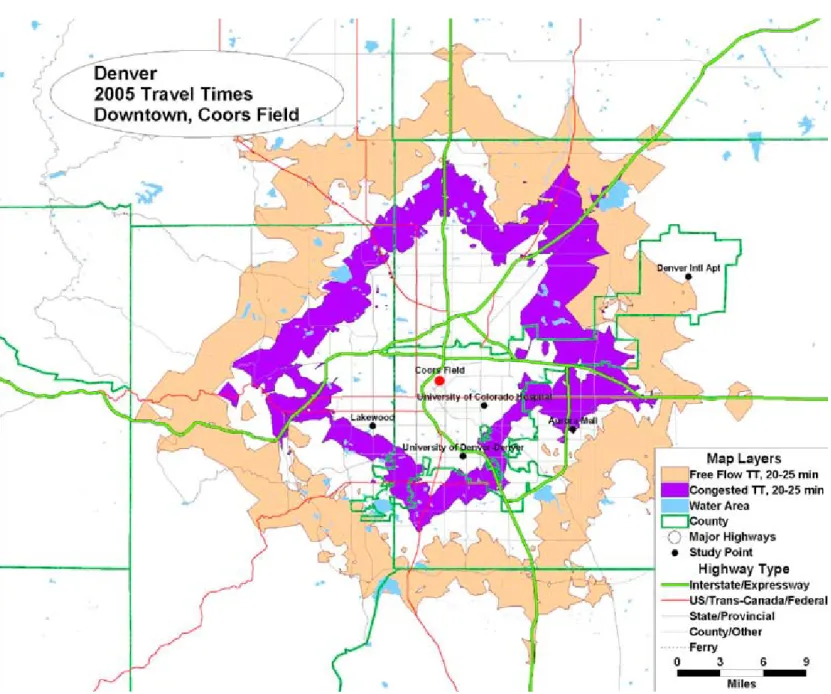
Figure 1: 25-Minute Travel Time in Downtown Denver from
Under Congested (Purple) and Uncongested (Beige) Conditions
regions and from year-to-year.
For instance, Figure 1 shows the area enclosed by 25-minute drive time from downtown Denver using Coors Field as the starting point for a trip. The beige area represents the additional parts of the region that could be accessed if congestion were eliminated today. The purple area represents the parts of the region have 25 minute access today.
An uncongested network of roads permits higher free-flow speeds and hence a larger area that can be reached in 25 minutes, particularly along major routes.
This results in a significant increase in the number of jobs or residents within 25 minutes of downtown—or other parts of the metro area. These increases could improve regional performance by reducing travel time and increasing the jobs available to residents, work-ers and customwork-ers available to employwork-ers. Drive time contours express changes in access as transportation systems improve. They determine and illustrate how cities are growing over time; how access is improving or worsening; and how future improvements might change access.
Unfortunately, the 25-minute drive time standard has limitations. It does not capture the much larger area that the majority of all travel in an urban region encompasses. Using a larger catchment area, and/or a longer commute time would probably strengthen our modeling results.
Thus, the study examines the effect of congestion— higher travel times and lower travel speeds—on the number or percentage of jobs or residents within a given drive time from a point. We measured drive time via the available highway networks of the regions, not local roads, and asked four key questions:
n How accessible are various points in urban regions? n How will the accessibility of these points change in
the future?
n What effect will removing congestion have on
accessibility?
n How would improving accessibility affect the
eco-nomic performance of the region?
Unfortunately, trying to examine the impact of improving mobility to all of the millions of individual points that make up an urban region was computation-ally impractical. So, we narrowed the field of locations down to a handful that we believe (and research sug-gests) are critical to a region’s economic growth. In our case, we examined congestion’s impact on accessibil-ity to five major points: downtown (central business district); a major suburb; a major retail center or mall; a major university; and a major airport. While these
points are certainly not the only major or important points in regions, they are indicative of the range of locations that allow the region to function economi-cally. They would also undoubtedly be chosen as start-ing points in local travel time studies.
The next step was to quantify how much current and future traffic congestion would increase through 2030, a typical end date for current long-range plans of urban areas. We could then estimate how improved mobility, or moving the region to free-flow travel, might affect the economic productivity of each region.
Our analysis was applied to eight specific cities— Charlotte, Salt Lake City, Seattle, Denver, San Francisco, Detroit, Dallas and Atlanta—that were chosen because they are representative of the challenges facing all U.S. urbanized areas of various sizes. The congestion prob-lems facing Dallas, Atlanta and San Francisco are well known and perhaps unsurprising given their large size. Detroit also ranks as one of the nation’s largest urbanized areas and its traffic congestion problems are as severe, albeit less well known. Denver and Seattle are growing rapidly, and traffic congestion is rising rapidly as well. Charlotte and Salt Lake City are mid-size cities that are growing rapidly, although they face less severe traffic congestion than their larger counterparts (Table 1).
All the urbanized areas except Detroit are expected to see congestion rise to the level already seen in today’s San Francisco by 2030 unless major improve-ments and corrections to transportation policy begin now. Dallas, Denver, Atlanta, Seattle and San
Fran-Table 1: Summary of Regional Traffic and Congestion Statistics
2003 Urban Area Expected 2030 Urban Area
Current Long-Range (2030) Trans-portation Plan Costs ($Billions)
Cost to Remove LOS F Congestion by 2030, ($B)
Region Pop, K Travel Time Index
(TTI)
Pop, K ttI Highway
costs Transit costs Total costs Charlotte 725 1.31 1,185 1.62 $4.7 $6.3 $11.0 $2.9
Salt Lake City 877 1.28 1,251 1.59 $3.2 $17.3 $23.0 $1.2
Denver 2,050 1.40 3,210 1.80 $53.9 $23.4 $87.8 $10.0 Atlanta 2,924 1.46 5,009 1.85 $29.6 $21.5 $53.0 $13.1 Seattle 2,946 1.38 3,963 1.79 $49.4 $46.3 $101.6 $4.8 Detroit 3,939 1.38 4,277 1.50 $31.5 $9.3 $41.0 $24.1 San Francisco 4,120 1.54 4,968 1.86 $47.0 $76.0 $118.0 $29.2 Dallas 4,312 1.35 7,014 1.73 $30.6 $13.5 $45.1 $26.4
cisco will see levels of congestion equivalent to today’s Los Angeles, home to the nation’s worst gridlock. If policymakers maintain the current course.
CongESTIon SIgnIFICAnTLy
REDUCES A CITy’S EConoMIC
growth
Regional road networks were provided by each region’s respective planning agency. Using points cor-responding to central business districts, universities, airports, major malls and major suburban locations, we then translated this data into a consistent format for ease of analysis. (The full report details each loca-tion’s economic and demographic characteristics.) We determined drive time contours for a base year and 2030 under both congested and free-flow conditions for each point. We then estimated regional productiv-ity, enabling us to examine the relationships between traffic congestion relief and regional productivity and their relative effects on major destinations in each metropolitan area.
Not surprisingly, the central business district, or CBD, was generally the most accessible place in each region, with typically 30 to 60 percent of jobs and 25 to 50 percent of residents within 25 minutes of downtown under current congested conditions. Other key points have typically one-third to one-half the percentage of CBD jobs or residents within 25 minutes. Our research
determined that in the future, rising traffic conges-tion and rapid suburban growth together mean that key points in most regions will become relatively less accessible than they are now. The reduction in access is typically 1 to 10 percent. But removal of conges-tion would increase the access to key points by 2 to 30 percent, allowing most regions to reverse the expected decline in access and making these key points relatively more accessible as the region grows.
The study also found that a 10 percent worsening in CBD accessibility would decrease regional produc-tivity by about 1 percent, about the same as observed in Europe and Korea in previous studies. Contrary to conventional planning wisdom, the research suggests that regional economies might be more dependent on access to major suburbs, malls and universities than on access to downtowns or airports. Not only are models of productivity somewhat stronger for these sites than for CBD accessibility, but access to them has a stron-ger effect on regional productivity. Solving congestion would boost gross regional performance by 6 to 30 percent if targeted at suburbs, malls and universities, but 4 to 10 percent if targeted at CBDs, and just 2 to 8 percent if targeted at airports.
Over 20 years, the additional tax revenues generated by the productivity gains caused by accessibility improve-ments could be several times larger than the estimated cost of the infrastructure needed for congestion removal. Free-flow travel boosts productivity. Higher productiv-ity generates higher tax revenues and increases property
t
able 2: Sample of Increased Economic Productivity and Tax Revenues With Free-Flow Conditions
Urbanized Area Location with Largest Benefit from Congestion Reduction
Potential Annual Increase in GRP With Free-Flow Traffic
Condi-tions Around Location ($B)
Potential Increase in Tax Revenues Over 20 Years
as a Result of Free-Flow Conditions and
Increased GRP ($B)
Estimated Cost to Remove Severe Regional
Traffic Congestion by 2030 ($B)
Atlanta Major Suburb $15.4 $21.5 $13-15
Charlotte Major Suburb $22.5 $31.5 $3-5
Dallas Major University $46.0 $64.4 $26-30
Denver Major Mall $38.5 $53.8 $10-15
Detroit Major Suburb $7.3 $10.3 $25-30
Salt Lake City Major Suburb $0.7 $1.0 $1-2
San Francisco Major Mall $10.7 $15.0 $29-40
values from land (and buildings), which then generate even more tax revenues. Notably, in five of the eight cities studied, the projected additional tax revenues resulting from free-flow travel condtions around one key location would likely produce more than enough revenues to pay for the projected costs of removing congestion across the entire region (see Table 2). Since lower congestion improves access throughout the region, the productivity improvements resulting from free-flow conditions could generate tax revenues more than sufficient to pay for the transportation improvements necessary to remove severe congestion. This analysis suggests that the focus of transportation plans on central business district access, and to a lesser extent airport access, may be misplaced, as regions grow and other locations become relatively more congested. It suggests focusing on congestion reduction particularly in non-CBD locations, reflecting today’s more complex and dynamic suburb-to-suburb employment and travel patterns.
The results from our analysis, averaging all regions studied, shows that reducing congestion and increas-ing travel speeds so that accessibility increases 10 percent would increase regional economic productiv-ity by about 1 percent. The impact on productivproductiv-ity was stronger for employment than residential population. In other words, the benefits of congestion reduction will be driven primarily by providing better access to jobs and workers than by improved access to residen-tial locations. For example, a 10 percent improvement in access to the downtown central business district would produce about a 1.1 percent increase in produc-tivity because workers (and businesses) would be able to access a larger number of jobs (and workers).
In addition, our estimates suggest that access to major malls (as job sites) is at least as, and probably even more, influential in determining regional produc-tivity than access to the CBD. Reducing congestion to improve access to a mall by 10 percent would gener-ate a productivity improvement of about 1.7 percent. Improved access to major suburbs tended to have productivity improvements in the range of 1.3 percent to 1.6 percent, lower than for universities but higher than CBDs. Improved access to universities had among
the strongest impact on regional productivity, ranging from 1.3 percent to 1.8 percent.
Importantly, throughout our analysis, access to jobs seems to be more important in regional economic performance than is access to population. Not only is the impact on regional productivity greater, but the impact from congestion removal is greater when viewed through a job prism rather than a resident prism. Regions depend on fluid movement between jobs and other locations like malls and universities. Many people come to malls and universities from work sites, not from home.
recommendatIons
Congestion reduction should be a central element of a regional economic development strategy in U.S. cities. More specifically, policymakers at the federal, state and local levels should:
1. Recognize that congestion shrinks the range of job opportunities for local residents and limits local access to workers by businesses. City leaders and plan-ners have long been aware that congestion wastes fuel and time, and is also a drag on the productivity and growth of the regional economy as well.
2. Pay more attention to the accessibility of other locations, not just downtowns or central business districts.
Improving accessibility or improving regional performance at a fraction of the cost of improving CBD access.
3. Improve accessibility around job centers in major suburbs, retail centers and universities.
These locations showed the most potential for access improvement and significant positive impact on regional productivity.
4. Remove specific bottlenecks throughout regions. Relatively modest expenditures to remove bottlenecks in a road system can have a substantial impact on accessibility, particularly if congestion is concentrated geographically. These locations should be explored first for improvement.
5. Add capacity in the rims of cities, where major suburban job and retail centers are located. Our find-ings suggest that investment in suburban accessibility
is likely to be productivity-gaining. Not only is access likely to improve more per dollar invested than in the CBD, but future growth is likely to be higher.
6. Conduct an accessibility assessment for each city. From a planning perspective accessibility studies are a convenient way of understanding the impact of congestion removal and of comparing alternate treat-ments. They are under-used in transportation planning, however, because until recently they were difficult to undertake. New software has made the task easier.
7. Reconsider arguments against sprawl. This study suggests that an overlooked benefit of congestion reduction is the ability to improve accessibility. This finding dents the planning wisdom that higher density will yield greater productivity and is therefore pref-erable. Adding the benefits of greater access may be sufficient to tip arguments in favor of greater, not less, highway access.
about the authors
David T. Hartgen, Ph.D., P.E. is Emeritus
Pro-fessor of Transportation Studies at the University of North Carolina at Charlotte. The author of more than 300 studies on transportation policy and planning, he established UNC Charlotte’s Center for Interdisci-plinary Studies in 1989 and now conducts research in transportation policy and planning.
M. Gregory Fields is a graduate student at the University of North Carolina at Charlotte pursuing a Ph.D. in georgraphy and urban-regional analysis. He earned his B.S. from the U.S. Military Academy and M.A. from Webster University in St. Louis and UNC Charlotte.
RELATED REASon STUDIES
Robert W. Poole, Jr., Miami Toll Truckway: Pre-liminary Feasibility Study, Reason Foundation Policy Study No. 365, November 2007, http://www.reason. org/ps365_miami_truckways.pdf
Ted Balaker, Why Mobility Matters to Personal
R
eason Foundation’s mission is to advance a free society by developing, applying, and promoting libertarian prin-ciples, including individual liberty, free markets, and the rule of law. We use journalism and public policy research to influence the frame-works and actions of policymakers, journalists, and opinion leaders. Reason Foundation’s non-partisan public policy research promotes choice, competition, and a dynamic market economy as the foundation for human dignity and progress. Reason produces rigorous, peer-reviewed research and directly engages the policy process, seeking strategies that emphasize cooperation, flexibility, local knowledge, and results.Reason’s transportation research and com-mentary is available online at reason.org.For additional information about Reason Foundation’s policy work, please contact Robert Poole Director of Transportation Studies bob.poole@reason.org.
For media inquiries, contact Chris Mitchell, Director of Communications at (310) 367-6109 or chris.mitchell@reason.org
Life, Reason Foundation Policy Brief No. 62, July 2007, http://www.reason.org/pb62.pdf
David T. Hartgen and Ravi K. Karanam, 16th Annual Report on the Performance of State Highway Systems (1984–2005), Reason Foundation Policy Study No. 360, June 2007, http://www.reason.org/ps360.pdf
Peter Samuel and Robert W. Poole, Jr., The Role of Tolls in Financing 21st Century Highways, Reason Foundation Policy Study No. 359, May 2007, http:// www.reason.org/ps359.pdf
Alain Bertaud and Robert W. Poole, Jr., Density in Atlanta: Implications for Traffic and Transit, Reason Foundation Policy Brief No. 61, April 2007, http:// www.reason.org/pb61_atlanta.pdf
Robert W. Poole, Jr., Reducing Congestion in Atlanta: A Bold New Approach to Increasing Mobil-ity, Reason Foundation Policy Study No. 351, Novem-ber 2006, http://www.reason.org/ps351.pdf