Available online throug
ISSN 2229 – 5046
DISTRIBUTED POWER GENERATION IN REMOTE VILLAGES – AN IDEAL HYBRID MODEL
PROPOSED TO BE REALIZED WITH THE OPTIMUM MIX OF ADVANCED AND
APPROPRIATE RENEWABLE TECHNOLOGIES
S. P. Singh
1& B. P. Gupta
2*
1
Prof. and Head, School of Energy & Environmental Studies, D. A. V. V, Indore, India.
2
Prof. Vidhyapeeth Institute of Sc. & Tech. Bhopal, India.
(Received on: 25-11-13; Revised & Accepted on: 26-12-13)
ABSTRACT
A
n ideal hybrid power supply model for meeting the minimum energy needs of remote rural villages is proposed to be based on the inputs locally available in plenty, efficient conversion route, selection of cost effective devices using appropriate and efficient technology, less GHG emissions, high efficacy lighting lamps, appropriate equipments capable of expansion to meet increasing energy demands of the society and the village in a phased manner. The system should use minimum or zero quantity of fossil fuels. It should have provision for better and efficient use of waste land to accommodate petro crops, aquatic crops and fodder cultivation so that animals, plants and micro-organisms could also become part of the power system. As time passes away the system should gradually attain sustainability and green power producing status. As far as possible it should not only follow bio-methanation route to produce biogas for power production but also produce good bio- manure to meet agricultural demand of bio-fertilizer along with reduction in use of chemical fertilizers. If oil seeds and other components of Jatropha Curcus excluding wood are directly converted to biogas the overall energy yield is more than the total yield of energy from biodiesel and biogas from de-oiled cake combined to gather energy option. This system when clubbed with solar photovoltaic and animate power plants would form an ideal hybrid power supply model to meet the power demand of the remote villages in energy efficient, economical and eco-friendly manner.Key words: Village Electrification through Renewable Systems, Renewable Systems, Standalone Systems, Hybrid Energy Systems,
1. INTRODUCTION
In order to ensure supply of grid quality power in far flung scattered hamlets/ huts/ dwellings and villages through advanced and appropriate renewable energy technologies as a sustained solution, a very serious consideration and attention should be paid to the selection of resources very wisely. These resources could either be constantly supplied due to continuous availability and abundance or could be developed in a phased manner to supplement and sustain the system due to availability of other resources like waste land, water bodies etc. If number of renewable resources is more than one, then we must preferably select the resources that have higher exergy, higher efficiency, and lower cost of conversion, ease of operation, lower running and maintenance cost of the system and least or zero GHG emissions.
Availability of renewable energy sources like Solar insolation, Wind, Perennial rivers/streams with water flow rate, Water, Waste water, Biomass, Cattle population etc are to be explored and as far as possible authentic data pertaining to these resources should be mined, gathered and stored in a classified manner so that retrieval of the same could be done whenever necessary for proposing and designing the better alternative to energy/power supply.
Availability of wasteland, land area under cultivation (Irrigated & Un-irrigated), water bodies, if any, cropping pattern, use of chemical fertilizers along with consumption pattern should also be recorded with other demographic and vital statistical details of the village so that availability of biomass and possibilities of energy plantation, petro-crop plantation, fodder cultivation, establishment of algae ponds / algae production plant, Oil extraction plant, Bio-diesel plant, High rate Institutional biogas plants, Animate power plant, H2 plant, Producer gas plant etc could be explored and incorporated in the model project.
Corresponding author: B. P. Gupta
2*
IJMA- 4(12), Dec.-2013.
Based on the local availability and future potential of resources in sufficient quantities sustained distributed generation system (DGS) could be envisaged/ selected so that operational and maintenance (O & M) cost, green house gases (GHG) emission could be minimized. In general distributed power generation is defined as generation of power at the point of use. The size of the plant may be a few watts to Megawatts. In literature survey of DGS, it was noticed that there might be as many definitions of DGSs as there are authors. If this power is generated through the use of renewable sources only, then it is termed as Green Power.
DGS can be broadly classified according to the use it is subjected to like Domestic, Community, Agricultural / Industrial or for any other specific purpose and accordingly it could be sized. Based on the use of single or multiple resources or technologies, nomenclature of DGS can be done. If only one resource, i.e. Solar Photovoltaic is used, it may be named as SPV Lantern, Home Lighting, Community or Street Lighting System or as the case may be. If two or more resources are clubbed then it is termed as Hybrid Distributed Generation System (HDGS). These systems are also known as Integrated Energy Systems/ Stand alone Energy Systems or Isolated Energy Systems.
1.1 Hybrid Energy System: It could be a combination of any of the following two or more Renewable and/or Traditional systems including allied controlling, utilization, monitoring and other management systems like Central Grid Connected, Off-grid, Mini/Smart Grid connected or Dedicated grid connected or a combination of the same taking into account the transmission of power;
1.2 Energy/ Fuel /Power Production Units.
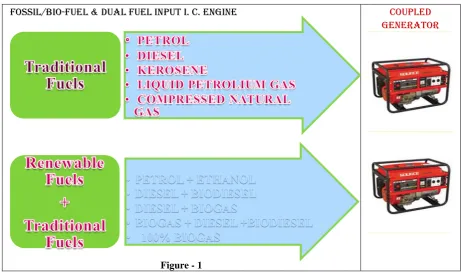
1. Power Generators – Fuelled by LPG, CNG, Petrol, Diesel, Kerosene
2. Power Generator (Dual Fuel) – Petrol + Ethanol, Diesel + Biogas, Petrol + Biogas, Producer gas + Diesel, Diesel + Biodiesel, 100% Bio-fuels /Biogas
3. Solar Photovoltaic Power System
4. SPV Home and Street Lighting Stand-alone Systems along with SPV Water Pumping Systems and Small Power Pack for community applications,
5. SPV Power Plant for households and community application through mini grid supply, 6. Mini, Micro and Small Hydro Power Plants through Mini Grid Application
7. Biomass based Power Plants [Thermal combustion) / Gasification / Bio-methanation- through Thermo-chemical / Bio-Thermo-chemical/Biological route)]
8. Power Plant based on solid Biomass (wood, briquettes etc.) Combustion.
9. Power Plant based on Combustion of agricultural residue like rice husk, ground nut shell, paddy- straw etc. 10. Power Plant based on Biomass Gasification (wood, agricultural waste etc.).
11. Biogas Power Plants (Using biogas produced through biochemical or biological fermentation / bio-methanation of solid/ semi solid biomass i.e. poultry, piggery, cattle droppings, de-oiled cake of non-edible oil seeds and other plant components, blue, green or micro algae, water hyacinth etc.
12. Bio-diesel Plant for production of bio-diesel from non-edible oil seeds, used edible oils and algae oil etc 13. Mini Animate Power Plants (Using Muscle Power of Animals)
14. Aero-generator Systems
15. Cogeneration Power Plant (Combined Heat and Power)
1.3 Energy Storage Systems/Devices 16. Hydrogen Production Plant 17. Fuel Cells
18. Battery Bank, Super Capacitors, Over-head Water Tanks
1.4 Power Transmission and Distribution /Supply Systems/Single Phase/3 Phase
19. Central Power Grid Tied (Grid Connected Systems with outgoing and incoming power meter and other allied systems)
20. Mini Grid
21. Mini Dedicated Grid 22. Mini Smart Grid 23. Transformers
1.5 Energy Management and Utilization Systems 24. Invertors
25. Rectifiers 26. Stabilizers
27. Power Conditioning Equipment and Smart /Intelligent Controller, Maximum Power Point Controller 28. Online Monitoring System
2.0 SELECTION OF APPROPRIATE RESOURCES, SYSTEMS/DEVICES AND COMPONENTS
The size and optimum mix of the Hybrid Distributed Energy Generation Systems must be decided on the basis of local availability of various renewable energy resources and power requirement/ demand of the community. The selection of the resources, systems/ devices and utilization of energy should be broadly based on;
1. Efficiency of Conversion, 2. Economy and
3. Environment friendly Provisions of the Systems/Devices.
Keeping these points in view the efficient use of the resources with optimum initial investment, selection of efficient and appropriate technology for conversion of resources to useful energy, mitigation of green house gases, demand and supply of power including peak demand, economy and ease of operation and maintenance, and sustainability of the project, one or more of the following transformation routes, methods, suggestions could be utilized to design and size the system;
2.1 Various Routes of Power Production from Internal Combustion Engines Coupled to Generators.
Fossil/Bio-Fuel & Dual Fuel input i. c. engine
Figure - 1
coupleD geneRatoR
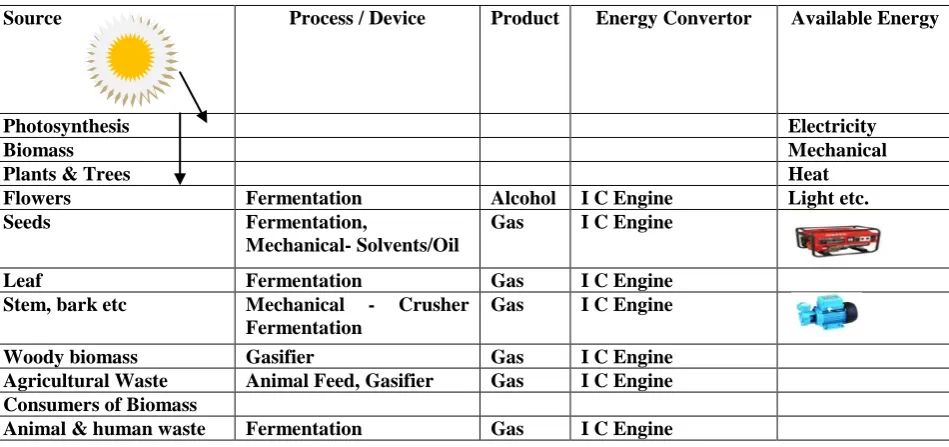
2.2 Various Energy Sources and Their Transformations (Table 1)
Energy chain for some energy systems, from “initial sources” to final uses, depicted in Table 1, is typically used for analysis of various energy systems.
Prime Source Primary Sources
Energy Transformation
End Energy End Energy Transformation
Useful Energy
Sun
Solar Radiation
Solar Collectors Thermal Devices Heat Heat Photovoltaic
Systems
Solar Cell, Module Solar Module Array
Electricity Electricity
Sun & Earth Atmosphere
Photosynthesis* Plants & Animals Food/Biomass
Food, Fodder & Fuel
Food, Fodder & Fuel
Wind Aero-generator Windmill/pump
Electricity, Mechanical
Electricity, Mechanical
Hydro Hyd-el Power
Station. Watermill
Electricity, Mechanical
Electricity, Mechanical Earth & Sun Geothermal
Energy
Heat Pump Heat Electricity
IJMA- 4(12), Dec.-2013. Radio Active
Substances
Atomic Energy Heat Electricity
Heat Electricity Fossil Fuels Refinery,
Power Plant
Coal Petroleum
Products Natural Gas
Boiler, IC engine, Gas Turbine
Heat Electricity,
Mech. Power, (automobiles) Earth & Moon
Tidal Energy
Power Plant Electricity Electricity
*Detailed chart depicted on next page
In villages of Madhya Pradesh (M.P.) generally energy could be supplied mainly by using solar thermal, solar photovoltaic, biomass, bio-fuels, mini animate power plants (Using Muscle Power of Animals) and fossil-fuels conversion systems. Possibility of using wind, hydro, geothermal energy is limited to resource availability and strength/ capability of the resource round the year as per minimum requirement of devices being promoted or available in the market.
In remote villages of M.P. where availability of waste or barren land is still in plenty, development and use of various types of biomass for energy production is a promising alternative which could sustainably manage energy supply and demand of the villages in an economically and eco-friendly manner. Processing of biomass through bio-methanation route as far as possible is one of the better options as we not only get energy but also good bio-manure which could help a lot in nutrient recycling of the soil and reduce the use of chemical fertilizers that ultimately could save huge amount of money and energy used in the production and movement of Chemical fertilizers. Growing aquatic biomass such as water hyacinth, blue green algae, micro-algae (mono-cell or multi-cell) etc. require very less land (under water) and time period for production of per kg of aquatic biomass as compared to terrestrial biomass. This is clear from the data depicted in the Table-2 given below;
2.3 Comparison of Bio-diesel Production from Algae and Oil Seeds Plants(Table 2) [18],[19],[26]
Item Bio-diesel Produced from Algae Bio-diesel Produced from Plants Technology Cell Bioengineering, Automatically Produced in
a Pilot Plant
Agriculture in Farm
Production Period 5 -7 days for a Batch Cultivation Several Months or Years Oil Content More than 40 -50 % in whole cells Less than 20 % in seeds or fruits Land Occupied
0.010 -0.013 hectare for Producing 1000 L Oil a
2.24 ha for Producing 1000 L Oil b
Cost $2.4 per liter micro algal Oil $0.6 -0.8 per liter plant seeds oil Performance Unlimited (Work just beginning) Limited (Many works have been done
a. Based on Projected area of Bioreactor in Pilot Plant b. Based on Soybean Cultivation in farmland
Biodiesel is gaining acceptance in the market, however, various aspects and teething troubles must be examined and overcome. Some of the key issues such as improving the efficiency of production process, using low cost feed stock, developing cost effective catalyst and managing agricultural land out of available waste land should be seriously considered. [18], [19]
2.4 Catalyst for Transesterification of Non-edible and Other Oils.
Transesterification of oils is catalyzed by acid, alkalis and lipase enzymes. Alkalis catalyzed transesterification is about 4000 times faster than the acid catalyzed reaction. Consequently, alkalis such as sodium and potassium hydroxide are commonly used as commercial catalysts at a concentration of about 1% by weight of oil. Alkoxides such as sodium methoxide are even better catalysts than sodium hydroxide and are being increasingly used. Use of lipases offers important advantages, but is not currently feasible because of the relatively high cost of the catalyst. [26]
2.5 Reduction in Hydraulic Retention Time of the Substrate in Biogas Plants.
In processing of biomass through bio-methanation route use of various packing materials helps in reducing the Hydraulic Retention Time (HRT) of the substrate which ultimately reduces cost of Biogas Digesters. The pore size of the packing material influences methane yield. The increase in the population of methanogens takes place when they are retained /immobilized on the packing materials. Plastic support medium like PVC films/sheets/pipes were found to be more effective in reducing HRT. [20], [21].
Similarly in a case of a sewage disposal plant installed at Regional Research Laboratory Bhuvneshwar (Orissa), the clean sewage from the holding tanks is pumped to a mild steel fixed film bioreactor partially packed with plastic corrugated pall rings as support media for the microbial culture, the shape and specifications of which are depicted in the figure 2. This media could also be used for reducing the retention time of the substrate and enhancing the rate of gas generation in Institutional Biogas plants proposed for power generation in villages. [20] In KVIC design the fixed film media is to be housed in second half of the digester in which outlet pipes are connected so that that no clogging of any kind is faced as there are almost no chances of coarse substrate or rubbish reaching the fixed film pall rings. If this is done the same plant could be used to generate more gas than its rated capacity, by ensuring only the addition of additional storage capacity of biogas or its use is to be matched with its production rate.
2.5 Biomass Energy Transformations (Table 3)
Conversion of energy from one form to another is always associated with energy losses. This leads us to the concept of efficiency (η). Output energy in the expected form is only a fraction of the energy put to the system. Remaining is the loss, generally in the form of diffused heat. It indicates that the converters have less and varied efficiencies. This reminds us and emphasizes on the selection of proper route through which useful energy could be obtained keeping in view the conversion efficiencies of various systems and sustained availability of the inputs for the same at the site under consideration. Typical conversion forms and efficiencies of some of the energy systems are depicted below in Table-3 & 4;
Source Process / Device Product Energy Convertor Available Energy
Photosynthesis Electricity
Biomass Mechanical
Plants & Trees Heat
Flowers Fermentation Alcohol I C Engine Light etc. Seeds Fermentation,
Mechanical- Solvents/Oil
Gas I C Engine
Leaf Fermentation Gas I C Engine Stem, bark etc Mechanical - Crusher
Fermentation
Gas I C Engine
Woody biomass Gasifier Gas I C Engine Agricultural Waste Animal Feed, Gasifier Gas I C Engine Consumers of Biomass
IJMA- 4(12), Dec.-2013.
2.6 Some Typical Efficiencies of Energy Converters (Table 4) [29]
Converter Form of Input Energy Form of Output Energy Efficiency % Petrol Engine Chemical Mechanical 20 - 25 Diesel Engine Chemical Mechanical 30 - 45 Electric Motor Electrical Mechanical 80 - 95 Boiler & Turbine Thermal Mechanical 7 - 40 Hydraulic Pump Mechanical Potential 40 - 80 Hydro Turbine Potential Mechanical 70 - 99 Hydro Turbine Kinetic Mechanical 30 - 70 Generator Mechanical Electrical 80 - 95
Battery Chemical Electrical 80 - 90
Solar Cell Radiation Electrical 8 - 15 Solar Collector Radiation Thermal 25 - 65 Water Pump Mechanical Potential ca. 60 Water Heater Electrical Thermal 90 - 92
Gas Stove Chemical Thermal 24 – 30
Steam Turbine Thermal Mechanical 45
Gas Turbine (Aircraft) Chemical Mechanical 35
Gas Turbine (Industrial) Chemical Mechanical 30
Automobile Engine Chemical Mechanical 25
Fluorescent Lamp Electricity Light 20
Steam Locomotive Chemical Mechanical 10
Incandescent Lamp Electricity Light 5
LED Electricity Light 4.2–14.9%
2.7
Comparison Chart of LED Lights vs. Incandescent Bulbs vs. CFLs (Table 5) [23], [24]LEDs use less power (watts) per unit of light generated (lumens). LEDs help reduce greenhouse gas emissions from power plants and bring down electric bills. It also reduces the size of power plant for same illumination level. Thus appropriate selection of LEDs could either enhance the duty cycle of lighting lamps /systems or could meet the energy demand of other energy systems, keeping the size of the plant same. [24]
Energy Efficiency & Energy
Costs
Lamp Type Light Emitting Diodes (LEDs)
Incandescent Light Bulbs
Compact
Fluorescents(CFLs) Life Span (average) Watts of
Electricity used (Equivalent to 60 Watt Bulb).
50,000 Hours 12,000 Hours 8,000 Hours
LEDs use less power (watts) per unit of light generated (lumens).
6 - 8 watts 60 watts 13-15 watts
Kilo-watts of Electricity used (30 Incandescent Bulbs per year equivalent)
3285 KWh/yr.
329 kWh /yr 767 KWh/yr.
Annual Operating Cost (30 Incandescent Bulbs per year equivalent)
$32.85/year $328.59/year $76.65/year
Carbon Dioxide Emissions (30 bulbs per year)
451 pounds/year 4500 pounds/year 1051 pounds/year
Light Output in Lumens Watts Watts Watts 4-5, 6-8, 9-13, 16-20, 25-28 450, 800, 1100, 1600, 2600 40, 60, 75, 100, 150 9-13, 13-15, 18-25, 23-30, 30-55,
Durability Very Durable-LEDs can handle jarring and bumping
Not Very Durable - glass or filament can break easily
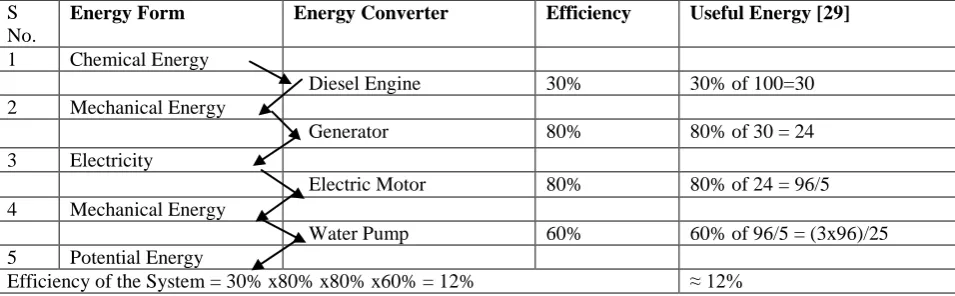
In some of these converters, the assigned input energy is not only directly converted into desired energy form but is also associated with intermediate forms of energy. For example, with diesel engine the intermediate form is thermal energy. When thermal energy is involved either as the input or as an intermediate form, the efficiency is generally low. The energy converter can be a device, or a process, or a whole system. An example of the efficiency of an energy conversion system is given in Table 6. The overall efficiency equals the product of the efficiencies of the various components fall in the chain of the system. We can note that as the number of conversion stage increases the overall efficiency decreases. It is very low indeed as is evident from the calculation given below in the bottom row of Table 6;
2.8
Example of the Efficiency of an Energy Conversion System (Table 6)S No.
Energy Form Energy Converter Efficiency Useful Energy [29]
1 Chemical Energy
Diesel Engine 30% 30% of 100=30 2 Mechanical Energy
Generator 80% 80% of 30 = 24
3 Electricity
Electric Motor 80% 80% of 24 = 96/5 4 Mechanical Energy
Water Pump 60% 60% of 96/5 = (3x96)/25 5 Potential Energy
Efficiency of the System = 30% x80% x80% x60% = 12% ≈ 12%
At places where there is scarcity of energy and it is in short supply, its efficient and judicious use is always desired and all possible efforts should be adopted and continued to save it. It is with this view any conversion of energy from one form to any other useful form is to be chosen through one of the best conversion routes so that highest efficiency is achieved. But best option of conversion might require high cost and better equipment set up. This necessitates the optimization of cost of energy on one hand and associated cost of conversion equipment on the other hand. This is supposed to be one of the major tasks in energy planning. The problem of optimization is different when energy sources are free or locally available and cheap (e.g. wind, solar, biomass and some hydro sources). Energy efficiency has then a limited meaning, and the choice of technology would mainly depend on the cost effectiveness of the equipments involved.
2.9 Cogeneration
In the cases where heat is bound to be produced along with desired useful energy, system efficiency can be enhanced by utilizing this heat loss from one converter, as energy input to another. This is known as waste heat utilization. It is applied in agro-processing for drying of agro-products or providing hot water for community needs. Heat pump and some semiconductor devices similar to LEDs could also help in harnessing the waste heat. The process in which input is utilized for production of combined heat and power is called Cogeneration.
Once we understand various transformations of energy that are possible, an energy balance diagram could be used to track energy through a system, as it is a very useful tool for determining resource use and its associated environmental impacts. The idea is to use the first and second laws of thermodynamics to determine how much energy is needed at each point in the system and in what form that energy is. Energy auditing system keeps track of the energy in, energy out and non-useful energy versus work done, and transformations within the system.
IJMA- 4(12), Dec.-2013.
2.10 Use of Various Methods /Software to Finalize the Design [12]
Incorporating appropriate transformations, methods and suggestions narrated above and utilizing methods/software hybrid energy system design, sizing and optimum mix of the resources could be given the final shape. The methods /software are the following;
Past Field Experience, Rule of Thumb, Trial & Error Method,
Some of the important Software generally used; 1. LINDO Version API 7.0,
2. LINGO Version–13. 3. Mat lab.
4. TORA, 5. XL Solver, 6. HOMER, 7. HYBRID2 etc
8. Clean Energy Project Analysis with RET-Screen Software (SOMES, RAPSIM, SOLSIM, INSEL, PV- Design Pro, PVSYST etc.)
3.0. Demographic Details of theVillage Kundaur (Table 7) Name of Village / hamlet KUNDAUR
Census Code 2213800
Village GPS Coordinates Latitude N 23º 52’ 38”, Longitude E 82º 04’ 24” Village Panchayat AMROLA
Development Block KUSMI Category of the Block Tribal Block
District SIDHI
State Madhya Pradesh
3.1Approach to the Village:
Distance from block HQ (Km) 75 km
Type of Road (Tar Road or Kachcha Road) Kachcha / Earth & Metal Road If Kachcha: Distance from Tar Road Head 7 km
Distance from nearest 11 kV line (Km) > 35 km Distance from nearest 0.4 kV line (km) 26 km 3.2 Total Area of the Village (ha) 639 ha No. of Hamlets in the Village 2 3.3 Total Population (as per 2001 census): 1487
2.2 No. of ST Households 36 2.3 No. of other Households 40 Total (1+2) i.e. 245 + 109 = 354 3.4 Details of Common Facilities:
School having 7 Class Rooms 1 x7 Public Health Centre having 4 Rooms 1 x4 Panchayat Bhawans having 4 Rooms 1x 4 Community Buildings having 4 Rooms 1 x4 3.5 Socio Economic Details:
Land ownership in which DDG is proposed Gram Panchayat/ Government Main Lively Hood Activity 1 Agricultural labor, 2 Cultivation
Main Employment Agriculture Based
Household’s Average Annual Income (Rs.) 5188/ Household’s Average Annual Expenditure (Rs.) 3650/
4.1. Connected Load & Duty Cycle (Table 8)
Load Location Code Duration(s) Electrical Appliances
Watt-age
Qty hr KWh
From To A. Domestic Load DS 19.00
04.00
00.00 06.00
2CFLs + Fan 11x 2 +60x1
82 per H.H.
354 set
7 203.196
B Community Services
Street Lights SL1 00.00 05.00 CFL 18 15 5 1.350 Street Lights SL2 19.00 00.00 CFL 18 30 5 2.700 School 1x7(Rooms) S 08.00 16.00 CFL(16Wx1) +
Fan (60W)
76 / Room
7set 8 4.256
Public Health Centre 1x4(Rooms)
PHC 07.00 17.00 CFL(16Wx1) + Fan (60W)
76 / Room
4set 10 3.040
Panchayat Bhawan 1x4(Rooms)
PB 11.00 17.00 CFL(16Wx1) +Fan (60W)
76 / Room
4set 6 1.824
Community Building 1x4(Rooms)
CB 17.00 23.00 CFL(16Wx2) + Fan (60W)
92 / Room
4set 6 2.208
One room of CB TV 17.00 23.00 Color TV 90 1 6 0.540 C Industry/Agricultural/ Commercial Activity
Common Facility Centre CFC1 08.00 16.00 Elect. Motors 5x746 2 8 59.680 CFC2 06.00 11.00 Water Pumps* 3x746 2 5
15.00 19.00 Water Pumps 3x746 2 4 40.284 319.078 *Ground Water should be lifted in two stages (Direct Pump +Electrical Pumps) that is under ground water is to be lifted through electric pumps and should be taken in shallow sump wells and then should be pumped to irrigate fields or fill the overhead tanks by direct fuel pumps through HDPE pipeline. This will save 6 – 8% energy directly by selection proper conversion route involving minimum stages of conversion. [10],[11],[29]
4.2 Daily Lighting Load
1. Domestic CFLs Load = 2 x 354= 708 CFLs of 11W each x 7hrs = 54516Whr 2. Street Lights (i) 18 x 30 x 5hrs = 2700Whr
(ii) 18 x 15 x 5hrs = 1350Whr
3. Community Lighting in Buildings/Rooms/School/Public Health Center 3.1 16 W x 1(in each room) x 8 (Rooms) x 6hrs = 768Whr
3.2 16 (W) x 1 x 4(Rooms) x10hrs = 640Whr 3.3 16 (W) x 1 x 7(Rooms) x 8hrs = 896Whrs
3.4 Total kWh = 54516 + 1350 + 2700 + 768 + 640 + 896 = 60870 = 60.870 kWh/day
4.3 Number of CFLs Used with Various Intervals and Wattages (Table 9)
Wattage of CFL Order of number of CFLs remained in Operation Order of Hours of Operation
11 W 708 7 hrs (54.516)
IJMA- 4(12), Dec.-2013.
If the state of art technology in illumination is adopted and CFLs are replaced by LED lamps of equivalent Lumens than power requirement of the lighting load could be reduced to at least 50% and size of the battery bank could be reduced to at least 40% with better depth of discharge and ultimately either the cost of power plant could be reduced or duty cycle of the systems involved could be proportionately enhanced. It could also be used to meet the augmented demand. In the proposed hybrid system if all the CFL lamps are replaced by equivalent lumen LED lamps then 30 kWh electricity could be saved daily that amounts to 11108 units per year. If this is considered seriously, it could lead to reduce the size of the SPV power plant to 5KWp in place of 10KWp.
A. Lighting Load per day as depicted above = 60.870 kWh/day = 22217.55 kWh /yr
B. Fan Load per day = 354 x 60 x 7 = 148.680 kWh + 19 x 60 x 6 + 11 x 60 x 2 + 7x 60 x 2 = 148.680 kWh + 6.84 + 1.32 + 0.840 = 157.68 kWh /day
= 57553.2 kWh /yr
C. TV Load = 90 x 6 = 0.540/day = 197.1 kWh/yr
D. Cottage Industry & other Mechanical Load = 59.68 kWh / day = 21783.2 kWh /yr, E. Drinking water and Irrigation Load = 40.284 kWh/day = 14703.66 kWh / yr
4.4 Daily Load Profile (Table 10)
Time (hrs) Codes of Connected Bldg./ Centres/ Rooms to Mini-grid
Connected Load (W) Total kWh From To
00:00 01:00 SL1 270 0.270 01:00 02:00 SL1 270 0.270 02:00 03:00 SL1 270 0.270 03:00 04:00 SL1 270 0.270 04:00 05:00 DS+SL1 29028+270 29.298 05:00 06:00 DS 29028 29.028 06:00 07:00 CFC2 4476 4.476 07:00 08:00 CFC2 + PHC 4476 + 304 4.780 08:00 09:00 CFC1+CFC2+S+PHC 7460 +4476 +532+304 12.772 09:00 10:00 CFC1+CFC2+S+PHC 7460 +4476 +532+304 12.772 10:00 11:00 CFC1+CFC2+S+PHC 7460 +4476 +532+304 12.772 11:00 12:00 CFC1 +PB+S+PHC 7460 +304 +532+304 8.600 12:00 13:00 CFC1 + PB+S+PHC 7460 +304 +532+304 8.600 13:00 14:00 CFC1 + PB +S+PHC 7460 +304 +532+304 8.600 14:00 15:00 CFC1 + PB +S+PHC 7460 +304 +532+304 8.600 15:00 16:00 CFC1+ CFC2 + PB + S+PHC 7460+4476+532+304+304 13.076 16:00 17:00 CFC2 +PB + PHC 4476+304 +304 5.084 17:00 18:00 CFC2 + CB + TV 4476 + 368 +90 4.934 18:00 19:00 CFC2 + CB + TV 4476 + 368 +90 4.934 19:00 20:00 DS + SL2+ CB + TV 29028+540+368 +90 30.026 20:00 21:00 DS + SL2+ CB + TV 29028+540+368 +90 30.026 21:00 22:00 DS + SL2+ CB + TV 29028+540+368 +90 30.026 22:00 23:00 DS + SL2+ CB + TV 29028+540+368 +90 30.026
23:00 00:00 DS + SL2 29028+540 29.568
Total kWh 319.078
4.5 Estimated Load Demand: (Table 11)
1.10.1 Household – Lighting & Fans 29.028 kW 1.10.2 Community Services, including Streetlights 2.138 kW 1.10.3 Industrial/Agricultural/Commercial Load 11.936 kW 1.10.4 Total Estimated Load Demand 43.102 kW
5.0 SPV Based Power Plant (Table 12)
Availability of land for setting of SPV power plant Yes Area of land available(acre) 1
Whether power can be made available for at least 6-8 hrs per day throughout the year
Yes
Whether power generation project capacity available is sufficient to meet the load
Yes
6.0 Wind Farm / Aero-generators (Not appears to be cost –effective and feasible)
Average wind speed 2.6 m/s
7.0 Details of Site/Village, Electrification of which is to be carried out by Hybrid Energy Systems Daily Power Requirement in kWh = 319.078 kWh.
7.1 Daily Load Pattern (Power Requirements at Specified Timings)
Two water pumps (3HP each) would operate from 6 – 11 AM and 3 - 7 PM, two 5HP motors would operate to run various machines of common facility centre including flour mill etc, and Home Lights, TV, Fans and Street Lights would be operated simultaneously or with variation as depicted in Table-10. Thus, there would be a peak load of 30.026 kW from 7- 11 PM. Mechanical systems of common facility center and water pumps could be managed to run as per requirement of the community and animate power plants and 100% biogas gen-sets could be run as first and second priority respectively.
7.2 Availability of Renewable Resources
IJMA- 4(12), Dec.-2013. 7.3 Solar Energy Availability (Table 13)
District Latitude Longitude Average Daily Insolation SIDHI N 23O 52'38'' E 82O04'24'' 5.4 kWh/Sq. M
A ten KWP SPV power plant is proposed to be installed at the suitable site of the village. This Plant would cost around Rs. 2500000/- for plant and 200000/- for building. This plant would generate around 45-60 kWh (average 50 units/day) per day for 300 days in a year as per intensity of solar insolation available at site. [12], [28], [32]
7.4 Cattle, Goat and Poultry Birds and Availability of Droppings in the Village (Table 14)
S No.
Species Adult Animals Calves Approx. Dung Production in kg
Approx. Dung Collection
Size of Biogas Plant Cattle Oxen#
1 Cows 630 24 68 6540+136 = 6676 3500 Kg 2 Buffaloes 41 04 26 675+130 = 705 350 Kg 3 Goat 375 62 Approx. 100 50 Kg
4 Poultry 573 180 x 573 = 102.94 100 kg 85+60 = Total 699 cattle Total 4000 kg 145M3
# 12 pairs of Oxen and 2 pairs of Buffaloes would be used for operating Mini Animate Power Plants (MAPP) (Using Muscle Power of Animals)
A generating set developed by BHEL Hyderabad Unit is a petrol start and 100% biogas run gen-set that consumes 1M3 biogas per kW per hour on full load i.e. one 10KVA and one 5KVA gen-set could be run for 9 and 11hours a day respectively [32] by successfully running one 85M3 and one 60 M3 biogas plants. In due course after gestation period of petro crops, cow dung can also be substituted by various by products of J Curcus and or de-oiled cake obtained after extraction of oil from non-edible oil seeds. One thousand Kg. of cow dung is capable of producing 38 to 40M3of biogas whereas same quantity of Jatropha Curcus seeds de-oiled cake could produce about 205 M3 of biogas. [16] 100% biogas generating sets being sold by M/s. Perfect Gas Generators, New Delhi, could also be considered. These-sets consume 0.5 cubic meter biogas/KVA/hour to generate 0.8 kWh of electricity. The range available is from 3KVA to 125KVA.[36]
7.5 Mini Animate Power Plants (MAPP) (Using Muscle Power of Animals)
Three Oxen Driven Animate Power Systems are proposed to be installed at site. The cost of these systems would be around Rs.160000.00 excluding cost of the sheds for three systems. We have 12 pairs of bullocks and 2 pairs of buffaloes. Out of 14 pairs of animal, we can easily run three systems with following alternators and regulators for 30 hours @ 10 hrs each system per day;
Animal powered alternator is the key to a successful DC electrical system. There is no other way to produce a large amount of power reliably and quickly once we leave the dock. We could use the following alternators for making the proposed Animate Power Systems;
1. 6 Series Alternators – These are small case alternators in sizes up to 150 Amps at 12 volts or 70 Amps at 24 volts,
2. 94 Series Alternators – These are large case single foot alternators in sizes up to 210 Amps at 12 volts or 140 Amps at 24 volts,
3. 95 Series Alternators – These are 4’’Dual foot J-180 mount large case alternators in sizes up to 210 Amps at 12 volts or 140 Amps at 24 volts,
Alternatively, we can make use of alternators used by ‘Mauruti’– 800 for pair of bullocks and by ‘Tata Sumo’ vehicles for pair of buffaloes. In case of higher capacity alternators more than two animals could be connected to lever arm of the gear system coupled to alternator. Two 50Amps, 12V and one 100Amps, 12V alternators proposed to be coupled to gear mechanisms of Three Animate Power Plants so that three systems having (100+50x2)Amps x 12V = 2400VA total capacity, could be run for 10 hrs each i.e.2400VA x 10 = 24000Whr = 24kWh = 24kWh/day i.e. 24x365 = 8760 kWh of electricity per annum.
7.6. Biomass based Distributed Energy Generating System (DEGS): (Table 15) Availability of Biomass Yes
Type and Quantity of Biomass available Type Quantity(Tons / yr)
(i)Wood (ii)Twigs Total
In order to meet cooking needs of the house-holds fuel wood would be made available along with solar cookers (Box type for each family and Parabolic and community cookers to school and Public Health Centre). As envisaged, as soon as the purpose of petro-crops plantation gets maturity at the expiry of gestation period, use of fuel wood for cooking would be minimized and in due course would be supplemented with supply of biogas. A power plant having the capacity of 25 kWe based on gasification is being proposed so that electrical power needs of the habitants are also met without causing any problem unless the needs are supplemented by biogas or bio-diesel power plants. This plant would be operated 5-6 hours daily to meet the peak demand would consume 150x365 = 54750kg/yr = 54.75t/yr of fuel wood which could be easily adjusted from the available biomass depicted above in the Table-15.
7.7 Waste Land Availability for Cultivation of Petro-crops (Table 16) [4], [5], [6]
District Available for Cultivation Total A+B+C (Hectares) Immediately
(A)
After Some Improvement (B) Uneconomical Patches (C)
Sidhi 33621 16229 14569 64419
7.7.1 4444 J. curcus plants are proposed to be grown per hectare through the saplings, at least one year old, grown at the site nursery. These plants generally bear fruits from second year of its plantation and the economic yield stabilizes from the fifth year onwards. Seeds become mature when the schizocarp capsule changes from green to yellow and then dark brown. The brown fruits are dried in the shade and de-hulled to separate the hulls (Epicarp/exocarp) from the seeds. Jatropha curcus yield about 1 kg seed per plant per year in a relatively poor soil from fifth year onwards. Generally 3 seeds were obtained from a single fruit and the seeds had oil content of 25 – 35%. The seeds are de-shelled to separate the shell (Testa) and kernel and are used as such for oil extraction. [16]
7.7.2 Production of Jatropha Curcus Plantation on Rain Fed Dry Lands at A Density of 4444 Plants per Hectare and Energy Flow (Table 17) [16]
(A)Total Biomethanation
Route
Name of Plant Component Biomass Associated Energy
CH4 Potential in M3 Total
Solids
Volatile Solids
Pruned Leaves 1.1 t 0.97 t 13GJ 230 M3 Fruit Hulls 1.1 t 1.00 t 14GJ 309 M3
Seeds 4.05 t 3.85 t 91GJ 2349 M3
Duration 105 days at 350C 118 GJ Total 2888 M3 (B)Bio-diesel &
Biomethanation Route
Seeds 4.05 t 3.85 t
Oil Yield 1.42 t
Trans-esterification using 14kg KOH and 170 kg Methanol Biodiesel yield 1.35 t /Hectare / year 53GJ Glycerin 156 kg/ Hectare/year
De-oiled Cake 2.63 t 2.35 t 34 GJ 541 M3
It is proposed that 20 ha waste land should be provided to the project so that petro-crop plantation could be achieved as suggested above.
1. If (A) Route is followed, the following products would be produced per year; 1.1Biogas = 2888 *20 = 57760 M3 biogas = 57760 kWh of electricity and
1.2 Bio-manure = 6.25*20*40/100 = 625*8/100 = 5000/100 =50t bio-manure (dried) 2. If (B) Route is followed the products would be produced/year as follows;
2.1 Bio-diesel = 1.35*20 = 27.00 t
2.2 De-oiled Cake = 2.63*20 = 52.60 t = 541*20 = 10820 M3 = 10820 kWh 2.3 Bio-manure = 52.60*40/100 = 210.40/10 = 21.104 t (Dried Bio-manure) 2.4 Glycerin = 156*20 kg = 3120 kg =3.12 t,
This Glycerin could also be used as feed material for biogas plants if not otherwise utilized for cosmetic or medicinal purpose due to lack of refining. It is assumed that at least 40% bio-manure would be recovered from the effluent slurry produced from the biogas plants.
IJMA- 4(12), Dec.-2013.
7.8 Remote Village Electrification through Bio-diesel / (Diesel + Biodiesel) Dual Fuel Generating Set The Rated Capacity of the Gen-set Proposed = 3 x 10 KVA
Number of households in the villag = 354
Number of 11Wx2CFL+ 60WFan connections = 82Wx354 Connected Domestic Load = 29.028 kW
Peak Load = 30 kW (19 to 0.0Hrs i.e. 5 Hr)
Water Pump (2x 3 HP) Operation = 4 to 5 Hrs in the morning Number of hrs of operation of Gen-set = 5 + 5 = 10 Hours Amount of Diesel/Biodiesel required per BHP/hr = 175 gm Per day fuel requirement = 175x10x 30 = 52500gm
Per day fuel required in liters = 52500/(1000x0.83) = 63.253 liters Monthly requirement of fuel = 63.253 x 30 = 1897.590 liters
Per year requirement = 63.253 x 365 = 23087.35 Liters say, 23087.35 liters /year = 23087.35 x 0.83 = 19162.50 Kg
1 kg of Jatropha seed oil require = 3.5 kg of seeds
19162.50 kg of oil will require =19162.5 x 3.5 = 67068.752 kg of seeds/year Taking losses into account say= 67100 kg of seeds required / year
One Jatropha plant yields on an average =1 kg seed / year Number of plants required for the project = 67100 Nos. Land required @ 4444 plants per hectare = 15.5 ha, say 16.0 ha
In 16 ha land 67100 plants could yield more than 67100 Kg seeds which could produce 19162.5 Kg oil and 12413.5 Kg de-oiled cake. These products could be converted into biodiesel and biogas. De-oiled cake could be substituted for replacing dung or supplementing it. [8, 9,10, 16]
8.0 UNIT COST OF POWER GENERATED FROM VARIOUS RESOURCES
The cost of energy generated by a renewable (non fuel burning) energy system is obtained by adding the capital recovery cost and operation & maintenance cost per unit of energy generated. Typical, calculations are made on an annual basis and the cost of energy [12, 30, 31] is given as:
C = [r (1+r)n /{(1+r)n – 1}] [P / 87.6k] + O&M (1)
Where, C = cost of energy in Rs/kWh
k = Annual capacity factor per unit (defined in equation 2) Which is also known as plant factor or load factor or annual average energy production factor
n = Amortization period (in years)
O&M = Operation and Maintenance Cost (in Rs/kWh)
P = Installed (capital) cost (in Rs/kW)
r = Fixed annual cost per unit (in 0.01 Rs/kWh)
Actually the amortization period is usually equal to the lifetime of the energy system. Capacity factor refers to the ability of the system to generate energy on an annual basis. It is found by using
k = Energy generated in kWh/year / (System rating in kW) (8760 h/year) (2)
Inclusion of the cost of fuel (which could be biomass) requires the addition of (0.3413 f/η) to the right hand side of
equation (1). Where,
f = Fuel cost in Rs/million Btu at the generation site, and
η = Overall efficiency of the plant in per-unit
η = (3413 Btu / kWh) / (Heat rate in Btu / kWh) (3)
From the following relation might find the cost of per unit of diesel generated power [34]:
Where, CD is cost of diesel generated power in Rs/kWh, CF is diesel fuel cost in Rs/liter, P is diesel generator electrical power output in kW, Fi is incremental diesel fuel consumption rate in liters/hr and F0 is diesel generator fuel consumption at no load in liters/hr,
Skarstein and Uhlen have suggested that the fuel consumption parameters can be approximated as
Fi = 0.246 liters/kWh, F0 = 0.08415 Pr liters/kWh, Where, Pr is the rated power of diesel generator at full load, in kW. O&M costs are usually estimated on the basis of data collected from the systems proposed to be operated. Obviously, valid projections can be made based on the potential variations in system technologies and operating strategies.
8.1 Comparison of Wind Energy with other Renewable Energy Sources Table -18 [28]
Source Capital Cost Million Rupees/MW Generation Cost Rupees/kWh
Wind Power 35 2.25
Small Hydro 35 – 60 1.50 -3.50
Co-generation 20 – 25 2.00 – 2.50
Solar Photovoltaic 300 15.00- 20.00
Biomass 35 – 50 2.00 – 2.50
8.2 Resource-wise Unit Cost of Energy Table-19
S. No.
Various Parameters of the System Resources Table-19
SPV BGPP BES MAPP*
1 Yearly kWh Generated 15000 52925 54750 8760 2 Rated Capacity KVA /KWP 10KWp (10 + 5) KVA 25kg/h 2.4 KVA 3 Yearly Operating Hours 10x300=3000 32850+ 20075 = 52925 2100 365x10x1Set 4 Amortization Period (Yrs) 25 20 15 20
5 Capital Cost (Rs./kW) 250000 20000 30000 134000
6 O & M Cost (%) 2 3 3 5
7 Annual Interest Rate (%) 10 10 10 10
8 Fuel Cost (Rs./ kWh) - ** - 3.0 -
9 Levelized Cost of Energy Rs./kWh 11.87 3.21 1.81 4.78
** Bio-manure would be returned to each household in lieu of dung in proportion to the quantity procured. * These systems are capable of running 24x7 round the year as only bullock pairs are to be changed at suitable
intervals. Fodder to the oxen would be made available free of cost from grazing fields of waste land and raising activity of bullocks would be carried out in a planed manner for meeting the long term requirement. Number of hours of operation MAPP could be increased looking to the fatigue / stress imposed on pair of bullocks depending upon the availability of relieving bullock pairs.
9.0 OPTIMIZATION AND SIZING
There are many software tools that are capable of simulating, optimization and determining sizes of equipments in hybrid energy systems. Some important software tools are listed under sub-section 2.10 of this article. In addition to the software tools stated above, other methodologies for sizing and optimization of hybrid energy systems are- Knowledge-based approach, Simulation approach, Linear programming (LP) etc.
10.0 MODEL FORMULATION
A general model of hybrid energy system for the major end uses such as lighting, comfort, entertainment and other uses on cost effective basis i.e. on the basis of per unit cost of energy generation (Rs/kWh) could be formulated following linear programming as:
Minimize: Total Cost (TC) = Σ Cij × Xij
Subject to: Σ Xij = Dj
Σ Rij = Pi
Σ Xij/ηij≤ Si
IJMA- 4(12), Dec.-2013.
Where TC is the total cost of providing energy for all end uses for operation of the system; Cij, cost/unit of the ith resource option for jth end use (Rs/kWh); Xij, optimal amount of the ith resource option for jth end use (kWh); Dj, total energy for jth end use (kWh); Rij optimal amount of the jth resource option for jth end use (kWh); Pi Total availability of the ith renewable resource option for jth end use (kWh); Si, availability of the ith resource option for jth end use (kWh); ηij, conversion efficiency for the ith resource option for jth end use.
The effective cost per unit of energy (Cij) for each of the proposed resource-device combinations (variables) is an important factor in the optimization model. The main objective is to optimize an objective function subject to a set of constraints. The cost function governs the optimal mix in such a manner that renewable resources with lesser-cost function share the greater of the total energy demand in an attempt to optimize (minimize) the objective function.
In this article various steps considered for planning a hybrid energy model for remote area have been reviewed and highlighted based on state-of- art and appropriate technologies so that an ideal small scale hybrid energy model could be arrived at.. A similar process can be adopted to develop any hybrid system incorporating different energy resources suitable and available at site under consideration.
11.0 ILLUSTRATION OF MODEL DESIGN
In this paper cost effective and energy efficient modeling of a hybrid energy system managing the minimum energy requirements of a village Kundaur situated in a remote rural area of district Sidhi, Madhya Pradesh (MP) is being considered. The main purpose of this work is to set up an ideal model and present an example that could be helpful to prepare the action plan/ strategy to further strengthening the process of rural development in M P.
The specific values chosen and assumptions made are subjected to wide variations depending on a variety of local conditions. The cluster of hamlets is located in a remote area with adequate solar insolation, average wind speeds of 2.6 m/s, Cattle and biomass resources are available in sufficient quantity. Table 20 shows the demographic and vital statistical data of the village, available resources of energy and the yearly energy demand of various sectors in the village. The total proposed potential of HES including all the renewable energy resources considered together is about 131435kWh/yr. The total estimated demand is 116454.71kWh/yr. This means that the energy demand of the village could be easily met by exploiting the locally available resources as proposed above. However, a diesel-generator-set of 20KVA rating is also proposed to be installed as standby or back up supply so that any unforeseen demand could be met and failure of any system could be nullified. The hybrid model of the distributed power system must include BGPP, BES, MAPP, and a 3KWP SPV plant. As far as possible all CFL lamps must be replaced with equivalent Lumen LED lamps so that everyday about 30 units of electricity could be saved, high oil yielding species of J Curcus with seeds containing rich percentage of oil must be chosen to petro-crop plantation. As far as possible water pumping should be managed through pumps coupled to IC engines. Electric pumps should be used to lift water from deeper wells or tube wells. As soon as gestation period of the petro-crops is completed, switching over from biomass to biogas and biodiesel must be done so that bio-manure is also produced along with ease of operation of biogas power plants which could be run instantly if gas is available. MAPP could also be run at any time so that not only the power requirement could be met but low depth of discharge of the battery bank could be maintained in order to enhance the life of the battery bank. Thus this design is based on past experience and thumb rules for optimum mix of resources and not on the use of any software.
11.1 Local Availability of Energy Sources, Production and Annual Energy Demand (Table 20) Item Details No. / kWh/yr
Village -KUNDAUR No. of Hamlets 2 Households 354 Population 2117
Cattle 699
Total Land 639 ha Annual Energy Production
from Available Resources
Solar Photovoltaic 15000 kWh/yr Biomass 54750 kWh/yr Biogas 52925 kWh/yr Animate Power Plant 8760 kWh/yr 131435 kWh/yr Annual Energy Demand Lighting load: 22217.55 kWh/yr
Agriculture/Irrigation load: 14703.66 kWh/yr Motive/Industries load: 21783.20 kWh/yr
Other Domestic load-
1. T.V. load: 197.10 kWh/yr
Therefore, the entire electricity generation would be 131435 kWh/yr and accordingly the model consisting of Solar Photovoltaic Power System (SPV), Biomass Energy System (BES), Biogas Power Plant (BGPP), Mini Animate Power Plant(MAPP) and Dual fuel /Diesel-generator set (DG) have been considered. The unit costs have been calculated using the standard procedure explained in section 8.0 and the procedure given below which is based on capital cost of installed capacity, operational & maintenance costs, life of plants, fuel cost, if any etc., have been used for calculation of each resource. The levelized unit cost of energy of different resources has been estimated as Rs.11.87 for SPV, Rs.3.21 for BGPP, Rs1.81 for BES and Rs.4.78 per unit for MAPP. Results obtained by using the formula given below, are listed in Table 19. [35] Levelized unit cost of energy is calculated by putting the necessary values into the following formula; LCOE (Rs/kWh) = [Capital Cost + {O & M (Rs/yr) x PVAF}] / {Annual Energy Output (kWh/yr) x PVAF} Where PVAF stands for Present Value Annuity discount Factors (PVAF) which is given below for various discount rates and useful life in years;
Present Value Annuity discount Factors (PVAF) Table 21 Discount
Rate
Useful Life in Years
10 15 20 25 30
2% 8.98 12.85 16.35 19.52 22.40 3% 8.53 11.94 14.88 17.41 19.60 4% 8.11 11.12 13.59 15.62 17.29 5% 7.72 10.38 12.46 14.09 15.37 6% 7.36 9.71 11.47 12.78 13.76 7% 7.02 9.11 10.59 11.65 12.41 Calculation of LCOE for Various Energy Systems
System Useful Life
Capital Cost (A)
O & M x PVAF (B)
Fuel Cost (C)
Yearly kWh Output x PVAF (D)
LCOE = (A+B+C) / (D)
SPVPP 25 25,00,000 50000 x 19.52 = 976000
- 15000 x 19.52 = 292800
3476000/292800 = 11.87
BES 15 7,50,000 22500 x 11.94 = 268650
164250 54750 x 11.94 = 653715
1182900/653715 = 1.81
BGPP 20 17 50,000 52500 x 14.88 = 781200
- 52925 x 14.88 = 787524
2531200/787524 = 3.21
MAPP 20 3,21,600 16080 x 12.46 = 200356.8
- 8760 x 12.46 = 109149.60
521956.8/109149.6 = 4.78
The results shown are for specified system parameters. These parameters can change from area to area. It is clear from the unit rate of energy depicted in Table 19 that the most economical system is the stand-alone Biomass Power Plant (Rs1.81/kWh) and it has to be operated at most of the peak load time in order to meet the load demand constantly and economically. The SPV stand-alone system has appeared as most expensive system producing energy at Rs.11.87/kWh. From the village vital data collected from the village by conducting door to door and actual recent survey, it is clear that the biomass is available in sufficient quantity and it is the cheapest as far as per unit energy generation from locally available resources is concerned. It is clear that woody biomass is available near the site in plenty. With the existing potential it could not only fulfill the cooking requirement of the village community but also meet the requirement of a 25 KW gasifier for running the same daily, at least for 6 hrs in a decentralized mode. Biogas Power Plant is second cheapest to produce power at the rate of Rs3.21/kWh. As it also produces bio-fertilizer, therefore, full potential of the same is proposed to be harnessed. The unit cost of power from biomass- an individual resource alone is Rs1.81/kWh, which is almost half of the average cost of energy from the HES (Rs3.72/kWh).
11.2 Design Results (Table 22)
System Type SPV BGPP BES MAPP Installed capacity (KWP /KVA) 10 15 25 2.4 Units Contributed (kWh) 15000 52925 54750 8760 Rates Calculated in Table 19 (Rs/kWh) 11.87 3.21 1.81 4.78 Resource-wise Total Cost in Rs. 178050 169889.25 99097.5 41872.80 Optimal Cost of HES (Rs.) 488909.55
Average COE of HES (Rs/kWh) 3.72
From the data depicted in Table 19 and 22 it could be explicitly suggested that;
IJMA- 4(12), Dec.-2013.
2. MAPP should also be run to its fullest capacity as per availability of bullock pairs and fatigue /strain imposed on them. Increase in number of hours of operation of the plant could also be considered in order to reduce the unit cost of energy.
3. BES should also be run to its fullest and we might consider increasing the number of hours of operation from 6 to 8 hours.
4. The size of SPV power plant should be reduced to the minimum i.e. around 3KWP so that cost of installation of SPVPP is reduced to less than one-third of the cost of the proposed plant. This would drastically reduce the unit cost of energy from Hybrid Energy System. This would also appreciably reduce the capital cost of the project. MAPP would take care of the depth of discharge of the battery bank of this plant as these plants could generate power at any time round the clock & round the year and would not allow the level of the battery bank to go below a pre-decided level/depth of discharge. This is all based on past work experience and if adopted would be in the interest of the project and its sustainability.
12.0 CONCLUSIONS
A systemic strategy for designing a stand-alone hybrid power plant capable of utilizing various local and abundantly available resources which may be supplied free of cost or at a cheaper rate and utilized through appropriate and efficient conversion route, for managing the basic energy needs of remote rural areas, has been paid special attention. It has been depicted and explained here along with better options to switch over for meeting the increased power demand in future through cheaper and easy to operate options. The conversion route opted is based on best conversion technologies through environment friendly and energy efficient equipments. The approach applied is based on minimizing an objective function based on optimum utilization of energy resources in a cost effective manner. The formulation is quite simple and could be adoptable to any of the demand and supply situations. Use of LEDs in place of CFLs of equivalent Lumens alone in this project can reduce the size of SPV plant to less than half that ultimately reduces the overall capital cost and per kWh energy cost of the hybrid energy system. In the present case the production of kWh units is also more than the projected demand. Hence size of SPV plant could be easily reduced to 3KWP. Use of MAPP is useful for 365 days and could also be used 24x7 that guarantees the reliability of the power supply at lower cost with no gestation period. The proposed HES would basically be a Green Power Plant.
13.0 REFERENCES
1. http://www.powermin.nic.in/JSP_SERVLETS/internal.jsp
2. Singh S P and Gupta B P “Renewable Systems – A Route to Sustainably Powering the Remote Villages of Madhya Pradesh in a Decentralized and Eco-friendly Manner” presented in a National Conference on “Renewable Energy and Energy Management” organized by SR Group of Institutions Jhansi, on 8-9 October 2011.
3. Framework for Programmatic CDM Projects in Renewable Energy published by Ministry of New and Renewable Energy, Government of India, May, 2009.
4. Sethi, V.K. and Gupta, B. P. “Power generation and Manure Potential of Madhya Pradesh through Jatropha Curcas Plantation by Utilizing Available Wasteland”, presented in “Bhartiya Vigyan Sammelan”, Bhopal, 23-25th November’2007,
5. Bhattacharya, P and Mitra B, Status of Jatropha and Karanj cultivation technology for Bio-fuel in India, Indian Institute of Forest Management, Bhopal
6. Bhattacharya, P and Joshi B, Strategies and Institutional Mechanisms for Large Scale Cultivation of Jatropha Curcas Under Agro-forestry in the Context of the proposed Bio-fuel Policy of India, Indian Institute of Forest Management, Bhopal (Paper presented at the Consultative Workshop on Scientific Strategies for Production of Non-edible Oils for Use as Bio-fuels as the JSS Academy of Technical Education, Bangalore, during 6-7 Sept. 2003)
7. “Annual Report” 2005-06, Sardar Patel Renewable Energy Research Institute (SPRERI), Ballabh Vidya Nagar – 388120 (Gujarat)
8. Uppal J, Emerging Potential of Bio-fuels in Remote Village Electrification Programme, Organized by Ministry of New & Renewable Energy at Guwahati, June 18, 2004.
9. “Bio-diesel Green Fuel for the New Century,” an article published in “PARYAY,” January- December 2005, (page 17-18) a news letter on clean energy alternatives published by Gujarat Energy Development Agency, Vadodara – 390-005
10. Kirloskar Dual Fuel Biogas Engine Booklet Published by Kirloskar Oil Engines Limited, Khadki, Pune - 411 003 11. Solar Photovoltaic Water Pumps (Surface / Submersible Pumps) Catalogue circulated by M/s. Tata BP Solar India
Limited, Bangalore
12. Gupta Ajai, Saini R P & Sharma M P (2010) “Steady-state modeling of hybrid energy system for off grid electrification of cluster of villages.” Renewable Energy 35(2010) 520-535
13. Nfaha E.M., Ngundamb J.M., Vandenberghc M., & Schmid J (2008) “Simulation of off-grid generation options fo remote villages in Cameroon”, , Renewable Energy 33 (2008) 1064–1072
15. Chaurey A, Kandpal TC, (2010), “A techno-economic comparison of rural electrification based on solar home systems and PV micro-grids.” Energy Policy, 38, (2010); 3118 - 329.
16. Gunaseelan V Nallathambi, “Biomass estimates, characteristics, biochemical methane potential, kinetics and energy flows from Jatropha curcus on dry lands.”Biomass And Bioenergy 33 (2009) 589 – 596
17. Singh S P and Gupta B P,(2012), “Distributed Green Power Systems to Electrify a Village – A Comparative Study” International Journal of Mathematical Archive-3(9), 2012, 3452-3460,
18. Li, Y, et al(2008) , “Bio-fuels from Micro Algae,” Biotechnol Prog 2008; 24(4);815 -20
19. Jidon Janaun, Naoko Ellis,(2010), “Perspective on biodiesel as a sustainable fuel,” Renewable and Sustainable Energy Reviews, Pages 1312-1320,
20. Rohella, R S,(2000) “Installation and Performance Evaluation of a Fixed Film Sewage Treatment Plant – A Case Study,” Bio Energy News, September’ 2000, 11 - 14
21. Singh SP, Pandey Prerna,(2009), “Review of Recent Advances in Aerobic Packed Bed Biogas Reactors,” Renewable and Sustainable Energy Reviews, Pages 1569-1575,
22. An Outline Plan – “Creating Energy Security in Villages through Biomass,” Presented by Ministry of New & Renewable Sources, Govt. Of India, New Delhi in Regional Workshop on Different Aspects of Remote Village Electrification Projects organized by TERI and sponsored by MNRE New Delhi. from July 9 – 11, 2004 at Bangalore
23.
24. (http://www.designrecycleinc.com/led%20comp%20chart.html)
25. ///C:/Documents%2New%20FolderLED/Compare%20%20LED%20Lights%20vs%20CFL%20vs%20Incandescen t%20Lighting%20Chart.htm
26. Chisti Y.,(2007), “Biodiesel from Microalgae,” Biotechnology Advances, 25 (2007) 294 – 306 27. Hara, Michikazu et el.,(2005), “Biodiesel Catalyst,” Nature, Vol.438, No. 7065, Nov. 10’2005
28. Swain, Mayadhar, (2007), “Wind Energy – An Overview,” Akshay Urja, Vol. 3, Issue 2, March-April 2007, 18 – 22.
29. Hulscher, W.S., “Basic Energy Concepts,” Chapter 1, Pages 1 -17, University of Twente The Netherlands,
30. Ramakumar, R., Huges, W.L.,(1981), “Renewable Energy Sources and Rural Development in Developing Countries,” IEEE Transactions on Education, vol.E-24, No. 3,pp 242-251, August 1981.
31. Ashari, M. et el., (2001), “Optimum Operation Strategy and Economic Analysis of Photovoltaic- Diesel-Battery-Mains Hybrid Uninterrupted Power Supply,” Renewable Energy, vol. 22, pp 247-254, 2001.
32. Singh, S.P., Gupta, B. P., (2012), “Distributed Green Power Systems to Electrify a Village – A Comparative Study, ” International Journal of Mathematical Archive-3(9), 2012, 3452-3460
33. http://shop.pkys.com/assets/images/BAL60-YP-MC-100-SR-KIT_thumbnail.jpg
34. Barlay, C.D., Winn, C.B., (1996), “Optimal Dispatch Strategy in Remote Hybrid Power Systems,” Solar Energy, vol. 58, No. 4-6, pp. 165-179.
35. http://www.uwyo.edu/renew-energy , [email protected].
36. http://www.perfedtgasgenerators.com , www.perfectgasgenerators.in