ISSN: 2339-076X (p); 2502-2458 (e)
,
Volume 5, Number 2 (January 2018): 1111-1125
DOI:10.15243/jdmlm.2018.052.1111
Research Article
Trend analysis of temperature and rainfall in south Gonder zone,
Ethiopia
Birhan Getachew
*Department of Geography and Environmental Studies, Debre Tabor University, Debre Tabor, Ethiopia.
*birhangt88@gmail.com
Received 10 December 2017, Accepted 20 December 2017
Abstract:
This study mainly focuses on exploring trend analysis of temperature and rainfall in the case of south Gonder zone. The analysis is based on the temperature and rainfall variation in south Gonder zone over three stations at Addis Zemen, Nefas Mewcha and Mekane Eyesus. The duration of the study period for temperature and rainfall data was chosen as 1996-2015 for Addis Zemen, 1986-2015 for Nefas Mewcha and 1996-2015 for Mekane Eyesus. The Belg rainfall have been found much more variable (>30%) than the Kiremet rainfall in which the coefficient of variation is greater than 30% over the study area. The findings of the non-parametric Mann-Kendall test revealed that there was no significant trend in the annual and seasonal rainfall data whereas monthly rainfall of April and November shown statistically significant increasing trendover the study area. However, the trend was not significant, the annual, the Kiremet and monthly rainfall during June, August and November shows an increasing particularly November was also statically significant as the computed p-value is less than the significance levelα= 0.05.On the other hand, the Belg rainfall and monthly rainfall of March and April shows a decreasing trend. Statistically significant increases of mean annual temperature have been found in Addis Zemen and Nefas Mocha whereas statistically insignificant decrease of mean annual temperature has found in Mekane Eyesus. On the other hand, statistically significant increase of annual maximum temperature has been found in Addis Zemen while statistically insignificant increase of annual maximum temperature have been found for Nefas Mewcha and Mekane Eyesus station. Besides, statistically significant increase of annual minimum temperature has been found in Nefas Mewcha whereas statistically insignificant increase of annual minimum temperature has been found in Addis Zemen and Mekane Eyesus. The rates of change in mean annual temperature for Addis Zemen 1.6980c per 20 years and Nefas Mocha 0.8130c per 30 years have been found greater than the rate of change which was found at national and global level. Therefore, it is recommended that small scale study should be undertaken to clearly detect the rate of climate change and to develop appropriate adaptation strategies for the given agricultural system with the prevailing climatic conditions.
Keywords: climate, Mann Kendall, rainfall, temperature
To cite this article: Getachew, B. 2018. Trend analysis of temperature and rainfall in south Gonder zone, Ethiopia. J. Degrade. Min. Land Manage. 5(2): 1111-1125, DOI: 10.15243/jdmlm.2018.052.1111.
Introduction
Climate change has become a real phenomenon, as it is evident from an increased world temperature, which is known as global warming while many factors continue to influence global warming. Global average temperature has increased by about 0.6°C over the past 100 years (IPCC, 2014). According to the Fourth
Assessment Report of the Intergovernmental Panel on Climate Change, the global average surface temperature is likely to rise by 1.8 degrees to 4.0 degrees Celsius by 2100.
Trend analysis of temperature and rainfall in south Gonder zone, Ethiopia
Journal of Degraded and Mining Lands Management 1112
weather events based on simple statistics such as very low or very high daily temperature and heavy daily rainfall, and (2) more complex event-driven extremes, e.g., droughts, floods, heat waves and hurricanes which do not necessarily occur every year at a given location. These extreme events are of great concern because slight changes in frequency or intensity of extreme events can have important effects on society and natural ecosystems. An increase in frequency of heat waves may increase number of fatalities and decreased personal productivity while an increase in frequency and intensity of the extreme events of precipitation may increase flash flooding problems. The world as a whole witnessed huge losses of life, extensive damage to crops and properties due to these events in the past (Easterling et al., 2000, Kothawale, 2010, and Sheikh et al., 2015).
The augmented vulnerabilities of human society and natural ecosystems to such events have called for the study of extreme weather events (Sheikh et al., 2015). In Europe, Klein Tank and Können (2003) investigated daily records of more than 100 meteorological stations and computed trends in daily temperature and precipitation indices for the period of 1946–1999. Their results indicated a rise in indices of wet extremes and annual number of warm extremes followed by a decrease in annual number of cold extremes. Moberg and Jones (2005) studied patterns of changes in extreme indices over Central and Western Europe for the 20th century. They derived six indices of precipitation extreme and four indices of temperature extremes from the daily observed records (1901–1999), collected from 81 meteorological stations. The five out of six extreme indices of precipitation showed rising trends during the winter season over most parts of Europe. Similar kinds of studies were also undertaken by many authors in Europe (Sheikh, et al., 2015). The study of Plummer et al. (1999) performed in Australia, showed increases as well as decreases in extreme temperature and precipitation indices. In South America, no consistent changes in indices of daily temperature (maximum) were observed; however, there were increases in the number of warm nights (2005).Vincent and Mekis (2006) analyzed a long time series (1900–2003) of daily homogenized temperature and adjusted precipitation data for all of Canada in North America.
They observed decreases in the frequency of cold nights, cold days and frost days with increases in warm nights, warm days and summer days. The analysis of precipitation indices revealed increases in the amount of daily precipitation; however, decreases in daily
intensity and dry spell length were detected. The studies conducted by Manton et al. (2001) over Southeast Asia and the South Pacific, and by Sheikh et al. (2015) over South Asia revealed increasing trends in the annual number of warm days and warm nights coupled with decreasing trends in the annual number of cold days and cold nights.
According to the (NMA) National Metrological Agency (2007) revealed that in Ethiopia climate variability and change in the country is mainly manifested through the variability and decreasing trend in rainfall and increasing trend in temperature. Besides, rainfall and temperature patterns show large regional differences. The Ethiopian climate is also characterized by a history of climate extremes, such as drought and flood, and increasing and decreasing trends in temperature and precipitation, respectively.
The history of climate extremes, especially drought, is not a new phenomenon in Ethiopia. Recorded history of drought in Ethiopia dates back to 250 BC, and since then droughts have occurred in different parts of the country at different times (Webb et al., 1992). Even though there has been a long history of drought, studies show that the frequency of drought has increased over the past few decades, especially in the lowlands (Lautze et al., 2003; NMS, 2007).
Studies also indicate that mean temperature and precipitation have been changing over time. According to NMSA (2001), the average annual minimum temperature over the country has been increasing by about 0.250C every 10 years, while average annual maximum temperature has been increasing by about 0.10C every decade. The average annual rainfall of the country showed a very high level of variability over the past years even though the trend remained more or less constant (NMS, 2007).
is among the most vulnerable nations to climate and ecological change, given that only a small proportion of its cultivated land is irrigated and food production is dependent mainly on traditional rainfed agriculture (NMA, 2007). The effects of climate change are substantial, particularly in developing world. These countries are highly dependent on climate sensitive natural resource. Sectors for livelihoods and incomes, and the challenges in climate that are projected for tropics and subtropics, where most developing countries are found, are generally adverse for agriculture(IPCC, 2001 and 2007a).
Mean annual temperature has increased by 1.3°C between 1960 and 2006, an average rate of 0.28°C per decade. The increase in temperature in Ethiopia has been most rapid in June August and September at a rate of 0.32°C per decade. (McSweeney et al., 2008). Rainfall is historically highly variable and there is no clear trend in the amount of rainfall over time (McSweeney et al., 2008, NAPA, 2007).
The ecosystems of Ethiopia as well as its community are highly exposed to climatic variability. Ethiopia is vulnerable to climatic variability owing to its low adaptive capacity accountable to low level of socioeconomic development, high population growth, and inadequate infrastructure, lack of institutional capacity and high dependence on climate sensitive natural resource-based activities.
The major climatic elements that give climatic visibilities are temperature and rainfall. Hence, these two principal elements largely variable both spatially as well as temporarily at local, regional and global level. Therefore, understanding the trends of these climatic elements enables academician, politician, agronomists, etc to develop a clear insight of the future climatic conditions. As a result of this, several researches have been conducted to assess the trends of climatic elements at different scale such as at global, regional and local scale. However, these findings are largely aggregated and comprehensive as well did not reveal the right magnitude of temperature and rainfall trends occurred at a small scale. Therefore, to overcome this problem, the study was designed in South Gonder Zone.
In this study, the researcher examined precipitation and temperature trends in Addis Zemen (1996-2015), Nefas Mewcha (1986-2015) and Mekane Eyesus (1996-2015) stations for the given time scale. The aim of this study is to examine precipitation and temperature trends in South Gonder Zone at three meteorological stations. As a result, annual, seasonal, monthly rainfall and temperature data were analyzed to
detect trends of these climatic elements. To this effect, the finding of this study addressed the following questions. 1. What looks like the trends of climate change in the study area? 2. Is there any significance difference between the trends of annual, seasonal and monthly rainfall and temperature in the study area?
Materials and Methods
Descriptionof the study area
Geographically the South Gonder zone is located between 11002ʹ-12033ʹN latitude and 37025ʹ -380 43ʹE longitudes. The zone is bordered on the south by east Gojjam, on the southwest by west Gojjam and Bahir Dar, on the west by Lake Tana, on the north by north Gondar, on the northeast by Wag Hemra, on the east by north Wollo, and on the southeast by south Wollo; the Abbay River separates south Gondar from the two Gojjam Zones ( See Figure 1) (Birhan, 2017).
The climate of the zone is more influenced by altitude and latitude than others. Based on the simplified agro climatic classification of Ethiopia, it lies within four agro climatic zones. Wurch (Alpine) and Kola (tropical) accounts for 2.5% and 16% respectively whereas Woina Dega (Sub tropical) and Dega (temperate) account 27% and 54% of the zone. The zone has bimodal rainfall pattern, summer is the main rainy season with its peak in July (June to August) and the short rainy season from February to April. Rainfall varies from 900 mm to1599mm. The average annual rainfall in the zone is 1300mm.The average temperature in the zone is 170c. The farming system in the zoneis characterized by mixed farming. Hence, more than 85% of the farm households engage in mixed farming systems and more than 93% of the farm households plough their land using traditional farming technology (Birhan, 2017).
Data collection
Trend analysis of temperature and rainfall in south Gonder zone, Ethiopia
Journal of Degraded and Mining Land
Trend analysis of temperature and rainfall in south Gonder zone, Ethiopia
Journal of Degraded and Mining Lands Management
Figure 1. Map of the Study Area Source: Ethio GIS (2016)
The reasons behind selecting these stations are availability of the longtime data, minimum missing observations and representing almost all topography of the zone (Birhan, 2017).
Methods of data analysis
Data obtained from the meteoroidal agency was analyzed using version 20.0 Statistical Package for Social Science (SPSS) and XLSTAT 2016. Both descriptive and Mann-Kendall trend test were computed in data analysis. Hence, using descriptive statistical techniques such as minimum, maximum, mean, standard deviation, variance and coefficient of variation were computed whereas using Mann-Kendall trend test such as Mann-Kendall Stat(S), Kendall’s tau and P-value were computed to detect the trends of climate change. In general, the non-parametric Mann-Kendall test (Mann 1945, Kendall 1975) was used to assess the presence of significant trends in precipitation and temperature data. The Mann-Kendall statistic S of the series x is given by test (Mann, 1945; Kendall, 1975):
ܵ= ିଵ
ୀଵ
sgn൫ݔ−ݔ൯
ୀୀଵ
(1)
Where Xjand Xi are the annual values in years j and i,j>i, respectively, and
sgn൫ݔ−ݔ൯ቐ
1݂݅ ݔ−ݔ> 0
0݂݅ ݔ−ݔ= 0 −1݂݅ ݔ−ݔ< 0
(2)
A positive value of S connotes and “upward trend or increasing trends”, while a negative value of S indicates a “downward trend or decreasing trends”.
It is necessary to compute the probability associated with S and the sample size, n, to statistically quantify the significance of the trend. The variance associated with S is calculated from (Mann 1945; Kendall, 1975):
Var(S)
=݊(݊−1)(2n + 5)−∑18ୀଵݐ(ݐ−1(2ݐ+ 5) (3)
Where m is the number of tied groups and tkis the number of data points in group k. In cases where the sample size n > 10, the test statistic Z(S) is calculated from (Mann 1945, Kendall 1975):
Z= ୗିଵ ඥ୴ୟ୰(ୗ)if S>0
Z=0 if S=0 (4)
Z= ୗାଵ ඥ୴ୟ୰(ୗ)if S<0
The trend is said to be decreasing if Z is negative and the absolute value is greater than the level of significance, while it is increasing if Z is positive and greater than the level of significance. If the absolute value of Z is less than the level of significance, there is no trend. The desired value ofα(taken as 0.05 in this study) (Birhan, 2017).
Result and Discussion
Annual rainfall trend analysis
To determine a common period to all rainfall stations, some missing data were calculated using linear interpolation method. Trend analysis of the research area has been done in this study with of rainfall and temperature data. Kendall’s tau and P-value has been used for determination of trend. The annual and seasonal rainfall analyses of meteorological stations were computed based on the availability and reliability of the observed gauge stations. The meteorological stations such as Addis Zemen, Nefas Mewcha and Mekane Eyesus were used as a sample to see the trends of rainfall and temperature. The mean annual rainfall ranges from 1052 mm to 1347 mm in Nefas Mewcha and Addis Zemen in south Gonder zone. The duration of the study period of rainfall data analysis was chosen as (1997-215) 19 years for Addis Zemen, (1986-2015) 30 years for Nefas Mewcha and (1994-2015) 22 years for Mekane Eyesus.
Trend analysis of temperature and rainfall in south Gonder zone, Ethiopia
Journal of Degraded and Mining Lands Management 1116
Table 1. Annual total Rainfall variability
Stations N Minimum Maximum Mean Std.Deviation CV Addis Zemen 19 689.60 2446.80 1347.1474 481.13210 0.3571488168 Nefas Mewcha 30 741.60 1265.50 1052.3167 141.29981 0.1342749858 Mekane Eyesus 22 759.80 1675.80 1301.2909 203.54250 0.1564158329
Source: National Meteorological Agency (NMA, 2016)
To determine the monotonic trends of climate data time series Mann Kendall trend test which implements the non-parametric test or distribution free test were employed. Therefore, to determine the trend Mann Kendall tests were computed using statistical package of XLSTAT 2016. The analysis results indicate that all stations consecutive annual rainfall years are positive related. It is found to be statistically insignificant annual rainfall at the 5% level of significance. Hence, the computed p value is greater than the significance levelα= 0.05, Ho, (there is no trend) hypothesis is accepted. Therefore, the null hypothesis is accepted for all stations. In these
stations, annual rainfall has shown no trend as the computed p-value is greater than the significance levelα= 0.05 (Table 2). The risk to reject the null hypothesis is H0 while it is true is 8.1%, 27.2% and 47.8 % for Addis Zemen, Nefas Mewcha and Mekane Eyesus stations. Even though, the computed P value is greater than the significance level α= 0.05 and statistically insignificant, the positive value of Mann Kendall stat(s) shown the presence of increasing trend but statistically insignificant as the computed p-value is greater than the significance level α= 0.05 in the annual precipitation time series.
Table 2. Annual rainfall Mann-Kendall’s trend test results
Stations No.years Mann-Kendall Stat (S)
Kendall’s tau
P-value α Trend
Addis Zemen 19 41.000 0.240 0.081 0.05 No significant trend NefasMewcha 30 35.000 0.080 0.272 0.05 No significant
trend Mekane Eyesus 22 3.000 0.013 0.478 0.05 No significant
trend
Source: National Meteorological Agency (NMA, 2016)
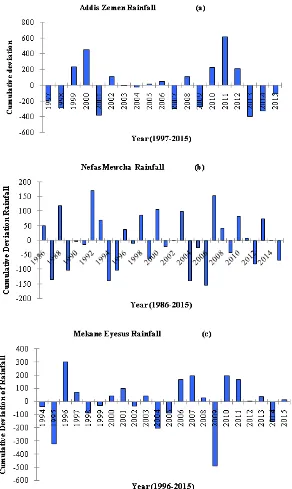
In this study, trends of total annual rainfall data for 19 years at Addis Zemen station have been analyzed during the period 1997-2015. Total annual rainfall data has shown an increasing trend of 357.08 mm per 10 years Figure 2(a). Figure 2(a) show the year with maximum rainfall occurrence in 2011with the total rainfall of 2447mm and minimum rainfall recorded in the year 1998 with the total of about 690 mm.
The trends of total annual rainfall data for 30 years at Nefas Mewcha station have been analyzed during the period 1986-2015. Figure 2 (b) show the year with maximum rainfall occurrence in 2000 with the total rainfall of 1266 mm and minimum rainfall recorded in the year 2004 with the total of about 742 mm. The total annual rainfall at Nefas Mewcha station is about 1052 mm. Even though the trend of rainfall is statistically insignificant but it is increasing 18 mm per 10 years.
Figure 2 show the year with maximum rainfall occurrence in 1996 with the total rainfall of 1676 mm and minimum rainfall recorded in the year 2009 with the total of about 760 mm. The total annual rainfall at Mekane Eyesus station is about 1301 mm. Total annual rainfall data has shown a decreasing trend of 13 mm per 10 years Figure 2(c).
Seasonal rainfall trend analysis
17.5 % and 17.8 % for Addis Zemen, Nefas Mewcha and Mekane Eyesus stations respectively whereas the coefficient of variation Spring rainfall in the research area are 68%, 44.8 and 32.8% for Addis Zemen, Nefas Mewcha and Mekane Eyesus stations respectively. Hence, the Belg rainfall is found much more variable (>30%) than the
Kiremet rainfall in which the coefficient of variation is greater than 30% over the study area. A similar conclusion that Belg rainfall is more variable than Kiremet rainfall was arrived at by Woldemlak and Conway (2009) in their study that analyzed rainfall data from 12 stations in drought-prone areas of Amhara Region, Ethiopia.
Trend analysis of temperature and rainfall in south Gonder zone, Ethiopia
Journal of Degraded and Mining Lands Management 1118
Table 3(a). Summer rainfall analysis
Stations N Minimum Maximum Mean Std. Deviation CV Addis Zemen 19 538.50 2293.40 1191.7474 458.15888 0.38444429449 Nefas Mewcha 30 450.6 1004.60 763.5133 134.84200 0.1766072706 Mekane Eyesus 22 481.80 1298.10 1012.4864 180.80763 0.1785778357
Table 3(b). Spring rainfall analysis
Stations N Minimum Maximum Mean Std.Deviation CV Addis Zemen 19 22.40 320.60 95.8632 65.21432 0.6802852398 Nefas Mewcha 30 37.20 461.10 178.9767 80.25638 0.448410343 Mekane Eyesus 22 91.90 287.90 159.5000 52.40617 0.3285653292
Source: National Meteorological Agency (NMA, 2016)
Regard to seasonal analysis of rainfall data of the study area, the following trend has been observed. Spring season revealed a downward trend in all stations which is also statistically insignificant as the computed P-value (i.e 1.00, 0.509 and 0.672) is greater than the significance level α= 0.05 for Addis Zemen, Nefas Mewcha and Mekane Eyesus stations respectively (Table 5). The risk to reject the null hypothesis H0 while it is true is 100%, 50.9% and 67.2 % for Addis Zemen, Nefas Mewcha and Mekane Eyesus stations respectively. On the other hand, summer season revealed upward trend in all stations but statistically insignificant as the computed p-value (i.e. 0.162, 0.317 and 1.00) is greater than the significance level α= 0.05 for Addis Zemen, Nefas Mewcha and Mekane Eyesus stations respectively (Table 4). The risk to reject the null
hypothesis H0 while it is true is 16.2 %, 31.7 % and 100 % for Addis Zemen, Nefas Mewcha and Mekane Eyesus stations respectively. Therefore, seasonal time series rainfall data did not shown a statically significant trend similar to annual time series data. From this study it was possible to note that, Kiremet( main rainy) season contribution to the annual total is 88.5 %, 72.6 and 60.4 whereas Belg (small rainy) season contribution to the annual total is 7%, 17% and 9.5% for Addis Zemen, Nefas Mewcha and Mekane Eyesus stations respectively. Hence, the contribution of Belg (small rainy) season particularly to Nefas Mewcha station is more important than the other two stations. In line with the present study, the NSMA (2005) noted that, the contribution of Belg rainfall over the north, northeastern, and eastern highlands is ranging from 5 to 30%.
Table 4. Seasonal RF Mann-Kendall’s trend test results
Stations Season No. years
Mann-Kendall Stat (S)
Kendall’s tau
P-value
α Trend
Addis Zemen
Belg (Spring)
19 -1.000 -0.006 1.00 0
0.05 No significant trend
Kiremet (Summer)
19 41.000 0.240 0.16
2
0.05 No significant trend
Nefas Mewcha
Belg (Spring)
30 -38.000 -0.088 0.509 0.05 No significant trend
Kiremet (Summer)
30 57.000 0.132 0.317 0.05 No significant trend
Mekane Eyesus
Belg (Spring)
20 -16.000 -0.069 0.672 0.05 No significant trend
Kiremet (Summer)
20 1.000 0.004 1.000 0.05 No significant trend
Cumulative deviation of rainfall
The cumulative deviations of rainfall pattern in the study area have been showed in Figure 3 (a, b and c). Results reveal that a cyclic pattern of variations with alternating drier and wetter years is observed. Hence, the annual rainfall in all three stations was characterized by alternative dry and wet years.The present study revealed that in all
stations annual rainfall has shown negative anomalies for much of the 2014 and 2015 years. In general, of the 19, 30 and 22 years of observation, 10 years (53%), 17 years (57%) and 9 years (41%) recorded below the long-term average annual rainfall for Addis Zemen, Nefas Mewcha and Mekane Eyesus stations respectively.
Trend analysis of temperature and rainfall in south Gonder zone, Ethiopia
Journal of Degraded and Mining Lands Management 1120
Temperature variability and trend
Mean annual temperature trend analysis
The study made by Johannes and Mebratu (2009) in Ethiopia, it is assumed that the temperature has been increasing annually at the rate of 0.2°C over the past five decades. The annual time series of minimum and maximum temperature for 40 stations averaged over Ethiopia reveals a warming trend in temperature and it is evident that the average annual minimum temperature is increasing much faster than the average annual maximum temperature (HDR, 2007).
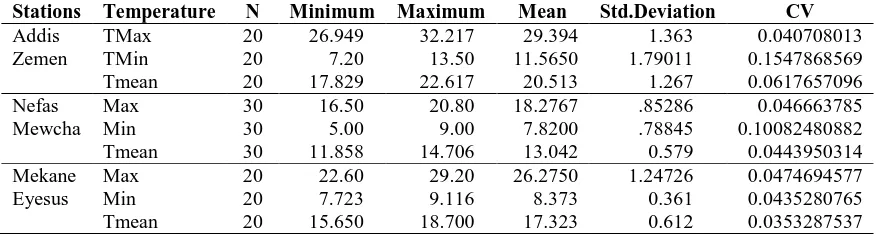
The mean annual and seasonal minimum and maximum temperature analysis of meteorological stations were computed based on the availability and reliability of the observed gauge stations. The meteorological stations such as Addis Zemen, Nefas Mewcha and Mekane Eyesus were used as a sample to see the trends of rainfall and temperature. Based on temperature analysis, the mean annual maximum temperature ranges from 18.30c to 29.30c in Nefas Mewcha and Addis Zemen whereas minimum temperature ranges from 50c to 7.70c for Nefas Mewcha and Mekane Eyesus stations at south Gonder zone. The duration of the study period of temperature data analysis was chosen as (1996-215) 20 years for Addis Zemen, (1986-2015) 30 years for Nefas Mewcha and (1996-2015) 20 years for Mekane
Eyesus. Table 5 shows the mean annual maximum, minimum and mean temperature among at all the three stations. The coefficient of variation of mean annual maximum temperature for Addis Zemen station is about 4% whereas 4.7 % and 4.8 % for Nefas Mewcha and Mekane Eyesus stations respectively. The mean annual maximum temperature ranges between 32.2 0c to 26.90c, 20.80c to 16.50c and 29.20c to 22.60c for Addis Zemen, Nefas Mewcha and Mekane Eyesus stations respectively. The mean annual minimum temperature ranges between 7.20c to 13.5 0c for Addis Zemen station while for Nefas Mewcha and Mekane Eyesus stations it ranges between 50c to 90c and 7.70c to 9 0c respectively. The mean annual mean temperature ranges between 17.80c to 22.60c, 11.80c to 14.70c and 15.60c to 18.70c for Addis Zemen, Nefas Mewcha and Mekane Eyesus stations respectively. The coefficient of variation for maximum temperature is 4%, 4.6% and 4.7% for Addis Zemen, Nefas Mewcha and Mekane Eyesus stations respectively. The coefficient of variation for minimum temperature is 15.4%, 10% and 4.3% for Addis Zemen, Nefas Mewcha and Mekane Eyesus stations respectively while the coefficient of variation for mean temperature is 6.2%, 4.4% and 3.5% for Addis Zemen, Nefas Mewcha and Mekane Eyesus stations respectively
Table 5. Annual average temperature variability
Stations Temperature N Minimum Maximum Mean Std.Deviation CV
Addis TMax 20 26.949 32.217 29.394 1.363 0.040708013
Zemen TMin 20 7.20 13.50 11.5650 1.79011 0.1547868569
Tmean 20 17.829 22.617 20.513 1.267 0.0617657096
Nefas Max 30 16.50 20.80 18.2767 .85286 0.046663785
Mewcha Min 30 5.00 9.00 7.8200 .78845 0.10082480882
Tmean 30 11.858 14.706 13.042 0.579 0.0443950314
Mekane Max 20 22.60 29.20 26.2750 1.24726 0.0474694577
Eyesus Min 20 7.723 9.116 8.373 0.361 0.0435280765
Tmean 20 15.650 18.700 17.323 0.612 0.0353287537
Source: National Meteorological Agency (NMA, 2016)
Like that of rainfall Mann Kendall trend test analysis for mean annual temperature shows statistically significant positive trends for Addis Zemen and Nefas Mewcha station but negative trends for Mekane Eyesus station. This is because of the computed p-value (0.036 and 0.015) is lower than the significance level of a=0.05 for Addis Zemen and Nefas Mewcha respectively. Therefore, the researcher should reject the null hypothesis. On the other hand, the computed p-value (0.1000) is greater than the significance
Addis Zemen station. Therefore, the researcher cannot reject the null hypothesis (HO).
The maximum temperature increasing trend analysis is found to be statistically insignificant as the computed p-value greater than the significance level of a=0.05 for Nefas Mewcha station. Therefore, the researcher cannot reject the null hypothesis (Ho). Conversely, the minimum temperature increasing trend analysis is found to be statistically significant as the computed p-value (i.e. 0.007) lower than the significance level of a=0.05 for Nefas Mewcha station. Therefore, the researcher should reject the null hypothesis (HO).
The maximum and minimum temperature showed no significant increasing trends as the computed p-value greater than the significance level of a=0.05 for Mekane Eyesus station.
There is a warming trend in the annual minimum temperature over the past 55 years with an increasing rate of about 0.370C in every ten years period. It has been projected that temperature could rise by 3.10C and 5.10C respectively by 2090 and 2060 (NAPA, 2007).The rates of change in minimum temperature have been higher than maximum temperature at all stations.
Table 6. Mean Annual Temperature Mann-Kendall’s trend test results
Stations No. years
Temper ature
Mann-Kendall Stat(S)
Kendall’s tau
P-value Α Trend
Addis Zeme 20 TMax 68.000 0.358 0.030* 0.05 Increasing
20 TMin 34.000 0.179 0.284 0.05 No
significant trend 20 Tmean 58.000 0.305 0.036* 0.05 Increasing Nifas
Mewucha
30 Max 40.000 0.092 0.486 0.05 No
significant trend 30 Min 136.000 0.0.314 0.007* 0.05 Increasing 30 Tmean 138.000 0.318 0.015* 0.05 Increasing Mekane
Eyesus
20 Max -22.000 -0.116 0.496 0.05
20 Min 54.000 0.284 1.000 0.05 No
significant trend
20 Tmean -16.000 -0.085 0.626 0.05 No
significant trend
Source: National Meteorological Agency (NMA, 2016)
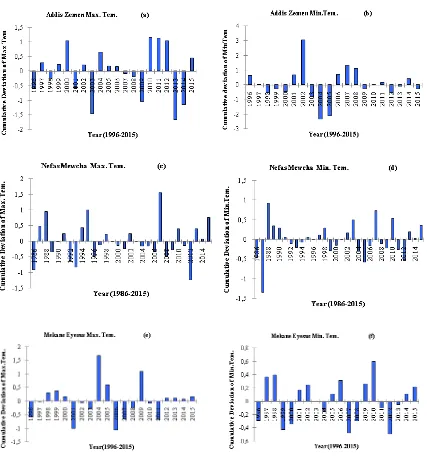
Figure 4(a, b and c) represents the mean annual maximum temperature and its trend in the period of under examination. Using a linear regression model, the rate of change is defined by the slope of regression line which in this case is about 1.6980c per 20 years, 0.813°C per 30 years and -0.280c per 20 years for Addis Zemen, Nefas Mewcha and Mekane Eyesus stations respectively. In general, according to a study made by UNFCC (2001) there have been general trends of average annual minimum and maximum temperature by 0.250c and 0.10C per decade respectively while the global climate has already warmed 0.740c since the beginning of the twentieth century. Therefore, the rates of change in mean annual temperature for Addis Zemen and Nefas Mewcha have been found greater than the
rate of change which was found at national and global level.
Cumulative deviation of temperature
Trend analysis of temperature and rainfall in south Gonder zone, Ethiopia
Journal of Degraded and Mining Lands Management 1122
periods of 1996-2015, 1986-2015 and 1996-2015 for Addis Zemen, Nefas Mewcha and Mekane Eyesus stations respectively. Results reveal that a
cyclic pattern of variations with alternating warming and cooling years have been suggested.
Figure 5. Cumulative deviation of temperature (a) Maximum (b) Minimum for Addis Zemen, (c) Maximum (d) Minimum for Nefas Mewcha and (E) Maximum (F) Minimum for Mekane Eyesus stations
respectively. Source: National Meteorological Agency (NMA, 2016)
Conclusion
This study investigated rainfall and temperature trend analysis in the case of south Gonder zone, Amhara, Ethiopia. The duration of the study period of rainfall data analysis was chosen as (1997-215) 19 years for Addis Zemen, (1986-2015) 30 years for Nefas Mewcha and (1994-2015) 22 years for Mekane Eyesus whereas the duration of the study period of temperature data
analysis was chosen as (1996-215) 20 years for Addis Zemen, (1986-2015) 30 years for Nefas Mewcha and (1996-2015) 20 years for Mekane Eyesus.
Trend analysis of temperature and rainfall in south Gonder zone, Ethiopia
Journal of Degraded and Mining Lands Management 1124
the null hypotheses (Ho) as the computed p-value is greater than the significance level of a=0.05. on the other hand, spring season rainfall reveals a downward trend whereas summer season rainfall reveals upward trend in all stations which is also statistically insignificant as the computed P-value is greater than the significance level α= 0.05 in all seasons. Like that of rainfall Mann Kendall trend test analysis for mean annual temperature shows statistically significant positive trends for Addis Zemen and Nefas Mewcha station but negative trends for Mekane Eyesus station.
Both maximum and minimum temperature reveals upward trend but statistically significant as the computed p-value lower than the significance level for maximum temperature whereas statistically insignificant as the computed p-value greater than the significance level for minimum temperature for Addis Zemen station. Both maximum and minimum temperature reveals upward trend but statistically significant as the computed p-value lower than the significance level for minimum temperature whereas statistically insignificant as the computed p-value greater than the significance level for maximum temperature for Nefas Mewcha station.
The maximum and minimum temperature shown no significant increasing trends as the computed p-value greater than the significance level of a=0.05 for Mekane Eyesus station.Belg rainfall has shown a decreasing trend as well as experienced large coefficient of variation. The annual rainfall in all three stations was characterized by alternative dry and wet years. The present study revealed that in all stations annual rainfall has shown negative anomalies for much of the 2014 and 2015 years. Similar to annual rainfall, mean annual temperature was also characterized by alternative warming and cooling years.
Recommendation
Under this investigation, the levels of variability of rainfall and temperature have been examined. The rates of change in mean annual temperature have been found greater than the rate of change which was found at national and global level. Therefore, small scale study should be undertaken to clearly detect the rate of climate change.
Acknowledgments
I would like to express my sincere thanks and appreciations to Debre Tabor University (DTU), for the financial and material support for this study. My special thanks also go to research and community service vice president, research directorate, social science dean,
social science research and community service coordinator and head of geography and environmental science for their review and technical help to run the finance. The author also extends his gratitude to my colleague in the department of Geography and Environmental Studies, social science faculty research committee and others who give me valuable comments at the proposal stage of the research.
References
Abate, S. 2009. Climate Change Impact on Livelihood, Vulnerability and Coping Mechanisms: A Case Study of West-Arsi Zone, Ethiopia. LUCSUS, Lund University SE- 22644, Lund, Sweden.
Birhan, G. 2017. Impacts of climate change on crop yields in south Gonder zone, Ethiopia. World Journal of Agricultural Research 5 (2): 102-110. http://pubs.sciepub.com/wjar/5/2/6
Deressa, T.T. 2006. Measuring the Economic Impact of Climate Change on Ethiopian Agriculture: Ricardian Approach. CEEPA Discussion Paper No. 21. CEEPA, University of Pretoria. South Africa. Easterling, D.R., Meehl, G.A., Parmesan, C.,
Changnon, S.A., Karl, T.R. and Mearns, L.O. 2000. Climate extremes: Observations, modeling, and impacts.Science289: 2068–2074.
IPCC. 2001. Climate change 2001: The Third Assessment Report of Intergovernmental Panel on Climate Change. Cambridge University Press, UK. IPCC. 2007a. Climate Change 2007:The Physical
Science Basis, Working Group 1 Contribution to the Fourth Assessment Report of the Intergovernmental Panel on Climate Change, Solomon, S., Quin, D., Manning, M., Chen, Z., Marquis, M., Avertyt, K., Tignor, M., and Miller, H. (eds), Cambridge University Press, Cambridge UK and Newyork, NY.
IPCC. 2014. The IPCC’s Fifth Assessment Report. What’s in it for Africa? - Executive Summary. Cambridge University Press, Cambridge, United Kingdom and New York, USA, 35.
Johannes, G.M. and Mebratu, K. 2009. Local innovation in climate change adaptation by Ethiopian pastoralists. PROLINNOVA-report, Addis Ababa, Ethiopia.
Kendall, M.G. 1975. Rank Correlation Measures; Charles Griffin: London, UK.
Klein Tank, A.M.G. and Können, G.P. 2003. Trends in indices of daily temperature and precipitation extremes in Europe, 1946–99.Journal of Climate
16: 3665–3680.
Kothawale, D.R., Munot, A.A. and Krishna, K.K. 2010. Surface air temperature variability over India during 1901–2007, and its association with ENSO.Climate Research42: 89–104.
Lautze S., Aklilu Y., Raven-Roberts A., Young H., Kebede G. and Learning, J. 2003. Risk and Vulnerability in Ethiopia: Learning from the Past, Responding to the Present, preparing for the future. Report for the U.S. Agency for International Development. Addis Ababa, Ethiopia.Ma nn, H.B. (1945) Non-parametric tests against trend.
Manton, M.J., Della-Marta, P.M., Haylock, M.R., Hennessy, K.J., Nicholls, N., Chambers, L.E., Collins, D.A., Daw, G., Finet, A., Gunawan, D., Inape, K., Isobe, H., Kestin, T.S., Lefale, P., Leyu, C.H., Lwin, T., Maitrepierre, L., Ouprasitwong, N., Page, C.M., Pahalad, J., Plummer, N., Salinger, M.J., Suppiah, R., Tran, V.L., Trewin, B., Tibig, I. and Yee, D. 2001. Trends in extreme daily rainfall and temperature in Southeast Asia and the South Pacific: 1961–1998. International Journal of Climatology21(3): 269–284.
McSweeney, C., New, M. and Lizcano, G. 2008. UNDP Climate Change Country Profiles: Ethiopia. Moberg, A. and Jones, P.D. 2005. Trends in indices for
extremes in daily temperature and precipitation in central and western Europe, 1901–99.International Journal of Climatology25(9): 1149–1171.
Moberg, A., Jones, P.D., Lister, D., Walther, A., Brunet, M., Jacobeit, J., Alexander, L.V., Della-Marta, M.P., Luterbacher, J., Yiou, P., Chen, D., Klein Tank, A.M.G.,Saladié, O., Sigró, J., Aguilar, E., Alexandersson, H., Almarza, C., Auer, I., Barriendos,M., Begert, M., Bergström, H., Böhm, R., Butler, C.J., Caesar, J., Drebs, A., Founda, D., Gerstengarbe, F.W., Micela, G., Maugeri, M., Österle, H., Pandzic, K., Petrakis, M., Srnec, L., Tolasz, R., Tuomenvirta, H., Werner, P.C., Linderholm, H., Philipp, A., Wanner, H. and Xoplaki, E. 2006. Indices for daily temperature and precipitation extremes in Europe analyzed for the period 1901–2000. Journal of Geophysisal
Research Atmospheres 111(D22),
DOI: 10.1029/2006JD007103.
NMA (2007) Climate Change National Adaptation program of Action (NAPA) of Ethiopia. Addis Ababa: NMA, Oxfam International.
NMS (National Meteorological Services). 2007. Climate Change National Adaptation Program of Action (NAPA) of Ethiopia. NMS, Addis Ababa, Ethiopia
NMSA (National Meteorological Services Agency). 2001. Initial National Communication of Ethiopia to the United Nations Framework Convention on Climate Change (UNFCCC).NMSA, Addis Ababa, Ethiopia.
Parry, M.L., Canziani, O.F., Palutikof, J.P., van der Linden, P.J. and Hanson, C.E. 2007. Climate Change: Impacts, Adaptation and Vulnerability; Cambridge University Press: Cambridge, UK. Plummer, N., Salinger, M.J., Nicholls, N., Suppiah, R.,
ennessy, K.J., Leighton, R.M., Trewin, B., Page, M.C. and Lough, J.M. 1999. Changes in climate extremes over the Australian region and New Zealand during the twentieth century. In Weather and Climate Extremes: Changes, Variations and a Perspective from the Insurance Industry;Karl, T.R., Nicholls, N., Ghazi, A., Eds.; Springer Netherlands: Dordrecht, The Netherlands, pp. 183–202.
Sheikh, M.M., Manzoor, N., Ashraf, J., Adnan, M., Collins, D., Hameed, S., Manton, M.J., Ahmed, U., Baidya, S.K., Borgaonkar, H.P., Islam, N., Jayasinghearachchi, D., Kothawale, D.R., Premalal, K.H.M.S., Revadekar, J.V. and Shrestha, M.L. 2015. Trends in extreme daily rainfall and temperature indices over South Asia.International Journal of Climatology35(7): 1625–1637.
UNFCCC .2001. Initial National communication under the United Nations Framework convention on climate change(UNFCCC) June 2001.
Vincent, L.A. and Mekis, E. 2006. Changes in daily and extreme temperature and precipitation indices for Canada over the twentieth century. Atmosphere-Ocean44: 177–193.
Webb, P. and von Braun, J. 1994. Famine and Food Security in Ethiopia: Lessons for Africa. Chichester: John Wiley & Sons.