Results of the 2016 Faculty Survey
INTRODUCTIONAs indicated in its constitution (Article I), the purpose of the BYUI Faculty Association (FA) is to “facilitate constructive communication between the university administration and the faculty.” With this in mind, the members of the FA general board strive to prepare and administer a survey each year to capture the collective and individual voices of the faculty. Our hope is that in evaluating and sharing the results of these surveys, we might enhance communication among the faculty and between the faculty and the administration. In addition, although the FA has no decision-making authority, we hope the administration will use these surveys to help guide the current and future direction of the university to the benefit of the wider community.
In 2015, the FA general board administered a “State of the Faculty” survey, in which we presented a “composite wellbeing” score for each faculty member who participated (Fig. 1). This survey generally identified a negative correlation between faculty wellbeing and years of employment, with a notable decline in wellbeing for those faculty members who have worked at BYUI for 11–15 years. Over the past several years, the FA has had an excellent relationship with the president and vice presidents of the university, and the FA executive board has met with them nearly every semester. Presidents Clark and Gilbert were very interested in and concerned about the trend of declining faculty wellbeing over time, and we discussed it extensively (along with other survey results). President Gilbert took such an interest in the pattern that he asked us (the FA executive board) to return to the data to better understand the causes for the decline in faculty wellbeing; thus, we returned to the 2015 survey data and examined them more thoroughly.
In particular, we concentrated on the comments of faculty members who had below average composite wellbeing scores. Those faculty expressed three primary reasons for declining wellbeing, including (in rank order): 1) fatigue and stress, mostly related to heavy teaching loads; 2) lack of professional engagement in their fields; and 3) administrative policies and practices. In addition, we evaluated their responses to this question: “What could the university do to better help you improve your professional wellbeing?” Generally, the faculty with lower than average wellbeing scores suggested that: 1) the university strategically hire faculty (both on campus and online) to
opportunities across campus departments; 2) provide more recognition of faculty contributions, both in the classroom and in their professional specialties; 3) increase the quality of dialogue across campus; and 4) help reduce faculty burnout by providing load reductions that are commensurate with administrative assignments and other non-teaching stewardships.
Figure 1. Faculty composite wellbeing scores from the 2015 survey. Orange squares represent mean values for each cohort. Brown line captures the trend in faculty wellbeing over time. Note the significant drop in faculty well-being in the 11–15 year group.
For the 2016 survey, we decided to explore more fully the primary concerns of the faculty that we discovered in the 2015 survey. In particular, we asked questions related to: 1) faculty work and wellbeing; 2) faculty development; and 3) administrative policies and practices. The 2016 survey was a collaborative endeavor, jointly produced by the FA executive board (Forest Gahn, Tiff Jenson, and David R. Peck), President Gilbert, and Vice Presidents Eyring and Burgener. In response to some faculty complaints that the survey included too many “double-barreled questions”, please note that we agree such questions should generally be avoided, but we did so knowingly and purposefully in a spirit of compromise between the FA executive board and the administration. Regardless, and as noted below, many such “double-barreled” questions are difficult to
Finally, please note the primary goal of this report is to present the collective voice of the faculty. Thus, the following is based on all data combined across categories of faculty status, college provenance (or lack thereof), years of employment, and gender. However, in a spirit of complete transparency, and as is typical of FA surveys generally, the data from the survey are provided with this report so anyone may further analyze the responses. In particular, the university administration may be interested in exploring inter-college patterns in the data, and the deans may wish to analyze responses from within their respective colleges.
Survey Demographics
About 280 faculty members participated in the 2016 survey, mostly CFS and pre-CFS faculty (Figure 2). Although the survey was also distributed among visiting faculty and many adjuncts, these groups make up a relatively small fraction of the survey participants (~20%). Moreover, from discussions with these faculty and their responses in the survey, it is clear that the concerns and experiences of visiting faculty and adjuncts are very different from those of pre-CFS and CFS faculty. Future surveys directed solely to non-CFS faculty would more comprehensively capture the voice of this underrepresented group.
Figure 2. Percent-normalized distribution of survey participants by faculty status (values rounded to the nearest whole number).
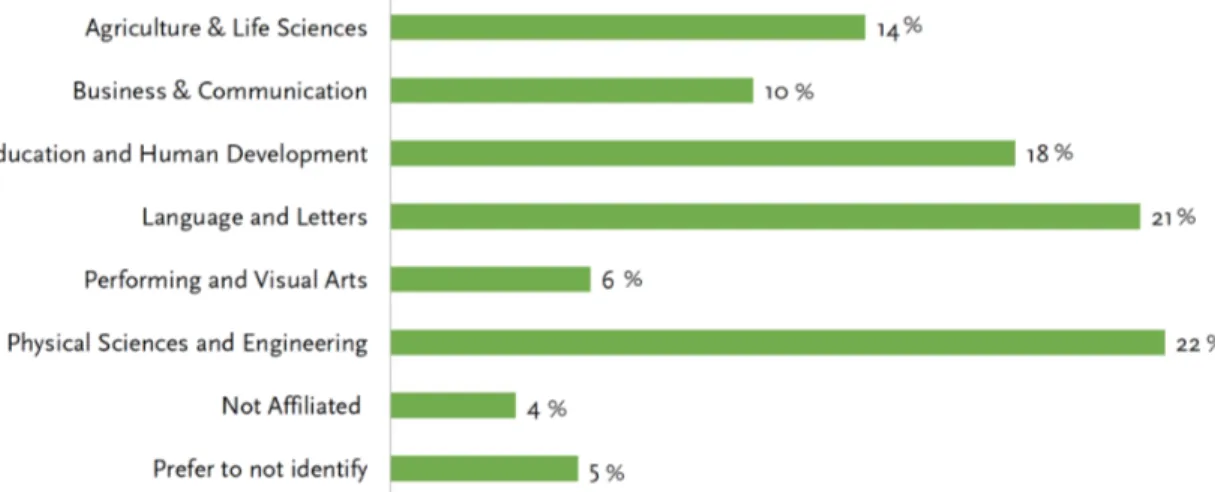
Most of the survey participants were from the Colleges of Physical Sciences and Engineering (22%) and Languages and Letters (21%), with the least participation from the Colleges of Business and Communication (10%) and Performing and Visual Arts (6%)(Figure 3). For reasons that are mostly unclear to us, this is a historically consistent pattern across FA surveys.
Figure 3. Percent-normalized distribution of survey participants by college (values rounded to the nearest whole number).
As might be expected, most (66%) survey participants were male (Figure 4). However, a disproportionate number of females (26%) participated in the survey (considering the male:female faculty distribution on campus). It is also reasonable to assume that most of the individuals in the “prefer to not identify” category are female given that self-identifying as female in some colleges may undermine anonymity.
Figure 4. Percent-normalized distribution of survey participants by gender (values rounded to the nearest whole number).
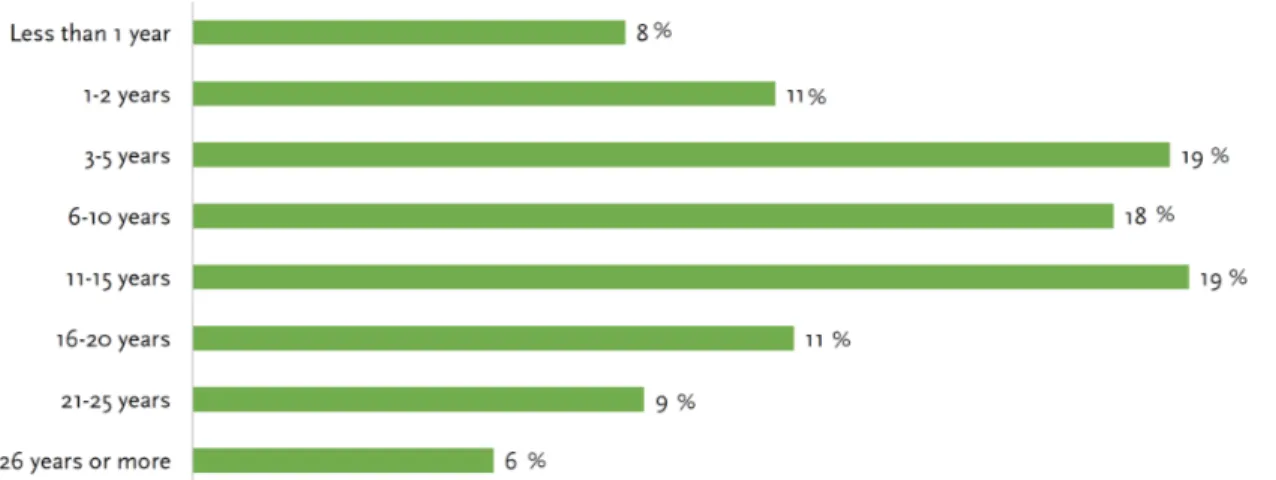
Finally, with respect to years of employment, most survey participants (55%) have worked at BYUI between 3-15 years, with about 19% being employed less than 3 years, and 26% being employed over 15 years (Figure 5). The greatest participation (~19%, 53 individuals) was from the critical 11–15 year cohort, the group that showed the lowest mean wellbeing scores (see Figure 1).
Figure 5. Percent-normalized distribution of survey participants by years of employment (values rounded to the nearest whole number).
Faculty Work
&
Wellbeing
We began the section on “faculty work and wellbeing” by asking faculty to self-report the average number of hours they work for BYUI both on and off campus in a typical week (Figure 6). A traditional full-time workweek consists of about 40 hours, and 80% of BYUI faculty reported working more than that. This is reasonable given that a typical BYUI full-time contract is for a 45-hour workweek. However, over 50% of BYUI faculty members reported working more than 45 hours per week, with 3.5% reporting working more than 60 hours per week on average.
Figure 6. Percent-normalized distribution of the average number of hours worked per week both on- and off-campus by BYUI faculty (values rounded to the nearest whole number).
We also asked faculty about perceptions of their workload (Figure 7). 49% of BYUI faculty reported their workload as being “heavy” or “too heavy”, a result that is consistent with 50% of faculty reporting working more than 45 hours per week (Figure 5).
Figure 7. Percent-normalized distribution of faculty perceptions of their workloads (values rounded to the nearest whole number).
One way to reduce workload is to reasonably delegate some responsibilities. Thus, we asked faculty to respond to this statement: “I effectively manage my workload by delegating some responsibilities to teaching assistants and department secretaries” (Figure 8). Faculty responded to this question with a range of 0 (strongly disagree) to 10 (strongly agree) with a mean of 5.9 (standard deviation 2.74) suggesting that many faculty members may be able to diminish their workload by delegating some tasks more effectively.
Figure 8. Percent-normalized distribution of faculty responses to this question: “I effectively manage my workload by delegating some responsibilities to teaching assistants and department secretaries” (values rounded to the nearest whole number). 0 = strongly disagree, 10 = strongly agree.
Related to work load and delegation, we also asked faculty to respond to this statement: “My job allows me to maintain a reasonable balance between work, family, church, and self” (Figure 9). Again, faculty responses ran the gamut with a mean of 6.65 (standard deviation 2.48). These results are generally favorable but demonstrate that many faculty members struggle to maintain a healthy work-life balance.
Figure 9. Percent-normalized distribution of faculty responses to this question: “My job allows me to maintain a reasonable balance between work, family, church, and self” (values rounded to the nearest whole number). 0 = strongly disagree, 10 = strongly agree.
Although some faculty members may consider their workloads to be heavy, that does not necessarily mean they find their jobs unsatisfying. Thus, we asked faculty to respond to this statement: “My job is personally and professionally satisfying” (Figure 10). Generally, faculty responded very favorably to this statement (mean 7.64, standard deviation 2.24), but there are clearly some faculty members who are very dissatisfied with their jobs. About 18% (54 respondents) reported values of 5 or less. However, it must be noted that this is a “double-barreled” question and is difficult to interpret unambiguously. This question asked faculty about both personal and professional satisfaction, which for some individuals could be very different things. For example, whereas one individual may be personally satisfied with their employment, they may be very unsatisfied professionally, especially if they consider their academic specialty to be their primary profession (e.g. an artist who teaches rather than a teacher who does some art).
Figure 10. Percent-normalized distribution of faculty responses to this question: “My job is personally and professionally satisfying” (values rounded to the nearest whole number). 0 = strongly disagree, 10 = strongly agree.
In the comments of the 2015 survey, many faculty members mentioned that they found their work stressful and frustrating. As President Gilbert commented during the preparation of the most recent survey, we have no previous baseline for levels of faculty stress at BYUI. Thus, we asked faculty to respond to this statement: “My job is frustrating and stressful” (Figure 11). The results of this survey indicate that while some faculty experience no significant stress or frustration in the workplace, others are on the opposite end of the spectrum (mean 4.56, standard deviation 2.81).
Figure 11. Percent-normalized distribution of faculty responses to this question: “My job is personally and professionally satisfying” (values rounded to the nearest whole number). 0 = strongly disagree, 10 = strongly agree.
To further explore faculty satisfaction and stress in the workplace, we gave faculty the opportunity to share comments related to both variables. In this vein, we next asked, “What factors most contribute to your job satisfaction at BYU-Idaho?” Given that this and other comment-driven questions were so open-ended, we (the FA general board) scored the qualitative responses for commonalities among faculty viewpoints. With respect to sources of job satisfaction, faculty overwhelmingly recognized working with great students and colleagues (Figure 12).
Figure 12. Top contributors to job satisfaction for BYUI faculty. Values indicate the number of unique times a particular contributor was mentioned by the faculty.
REPRESENTATIVE FACULTY COMMENTS
■ “The people that I work with (including students, faculty, administration
and staff) are generally kind, considerate, intelligent and motivated. I enjoy having a fairly flexible schedule that allows me to respond to demands from home and church duties as needed, and I also enjoy having time to write and focus on personal projects related to my field. Being able to teach in an environment that focuses on the student actually helps me feel more connected and satisfied with my work, and I enjoy opportunities to teach both inside and outside the classroom. Also, being able to talk openly about ways in which the Gospel informs my everyday life and my relationship with my field of study is wonderfully refreshing and strengthening.”
■ “Interaction with my colleagues and students. Discussion and debate on
topics of my field both in the classroom and among the faculty are some of the most satisfying aspects of working here. It is also very satisfying when I see real growth and application of course content and skills into the lives of my students and the way they think about and view the gospel, the world, and others around them. That is the reason why I chose to come to this university.”
■ “Being in a position to influence a student to the degree that it changes
their life and outlook of their future. Getting thank you notes from a student that is graduating, heading to a great job, and stating that they would not have had the same experience if it was not for me. This makes me feel good and have a sense of fulfillment from work. This is the only reason I put up with the incredible work load put on my shoulders at BYUI. I thought I had it rough as a business owner but I was mistaken.”
■ “I love some of the classes I teach. The students are for the most part
interesting and engaged, and the chance to participate with them in discussion and other activities is wonderful. I also love the chance to think about the subject matter of those classes and prepare for them. In addition, I gain great satisfaction from feeling that I have time to personally engage in my discipline and grow as an academic and person both through material that directly and indirectly applies to my field and teaching.”
■ “A good level of autonomy, environment (people, students, physical
facilities) and some flexibility. Help is available if some time is available to improve the teaching and learning responsibilities. Pay is very good as well as the benefits.”
Mirroring the question on top contributors to job satisfaction, we asked, “In cases in which you have experienced stress or anxiety at work, what were the primary causes?” Responses to this question were much more varied, but the most commonly recognized sources of stress or anxiety related to a heavy work load and insufficient resources, in addition to administrative policies and practices (Figure 13). A heavy workload and a lack of resources were often mentioned together; thus, they were combined into a single category during the analysis of this question. However, these variables are actually quite different and should have been categorized separately.
REPRESENTATIVE FACULTY COMMENTS
■ “Faculty overload (not by choice, but because student enrollment has
increased faster than faculty are being hired)”
■ “1. Too many students who need a lot of help. In some of my core
required foundations classes, there are many students who just aren’t ready. 2. Outside forces require me to change my teaching—and it’s not about changing for the better. It’s about changing to fit outside structures or delivery modes, like new technology, shorter semesters, odd calendars, odd requirements, etc.”
■ “Feeling trapped by the Administration and university policies which make
it impossible to find acceptable solutions to meet the needs of the everyday student and lower relative costs. Every solution proposed is blocked by someone for some reason.”
■ “Lack of understanding why certain administrative decisions are made. It
often seems that serving more students most often means diminishing the quality of experience for many. It feels more and more like the administration is trying to make BYUI a technical college.”
■ “We are getting a massive middle management at the University which
has created quite a chasm between faculty and the administration at the highest level. I am working so hard on these course developments that it takes up all my time. A negative side effect of that kind of focus is that one isolates themselves quite a bit. And to be honest, and this is terrible for me to admit this, but with the stress of the developing curriculum and bigger middle management, I could not tell you right now who the various vice presidents are and, I guess, there are probably various assistant vice-presidents but I don’t know who they are or what they are over. . . They seem so far away and irrelevant to what I am doing.”
■ “The biggest stress and anxiety is not having a “voice” or someone who
can listen and address my concerns without fear of some kind of retribution. I also feel that there are many “good ole boys and girls clubs” around here where there is preferential treatment given to some.”
Finally, in the section of the survey on “faculty work and wellbeing”, we asked the faculty to provide recommendations for “increasing faculty satisfaction and decreasing faculty stress and anxiety in the workplace.” Responses to this question were highly varied (thus we decided not to provide a categorical analysis of this question), and we suggest you refer to the raw data for a broader perspective, but the most common responses pleaded for more collaborative decision making across campus—less messaging and more dialogue. In addition, it’s very clear that some faculty would like more autonomy over their courses to maximize the quality of education (from their perspectives) and also more time to be engaged in their fields.
REPRESENTATIVE FACULTY COMMENTS
■ “Reallocate on-campus faculty resources (when people leave or retire)
between departments to help alleviate pressure in growing and overloaded departments. A faculty slot in a department should not be automatically filled again until all university needs have been considered).”
■ “The Administration needs to listen more and dictate less: The faculty
members at BYUI are highly competent and are experts in their fields (At least they were when they arrived). Let them decide how to best educate their students instead of being mandated from above in areas of which the Administration has no knowledge.”
■ “Think about the paradoxical directives faculty are given by the
Administration, such as replace lectures with experience-based learning (Learning Model) while class sizes double, triple, or even quadruple (efficiency). These are in opposition to one another. The result of larger class sizes is we are lecturing more than ever, are creating exercises that inexperienced undergraduate students can grade, and have replaced meaningful “show what you can do” exams with multiple choice tests that can be done out of sight at the Testing Center.”
■ “More diversity at the upper level of administration (e.g., President’s
Executive Group). From where I sit it looks like a good old boys club — women and minorities are not welcome, which is too bad; they have good ideas, their voices need to be heard.”
■ “Create genuine opportunities for regeneration that don’t require an act of
congress and an inordinate amount of time and energy to get approvals.”
■ “More time to engage in lifelong learning—pursuing content knowledge
beyond that which directly translates into course content. Solving the causes of stress and anxiety is more difficult since from my perspective, these are due largely to a departmental culture that has developed and I’m not sure how to change the culture. Greater transparency on the part of the administration, college leadership, and department would help. Clear, open, and honest explanations of why decisions were made would go a long way to improving things”.
■ “There seems to be a disconnect between online learning and campus
instructors. The message we as instructors are getting is that we need to keep our face to face and online courses as in-sync as possible. We tend to change our face to face courses incrementally through more of a continuous improvement approach. Online seems to want courses to be ‘done’ and then left alone for a period of 2-3 years. As a result their policies make it hard to do the continuous improvement that works best for us. We need to either be let off the hook on keeping face to face and online courses in sync, or online’s policies on course changes needs to change. It’s causing a huge amount of tension.”
Faculty Development
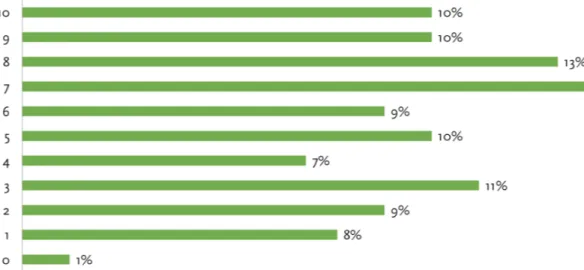
Numerous activities are included within faculty development, which is generally synonymous with professional development. Such activities may include but are not limited to: 1) curriculum development, 2) in-depth study of a topic related or unrelated to your area of expertise, 3) learning new teaching pedagogies, 4) attending a conference, or 5) doing primary research with or without students. Regardless of how one may define professional development, we were curious to know how many hours faculty members spend on professional development per week; thus, we asked, “Currently, during an average workweek, how many hours do you spend on professional development on and off campus?” The open-ended way in which we solicited data for this question makes it difficult to calculate an average number of hours faculty spend on professional development per week, but a rough estimate is about 5.5 hours. This equates to about 1-2 load hours per semester. However, given the “30+6” initiative on campus, it’s somewhat surprising that 21% of the survey respondents reported not being engaged in professional development at all, and 63% reported spending less than 6 hours on professional development per week (Figure 14). Note that 6 hours of professional development leave per year should equate to about 9 hours of professional development per week. From these results, in addition to faculty comments (see below), it appears that many of us who are receiving PDLs are allowing other activities to encroach upon our allotted PDL time. However, one difficulty in interpreting these results is, as mentioned above, the various interpretations of professional development across campus. Whereas some faculty may consider everything they do on campus to be professional development, others may restrict their definition of professional development to only those activities that relate to study and new learning within their chosen academic discipline.
Figure 14. Percent-normalized distribution of the average number of hours worked per week on professional development by BYUI faculty
Because of the open-ended way in which we asked the above question, many respondents chose to include comments with their responses that provide additional insights into this question.
REPRESENTATIVE FACULTY COMMENTS
■ “I read some, I work on creating new courses, and making new stuff for
existing courses, but it’s so integrated into every day that it’s difficult to conceive of as a separate category. I also do more of it between semesters than during semesters.”
■ “This year I have developed and started teaching two new 3 credit courses.
I averaged over 50 hours per week this semester and had several 60+ hour weeks. The majority of this time has been in course development and course improvement.”
■ “None. Too busy with online and course re-development. It’s a
never-ending cycle around here. No time to focus on the students or on our own skill set development.”
■ “I’m not sure how to answer this question because I think there is a
fundamental difference in the way that faculty define our development and the way administration talks about faculty development and that is apparent in the very way that this question itself is worded where the two most important aspects that the administration emphasizes in faculty development are mentioned but the one major aspect that the faculty seem to emphasize (Research) is left off the list. In terms of course improvement or student mentoring virtually every hour not spent in the classroom is spent on these two activities. However, faculty development also includes RESEARCH. Unfortunately, the way that the system is set up I have no time for research or getting up to speed with new information in my field which has a direct impact on the quality of my courses as they get more out of date with each year that passes and I don’t keep up with current information from my field. This means that the longer I am here and don’t engage in research in my field the lower the quality of my courses. I have written or rewritten 10 courses in just under three years that I have been on campus and that has taken up virtually every moment of my time that is not spent in the classroom. So, in terms of what I would say is most important to my actual ability to engage in course improvement and student mentoring I am able to spend very little time on faculty development (maybe a couple of hours a week).”
■ “A comment about this question: I don’t think that “course improvement”
should be properly classified as “faculty development,” even though faculty development often results in course improvement.”
In addition to gauging the number of hours faculty members were spending on professional development each week, we were interested
demonstrate that faculty engagement in professional development over the past year has been highly variable with 1% of faculty reporting not being engaged in professional development at all (a figure very different from that reported above, see Figure 14) and only 10% of faculty members reporting being engaged at a level that is entirely satisfactory to them (mean 5.7, standard deviation 2.85). It’s difficult to explain why 21% of the respondents reported not being engaged in professional development in one question (Figure 14) and only 1% in a similar question (Figure 15). One explanation for the discrepancy could relate to faculty not working on professional development during any of the three semesters but being engaged during the break between Spring and Fall Semesters, a window many faculty consider to be their only time for “real” professional development.
Figure 15. Faculty responses to the following question, “How would you describe your level of professional development over the last academic year?” 0 = “I haven’t been involved at all in professional development,” and 10 = “I have been involved in professional development in a manner that has been entirely satisfactory to me.”
We were also interested to know how faculty felt about their level of engagement in professional development over the course of their careers at BYUI. Given the increased support for faculty development since the implementation of the “30+6” initiative, we expected faculty to report greater satisfaction with their level of engagement in professional development over the past year than they had over the course of their careers at BYUI, but that was not the case. The results were essentially identical, with 1% of the faculty reporting “no engagement” and 9% reporting a level of engagement that is entirely satisfactory to them, personally (mean 6.13, standard deviation 2.38). In fact, an argument could be made for the career-long results being more positive than those for the past year. This outcome deserves further examination.
Figure 16. Faculty responses to the following question, “How would you describe your level of professional development over the course of your career at BYU-Idaho?” 0 = “I haven’t been involved at all in professional development,” and 10 = “I’ve been involved in professional development in a manner that has been entirely satisfactory to me.”
After asking questions about faculty engagement in professional development, we provided respondents with an opportunity to openly share their comments on the subject. The comments were highly varied, and we did not generate a meaningful analysis of the responses. However, many themes emerged. For example, many of the faculty expressed gratitude toward the administration for increased load release for professional development while at the same time citing a “lack of time” for professional development as a continued source of frustration. Moreover, numerous faculty members argued their research improves their teaching, curriculum development shouldn’t necessarily be considered as professional development, and that they’d like to see more support for travel.
REPRESENTATIVE FACULTY COMMENTS
■ “It has been refreshing and intellectually stimulating to work on an
interdisciplinary project between different fields on campus, with three faculty mentors from different fields and several students from each of our respective fields and some others. We hope to expand the number of students involved. It has been a great experience to see how my field intersects with other fields as well as in a practicable way to create something useful.”
■ “Only a certain part of course development and improvement is really
professional development. Submitting tickets to the online department and then resubmitting them because the students in the online department make the changes incorrectly is NOT professional development.”
■ “It’s really discouraging to hear top administrators make comments that
try to draw a distinction between professional development and quality teaching. Every minute I spend on professional development makes me a better teacher. My passion to do research and publish in my field fuels my teaching and makes me a more passionate and knowledgeable teacher.”
■ “My department’s top candidate for a faculty job was recently rejected by
the top administration. Based on things that were said and feedback that was given, most of us believe it’s because the candidate was also visibly involved in scholarship, even though this candidate was clearly the best teacher out of the group of candidates. If the president and administrators are indeed rejecting candidates for being involved in scholarship, in spite of what great teachers those candidates are, then the administration is making a commitment to mediocrity here and making choices that will be damaging to students and the institution.”
■ “I really love having the big meeting each Spring semester with a
well-known speaker to help us to keep our skills sharp and our knowledge up-to-date.”
■ “It is extremely hard to get approval in my experience. Unless it fits the
paradigm of those in the decision making process, it is hard to get approval. I don’t mind the work that goes into developing a proposal, but it goes through so many committees for approval, it seems not worth the effort.”
■ “I have never taken a semester leave in 15 years. I have not been
comfortable having my classes covered while I am away since no one else teaches most of what I teach, adjuncts would likely be scarce, and my classes are mostly required by students in my major. I also struggle to know what exactly I could do during that leave that would best benefit the department.”
Finally, we asked faculty to provide any recommendations they had “for improving the professional development experience for faculty across campus” Figure 17). Despite the implementation of the “30+6” model, many faculty still report they lack the sufficient time for engagement in professional development. From the data provided in this survey, and discussions across campus it seems that not all faculty are able to benefit from receiving 6 hours of professional development, in part because of departmental constraints. Moreover, even those faculty members who are fully vested in the “30+6” may be allowing other tasks and stewardships to encroach upon the allotted development time. Other notable suggestions include more institutional encouragement for faculty development, an improved process for the approval and reporting of proposals, and increased funding.
Figure 17. Faculty responses to the following question, “What recommendations do you have for improving the professional development experience for faculty across campus?”
REPRESENTATIVE FACULTY COMMENTS
■ “My impression is that professional development will increasingly take a
back seat to regular faculty load vis a vis on-line courses, being a course lead, and the related issues of hiring and maintaining a large cadre of on-line adjunct faculty.”
■ “I think the single best thing that could benefit professional development
at this time would be for the highest levels of campus leadership—the academic vice-president, the president, and even members of the Board of Trustees—to engage in a focused study of how professional development works best in each discipline on campus. In particular, I would recommend that these leaders spend significant time in the sciences, the humanities, and the performing arts (fields outside their area of expertise) learning how these disciplines operate, how students learn best, and how professional development works best and delivers the best returns on investment. This deep learning would necessarily involve a significant amount of time listening to (really listening to, not just humoring) faculty and students in those disciplines. If the campus leadership could really and truly understand the differences between disciplines many future professional development policies might be better structured to account for local circumstances (and I think the world “research” could be reintroduced to campus without its pejorative connotations or fears that it will overwhelm our admirable and desirable emphasis on teaching).”
■ “Please continue to speak to faculty about how important professional
development is, but stop giving speeches stating that we must do more with less. Such talk discourages some faculty from spending money to attend a class or conference.”
than it is worth—don’t make it so hard that it seems preferable to just show up to teach each day than try to do PD that increases work load. It should rejuvenate and re-energize the teacher and his abilities, not add an additional burden of work above normal load.”
■ “Professional development can take lots of forms, including presenting at
conferences and publishing articles. While I have no desire to do either of those things, I recognize that many of my colleagues do. I disagree with the premise that writing and publishing necessarily detracts from our ability to teach students. In fact, I think in many cases that sort of research enhances our teaching because those who do it become more engaged with and excited about their disciplines, practice the very thing they are trying to teach students to do, and have a better chance of thinking of themselves as co-learners with their students.”
■ “Do not allow administrative offices to make changes to pass their
responsibilities unto the faculty. For example, with Work Day, all of the hiring and processing of student jobs was pushed to the faculty. It is HR’s responsibility. By adding all that to the faculty or the department, it diminishes time from teaching and professional development.”
■ “Don’t try to control it quite so much. Let the faculty be the professionals
that they are. Don’t permit the few bad eggs who take advantage of the system, dictate the policies of the system.”
Administrative Policies
&
Practices
In past surveys, faculty members have cited numerous specific issues that broadly relate to administrative policies and practices. The BYUI Faculty Association has no decision-making authority and is careful to avoid making any demands on any specific administrator or the administration in general. Our aim in this regard is primarily to foster communication, which is one reason we spend so much time creating, analyzing, and discussing surveys such as this one.
With respect to how administrative policies and practices are discussed, decided, and communicated, faculty have often commented in past surveys on the dynamics of campus dialogue. Since communication in any organization is such an important component of establishing clear and agreeable policies and practices, we surveyed faculty members on their perceptions of the quality of communication at the level of departments, colleges, and the university as a whole (Figures 18-20).
Figure 18. Faculty responses to the following question, “I feel my ideas are heard and considered at the department level.”
Figure 19. Faculty responses to the following question, “I feel my ideas are heard and considered at the college level.”
Figure 20. Faculty responses to the following question, “I feel my ideas are heard and considered at the university level.”
As might be expected, these results indicate that faculty feel their ideas are most heard and considered at the department level. However, the proportion of respondents that “strongly agree” their ideas are “heard and considered” declines sharply from the department (48.7%) to the college (20.1%), and finally to the university (4.6%) level. Although communication among faculty and administrators should be best at the department level, there is room for considerable improvement in communication throughout the institution. There even appears to be some miscommunication on the concept of communication itself. Although improving communication has been a university level imperative, the focus is often on improving messaging rather than dialogue. In other words, instead of asking, “How may we better involve you in the decision-making processes on campus?” the faculty hear, “How can we best tell you what new policies and practices were are going to
that the faculty strongly desires an improvement in campus dialogue over messaging.
After providing the faculty with an opportunity to provide input on communication across campus, we asked two very open-ended questions. First, we asked faculty to describe the university policies, practices, and/or services” that most contributed their success as faculty members. The results, summarized in Figure 21, indicate that many faculty members feel well supported with respect to resources for professional development and course instruction, including office support staff and teaching assistants. In addition, many respondents cited various aspects of campus culture, including a high degree of flexibility in what they for professional development and in the classroom. Many faculty members feel that they not only have the support of the administration, but also their trust. Several faculty members also noted excellent compensation and benefits as contributing to their success.
Figure 21. A summary of faculty responses to the following question, “Please describe which university policies, practices, and/or services most contributed to your success as faculty member.”
REPRESENTATIVE FACULTY COMMENTS
■ “Professional Development Leaves is one policy in particular that
contributes to my success. I’d love to see a 4-3-2 come into play. PDLs allow me to prepare for current and upcoming courses better, as well as stay relevant and sharp in my field”.
■ “Faculty conferences and Brown Bag teaching/learning sessions. The
availability of TA’s. Availability of support services.”
■ “The honor code. It helps to teach students who are generally honest. The
learning model really helps me and helps the students enjoy class and learn to work with one another.”
■ “I appreciate the relative freedom (within reasonable constraints) to
organize and teach my classes as I see fit. That is wonderful blessing, and has allowed me the liberty to experiment with new ideas and constantly improve my teaching and student learning. Over the years, I have become better at what I do because of such freedom, coupled with generous university support (both psychological and financial) to help me explore new ways of learning and teaching.”
■ “Without our department secretary I think that I would be a little lost. She
is most helpful on keeping me informed and helping me resolve challenges.”
■ “The administration allows me a lot of autonomy. They ask for an
accounting of our program’s success but in the end they have complete trust in what we are doing as a program.”
We also asked respondents to comment on any university policies, practices, and/or services that might hinder their success as faculty members. The responses, summarized in Figure 22, were very diverse with many faculty members citing issues related to communication, such as the way in which broad-reaching, high-impact decisions are made. Many faculty members also feel the pressure of an increased work load and class sizes, a 3-semester teaching schedule, and regular switches to new learning management systems.
Figure 22. A summary of faculty responses to the following question, “Please describe which university policies, practices, and/or services that might hinder your success as faculty member.”
REPRESENTATIVE FACULTY COMMENTS
■ “The breakneck pace of implementing the latest university initiative or
program—many of which soon fizzle and are abandoned (in favor of some other great-sounding idea).”
■ “The way important software contracts are entered into seems to need
improvement.” The switch from Brainhoney to Brightspace can’t have been made very pragmatically. I refuse to believe there is no better LMS software out there than Brightspace. Brainhoney had some warts but was functional. Brightspace is a complete waste of faculty time, and I’m not sure the cost in stress and time were factored into the switch. Everyone should have been given a 3/4 teaching load the semester they had to switch.”
■ “I think a principle that’s useful here is the principle of solving problems
on the lowest level possible. I think the policies that work the best are the ones that come from or have a lot of input from the depts and colleges. When other entities try to run a dept or dictate policies, it often goes poorly and ruins morale.”
■ “Lack of interest in research in the scholarship of learning and teaching.
Are we a light on a hill, or are we placing our university under a basket? I believe we are doing the latter. If we are not, then show us some examples and enable us to research how students learn. Is the learning model really that effective? What data are there that support its effectiveness? What about Foundations? Is it an effective program? Are our students leaving more well-rounded and better educated? How do we know? What data can we collect to support that changes in our classes are actually improvements? If we find something that works really well we have a moral obligation to share that with the world by publishing the results. Yet we are not encouraged to do that, we are not encouraged to do anything with data we collect. In fact we are encouraged to do the antithesis — bury it away from the sight of the world.”
■ “I wish the messaging across campus focused more on academic
integrity, cheating, plagiarism, and hard work rather than on shorts and flip flops. I appreciated Pres. Clark’s call to students to put down the Pokemon Go and to study. I haven’t heard that for years. The only time we have all students together is at weekly devotional. I wish we could have an academic moment at the beginning of Devotional—like have a student say the most significant thing they learned that week—so we could remind students they aren’t just here to get married and go to church. Obviously, those are important, but they don’t need to pay tuition to get married and go to church. We need to help students focus on academics.”
■ “Be student focused is the message I came here on. Be economic focused
is the strongest message I am getting now. The president says he isn’t just about throughput, but all of the policies seem to say otherwise. When you just say that you value the other things it sounds good, but policies and behaviors have to back that up.”
■ “A. The perceived devaluation of physical books and the celebration of free
on-line texts in the absence of evidence that such a policy actually produces a quality educational experience. B. Academic departments are spatially fragmented which inhibits collaboration among faculty and student access to faculty (dramatic reduction in office hours visits)”
■ “Our oversold online offerings where cheating is rampant, completion
rates are not worth the resources poured into them, and the quality of learning is inferior. It is starting to hurt our brand.”
Finally, we gave the faculty the opportunity to provide any additional ideas they had for improving the faculty experience at BYUI. Again, comments were very diverse, and we did not provide an analysis for this question, but representative comments are found below. The full collection of comments is provided in the Excel file accompanying this report.
REPRESENTATIVE FACULTY COMMENTS
■ “I keep hearing the rhetoric of how different BYU-Idaho is from other
universities. I’ve been to four universities and good things happened in all of those places. I love my students and feel privileged to teach them, but it is exhausting. On hard days I think that the rhetoric of our uniqueness is sometimes offered instead of real solutions to real problems and fulfilling our responsibility to offer a real education. The consistent message that we need to learn to do more with less is disheartening at best.”
■ “It seems like people are talking past each other rather than having a true
dialogue. This may be happening in some areas or at some levels, but I don’t see it very often. Instead, I hear rumors and hearsay that obfuscates rather than clarifies policy and the direction things are moving. Let’s all try to communicate, listen, and clarify.”
■ “I really think we have a great overall atmosphere here at BYU-Idaho and I
want to thank the administration for working hard to maintain that even as the university experiences a variety of “growing pains.” Your work is appreciated and noticed!”
■ “Don’t stigmatize research. While I understand and support the
university’s choice to focus on teaching over research, those faculty who are doing research should not be stigmatized or portrayed as being somehow less consecrated or devoted to their students. Fluency in one’s field leads to better teaching; anyone hired here knows this isn’t a research university”.
■ “I wish that I was looked at as a professional that knows what it takes to
run a program rather than feel like I have to get every little thing approved by someone that I have never seen step foot in my building. Overall, I get the sense that administration has seen a light load on most of the faculty and
effort to cut costs. I fear that this load will get very burdensome due to a lack of understanding of what each faculty actually goes through each day”.
■ “Let’s focus more on offering the best, high quality teaching and learning
experience we can offer. Let’s let that imperative lead out in our discussions for a while.”
■ “I love my job. I love being here. I just want to silence the few crazy
religious fundamentalists among us and stop wrestling technology. Then things would be just about perfect.”
■ “When I first decided to leave the real world and bring my experience here
I was excited. I took a pay cut to do this, and thought it would be okay to do this since I would be able to teach others and associate with a common thread in the gospel. Since I have been here, my support for those at the helm to be inspired, and truly lead here, has dropped tremendously. It seems to be, “do what I say” and don’t question or attempt to go against the “chosen” that are in an administrative position. I expected more at this University, and have not seen it. I honestly try to find the positive in things, but with no presentation of the “why” with decisions made here, and the “do what I say” attitude I cannot say that I hope to stay. We talk about how important family is in this area and University, but when your work load is constantly driven by comments of “do more with less” and corners are being cut to squeeze more and more from people, you have to start asking when is enough. If your voice cannot be heard here and considered, what is the use to try to continue to improve? There is no voice for those in the trenches at this University.”
■ “I enjoy my work. I regard it as a blessing to be a part of BYU-Idaho. I have
great hopes that we will solve our problems and move forward.”
CONCLUSIONS
As faculty members of Brigham Young University—Idaho, we have much for which to be grateful. We work in a community of many shared values and goals. For the most part, we serve good-hearted students who have the capacity to inspire us, oftentimes even more than we inspire them. We work among wonderful colleagues, many of whom become dear friends. We are beyond the reach of the typical “publish or perish” pressures of higher education, and we need not acquire large external grants to justify our existence. This promotes a relatively unique brand of academic freedom; we may engage in scholarly pursuits according to the desires of our hearts rather than the constraints of the word, in particular those mandated by funding agencies and popular trends in academia. We are well compensated for our work, not only in terms of salary, but also with respect to benefits and a beautiful workplace. The trees and flowers around campus are striking, and our facilities are remarkably clean and tidy.
However, not all is roses. Although some faculty members view the university as beyond reproach, others consider it beyond repair. The respondents in this survey were full of praise, but also discontent. Perhaps most troublesome are the seemingly growing number of faculty (based largely on conversations across campus) who did not participate in the survey at all because they feel their efforts are futile—their voice doesn’t matter. The results of this survey strongly demonstrate that the faculty is pleading for better communication across campus, not top-down messaging, but rather real dialogue about the big decisions that impact the quality of student education and faculty wellbeing.
The greatest source of strain on faculty wellbeing relates to a heavy workload. Many of those who sincerely strive to meet all the demands of the university are overwhelmed and working well beyond 45 hours per week. Some of this is likely self-inflicted, but it can be challenging to keep pace with the number of courses we teach, the rate of change in curriculum and technology, and the requirements of other stewardships. Despite our best intentions, all this activity sometimes results in attitudes and actions that are not in the best interests of our students. Ironically, our general state of busyness at the university can undermine connections to our areas of specialty, and as a consequence, our competence and passion for the material we teach. Realizing this, many faculty members are pleading for more professional development opportunities. The “30+6” is a great stride in the right direction, but not all departments are able to adopt it, and some individuals feel there is no time for professional development despite increased support from the university.
This and other recent Faculty Association surveys demonstrate that workload, professional development, and communication are among the greatest and most persistent concerns among the faculty, but there are many more. As expressed by the respondents, these challenges often result in an “us vs. them” attitude that leads us to forget we’re on the same team—we share the same broad vision and a love for our students and one another. BYUI is unique to the degree in which the faculty administers the university; in fact, it is important to recognize that most of our administrators are also faculty members. This should diminish the magnitude of “faculty” vs. “administration” sentiments across campus. Many of us sacrificed significant worldly pursuits and honors to be here, yet we came because of strong impressions to do so, and all of us have joined the BYUI family only after being embraced by a department and thoroughly vetted by the administration. This university is full of wonderful and brilliant people who are full of insights and inspiration, and the best way to move forward—the best way to uplift the campus community as a whole—is to improve our