Using an Expert Panel to Validate a Requirements Process Improvement
Model
Sarah Beecham
1, Tracy Hall
1, Carol Britton
1, Michaela Cottee
2, Austen Rainer
11Department of Computer Science, 2Business School
University of Hertfordshire
In this paper we present components of a newly developed software process improvement model that aims to represent key practices in requirements engineering (RE). Our model is developed in response to practitioner needs highlighted in our empirical work with UK software development companies. We have now reached the stage in model development where we need some independent feedback as to how well our model meets our objectives. We perform this validation through involving a group of software process improvement and RE experts in examining our RE model components and
completing a detailed questionnaire. A major part of this paper is devoted to explaining our validation methodology. There is very little in the literature that directly relates to how process models have been validated, therefore providing this transparency will benefit both the research community and
practitioners. The validation methodology and the model itself contribute towards a better understanding of modelling RE processes.
Keywords: Requirements engineering; expert panel; software process models; process model validation; empirical analysis.
1: Introduction
In this paper we describe how we use a panel of experts to validate our Requirements Capability Maturity Model (R-CMM1). This validation study represents the final stage of the first cycle of model development. In previous work we explain our rationale for building the model [1] and how we have identified best practices to populate the model [2]. The R-CMM aims to represent key requirements practices within a maturity framework. A primary objective of this model is to guide software practitioners to relate processes to goals in order to prioritise their requirements process improvement activities.
The R-CMM takes its characteristics from the Software Engineering Institute’s (SEI) Software Capability Maturity Model (SW-CMM). We believe that the SEI process maturity framework has considerable strengths. Since its release in 1991, the SW-CMM has become increasingly popular as a method of controlling and improving software practices [3]. The SW-CMM continues to be supported by the SEI as an integral component of their recently released ‘CMMI’ that combines many of the SEI models into one framework [4].
We have reached a stage in development where we need to evaluate whether the motivation for building the R-CMM is justified and whether the model reflects the needs of the software industry [5]. In this paper we present our validation methodology and report the findings of a detailed validation questionnaire that involved a group of experts in the fields of requirements engineering and software process improvement (SPI). It is an exploratory study that looks at the strengths and weaknesses of our improvement model at this early stage of development. Although the validation of results is an essential part of research it remains relatively rare in computer science publications; our validation strategy should therefore be of interest to researchers and will benefit practitioners [6, 7].
1®CMM is registered in the U.S. Patent and Trademark Office. Carnegie Mellon University has not participated in
1.1 Terms used in this study
Terms such as ‘requirements’, ‘specification’, ‘requirements engineering’ and ‘RE’ are often used in the literature to embrace the whole of the requirements ‘process’ [8]. The term ‘requirements engineering process’ or ‘RE process’ as used in this study, refers to activities performed in the requirements phase that culminate in producing a document containing the software requirements specification [9]. More specifically, the RE process is the set of activities required to gather, specify, validate and engineer a set of requirements [10],[11]; whereas ‘a requirement’ is defined as “a feature or behaviour of the system that is desired by one or more stakeholders” [10]. This study focuses on the ‘RE process’ and not the individual feature or behaviour of the system.
Our view of the RE process takes a complementary approach to existing work. We suggest that multiple factors affect the production of the requirements specification and an important class of factors are those internal to the development organisation. Our approach is analogous to Procaccino et al's study [12] of the multiple factors affecting software development success. For a rationale of how we categorise and define the RE process, please see Appendix A.
Validation is defined as “the process of ensuring that the model is sufficiently accurate for the purpose at hand” [13], or whether the right model is being built [14]. At this stage of development we are not looking to verify whether the model directly meets the needs of specific users, instead, we test whether this largely generic model meets the initial criteria for building the model in the first place. We do not directly evaluate the model’s ‘quality, usability and utility’ [15] as at this exploratory stage of
development the model has not been tailored sufficiently to allow this [14]. We validate the model in order substantiate that the components possess a satisfactory range of accuracy consistent with the intended application of the model [16].
1.2 Overview of R-CMM development
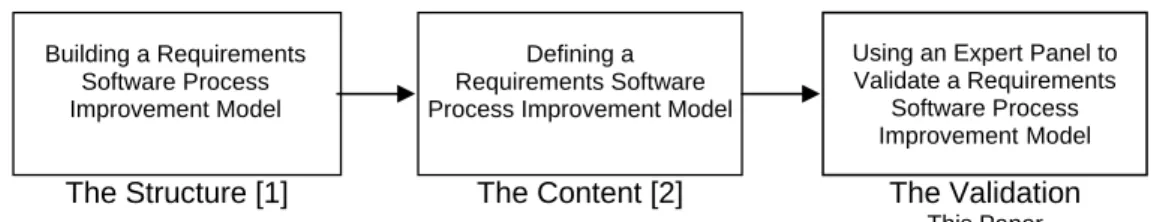
The three main stages of our model development comprise: creating a model structure; populating the model with defined processes and validating the model. These three strands of work are reported separately as shown in Figure 1.
The Structure [1] Building a Requirements Software Process Improvement Model Defining a Requirements Software Process Improvement Model
The Content [2] The Validation
This Paper Using an Expert Panel to Validate a Requirements
Software Process ImprovementModel
Figure 1: Three dimensions of model development
Results from this validation phase will impact the continuing development of the R-CMM and constitute the main driver for our future work.
This paper is organised as follows. Section 2 gives a brief overview of the RE problem area, our empirical work and our rationale for building the model. In Section 3 we present our validation process, our aims and objectives. We conclude this section by listing our success criteria (identified during the initial stages of model development) against which we will validate the R-CMM. In Section 4 we give two key R-CMM model components which were given to the experts to validate. In Section 5 we explain our rationale for using a panel of experts to validate the model. In Section 6 we give a detailed description of our survey instrument to include questionnaire design, piloting the
questionnaire and how we plan to use responses to validate the questionnaire. In Section 7 we present the results of our questionnaire. In Section 8 we discuss our results and assess how well our model meets our objectives. We conclude the paper in Section 9 with a summary and directions for future work.
2: Requirements Capability Maturity Model (R-CMM) overview
The primary motivation for building the R-CMM emanates from our previous empirical research with twelve software development companies [17, 18]. Our research highlighted problem areas in software development that led to a detailed study of the RE problems practitioners were experiencing [19]. The study examined the first four SW-CMM levels. One of our most significant findings agrees with Paulk et al [3] that, “although software engineers and managers often know their problems in great detail, they may disagree on which improvements are most important”. A primary aim of the R-CMM, therefore, is to highlight strengths and weaknesses in the RE process in order to help organisations agree on a strategy for improvement.
Although there is little published evidence relating to how the SEI validated their SW-CMM, many studies have reported limitations with this model of SPI. Fundamental design flaws include weak links between process improvement goals and customer expectations, contradictory sets of assumptions about organizational culture and order of process implementation; vague and incomplete sets of processes, e.g. [19-24]. A problem of SW-CMM ‘interpretation’ is highlighted by Gilb [25] who states that models such as the CMM are “well-intentioned and contain some really good ideas. The problem is that they are often misunderstood, mistaught, and misapplied”. This risk of the SW-CMM being misinterpreted is also a theme in an experience report from Potter and Sakry [26] who explain that the SW-CMM’s process-centric approach can lead people to mistake documentation for progress. The R-CMM, although a specialisation of the SW-CMM, attempts to address these embedded design weaknesses. For example, in recognition of the on-going problem of interpretation and approach, the R-CMM guides practitioners to set business goals prior to embarking on a process improvement effort. The main reasons for using the SW-CMM as a basis for creating our specialised RE process
improvement model, include:
• Pragmatism (it is the most used software process improvement model) • Tailorability (it is a normative model designed to be adapted)
• Support (it is a ‘living’ model that is continually being updated by the SEI)
• Empiricism (our original motivating data emanates from companies who use SW-CMM) • Results (benefits reported include decrease in costs and development time, increase in
productivity and quality), (see, for example,[27])
In order to identify problems in RE and prioritize process improvement activities, our specialized RE process improvement model isolates the RE process. The R-CMM takes the advice given by Paulk et al [3] and guides practitioners to focus on “a limited set of activities” and “work aggressively to achieve their goals”. A primarily motivation for building the R-CMM therefore, is to ensure that RE needs are identified and included in company goals.
3: Model validation process
The main processes involved in validating the R-CMM are: 1. Highlight the objectives for building the model;
2. List the criteria identified during the initial stages of model development;
3. Explore alternative methods for testing how the criteria are reflected in the model; 4. Design a validation instrument to test the success criteria (to include methods for
reporting/analysing responses);
5. Select an expert panel to reflect the population of experts in CMM and RE; 6. Present results of the validation instrument;
7. Relate results to the success criteria to gain an impression of strengths and weaknesses; 8. Discuss how these strengths and weaknesses might affect our objectives.
3.1 Aims and objectives
We aim to develop a model that represents key practices in RE within a maturity framework. A primary objective of our R-CMM is to guide software practitioners to relate key RE processes to goals in order to prioritise their requirements process improvement activities. The R-CMM should
strengthen components of the SW-CMM to clearly focus on the RE process. Our model should complement the SW-CMM so that practitioners are not required to learn another software process improvement methodology. Finally, we aim to link theory to practice through a model that is easy to use and interpret.
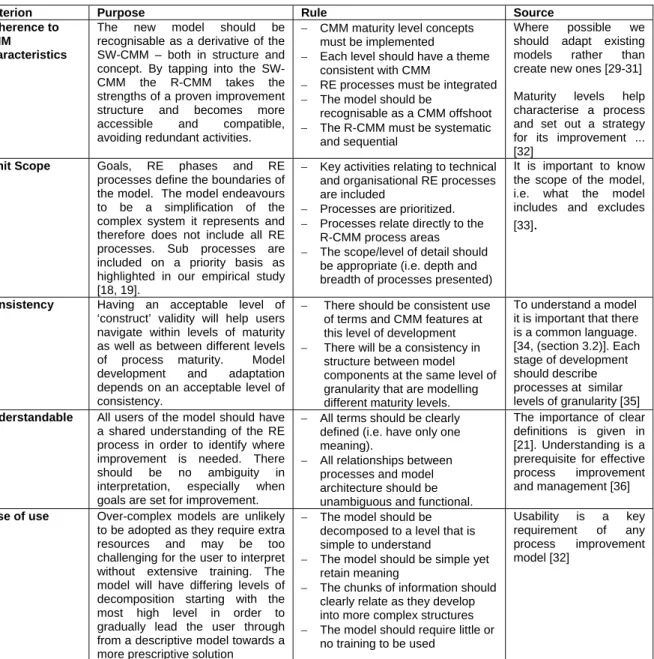
3.2 Success criteria
Seven success criteria were initially identified to guide the development of the R-CMM. These criteria are presented in Table 1. The criteria were identified using a method similar to that used in the SPICE trials to support the ISO/IEC 15504 emerging standard [28]. Results and analyses of our validation based on these criteria are given in Sections 7 and 8.
Table 1: Criteria for R-CMM Development
Criterion Purpose Rule Source
Adherence to CMM
characteristics
The new model should be recognisable as a derivative of the SW-CMM – both in structure and concept. By tapping into the SW-CMM the R-SW-CMM takes the strengths of a proven improvement structure and becomes more accessible and compatible, avoiding redundant activities.
− CMM maturity level concepts must be implemented
− Each level should have a theme consistent with CMM
− RE processes must be integrated − The model should be
recognisable as a CMM offshoot − The R-CMM must be systematic
and sequential
Where possible we should adapt existing models rather than create new ones [29-31] Maturity levels help characterise a process and set out a strategy for its improvement ... [32]
Limit Scope Goals, RE phases and RE processes define the boundaries of the model. The model endeavours to be a simplification of the complex system it represents and therefore does not include all RE processes. Sub processes are included on a priority basis as highlighted in our empirical study [18, 19].
− Key activities relating to technical and organisational RE processes are included
− Processes are prioritized. − Processes relate directly to the
R-CMM process areas − The scope/level of detail should
be appropriate (i.e. depth and breadth of processes presented)
It is important to know the scope of the model, i.e. what the model includes and excludes [33].
Consistency Having an acceptable level of ‘construct’ validity will help users navigate within levels of maturity as well as between different levels of process maturity. Model development and adaptation depends on an acceptable level of consistency.
− There should be consistent use of terms and CMM features at this level of development − There will be a consistency in
structure between model components at the same level of granularity that are modelling different maturity levels.
To understand a model it is important that there is a common language. [34, (section 3.2)]. Each stage of development should describe processes at similar levels of granularity [35]
Understandable All users of the model should have a shared understanding of the RE process in order to identify where improvement is needed. There should be no ambiguity in interpretation, especially when goals are set for improvement.
− All terms should be clearly defined (i.e. have only one meaning).
− All relationships between processes and model architecture should be unambiguous and functional.
The importance of clear definitions is given in [21]. Understanding is a prerequisite for effective process improvement and management [36]
Ease of use Over-complex models are unlikely to be adopted as they require extra resources and may be too challenging for the user to interpret without extensive training. The model will have differing levels of decomposition starting with the most high level in order to gradually lead the user through from a descriptive model towards a more prescriptive solution
− The model should be decomposed to a level that is simple to understand
− The model should be simple yet retain meaning
− The chunks of information should clearly relate as they develop into more complex structures − The model should require little or
no training to be used
Usability is a key requirement of any process improvement model [32]
Tailorable The model must be structured so that it can be extended and tailored to particular development environments
− The structure must be flexible − The structure must be modular − The structure must be
transparent
Model development may involve some changes and additions to the process as a result of … individual application needs [3]
Verifiable Model strengths and weaknesses need to be tested to help direct future model development. Validation of the model will help to improve the model, add confidence in its representation and help with research in this area.
− The model must be verifiable, i.e. we must be able to test/measure how well model meet its objectives and whether meeting these objectives leads to a high quality model of RE.
To assess whether a process is useful, well implemented the model needs to be verifiable
[37]
4: Key components of the R-CMM
Figure 2 indicates how the overall structure of the R-CMM is based directly on that of the SW-CMM. As with the SW-CMM, the RE process matures from an ad-hoc, undefined level to a continuously improving level. Figure 3 provides a fragment of the detail of the R-CMM. The figure shows how a goal at a given R-CMM level (in this case, Level 2) can be assessed by investigating several questions, each question relating to a detailed process recommendation. Figure 2 and versions of Figure 3 were given to the expert panel for validation. This is discussed in more detail in Section 6. 5: Expert panel
5.1 Using an expert panel in a model validation exercise
According to Hakim [38], small samples can be used to develop and test explanations, particularly in the early stages of the work. Previous studies have used small samples to gain expert feedback to evaluate and support model development. For example, Dybå [39] used 11 experts to conduct his review process, and El Emam and Madhavji [40] interviewed 30 experts to elicit criteria for their instrument to evaluate RE success. The value of expert knowledge is also recognised in a recent evaluation of software quality that suggests methods to formally capture expert judgement [41]. The reliability of using expert judgement is shown in other work. For example, Lauesen and Vinter [23] found that the ability of experts to predict techniques to prevent requirements defects were very high when put into practice. Another positive outcome is observed in the work of Kitchenham et al [42] in their analysis of the accuracy of several methods of estimating project effort. Their statistical analysis revealed that a human centred estimating process incorporating expert opinion can
substantially outperform simple function point models.
5.2 The population of experts from which our participant panel was drawn
We emulate previous studies that validated improvement models and measurement ‘instruments’ by inviting a panel of experts to complete a detailed questionnaire, see for example, [27, 39, 40]. We targeted experts from different backgrounds and audience groups as recommended by Lauesen and Vinter [23] and Kitchenham et al [43]. Experts were drawn from a population of experienced
practitioners and researchers in the areas of CMM software process improvement and RE. These areas of expertise are represented to ensure that in the early development, practitioner needs and researcher knowledge are fed back to the R-CMM. SEI recommendations for experts participating in a process assessment support this cross-section of knowledge
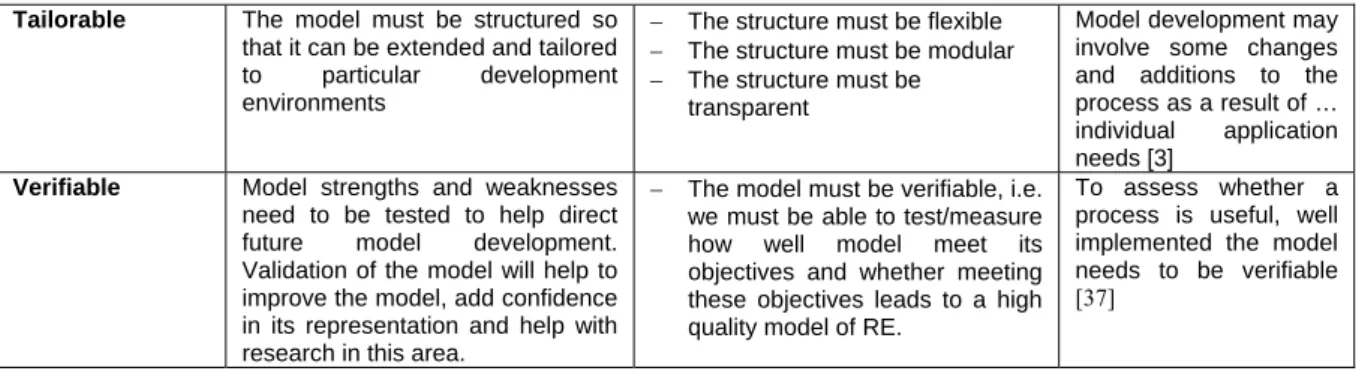
CMM Level 3 Defined software processes CMM Level 2 Repeatable software processes CMM Level 4 Managed software processes CMM Level 5 Optimizing software processes D is c ip lined pr oc e s s S tan dar d c ons is tent pr oc es s Level 2 Requirements
Repeatable requirements processes – standard requirement processes are documented and instituted within similar projects.
Focus on project level standards
Goal: Implement a repeatable requirements process
Level 1 Requirements
Ad hoc requirements processes Requirements problems are common
There are no goals defined at this unstructured level
CMM Level 1 Initial/ad-hoc softwareprocesses
Level 3 Requirements
Requirements processes are defined and are consistent across all projects.
Focus on organisation wide communication and standards
Goal: Implement a defined requirements process
Level 4 Requirements
All requirements processes are measured and managed to assess where improvements are needed and produce predictable outcomes Focus on measurement
Goal: Implement a managed requirements process
Level 5 Requirements
New improved methods/tools instituted within stable & predictable environment allowing optimisation of existing requirements processes Focus on continuous improvement
Goal: Implement an optimising requirements process Pr e d ic tabl e p roc es s C onti n u ous ly im pr o vi n g p roc es s Key: SEI’s SW CMM (Paulk et al, 1995) R-CMM Maturity Level goal
GOAL QUESTION PROCESS
Key:
Q = Question (T) = Technical Process P = Process (O) = Organisational Process
How repeatable is your requirements management process? Q1 P1 P2 P3 P4 P5 P7 How repeatable is your analysis and negotiation process? Q3 P5 P6 P8 P9 P10 P13 P17 P19 How repeatable is your documentation process? Q4 P6 P8 P9 P10 P13 P14 P15 P16 P19 How repeatable is your validation process? Q5 P6 P8 P10 P13 P18 P19 P20 How repeatable is your elicitation process? Q2 P6 P8 P10 P11 P12 P13 P19 Level 2 Requirements Goal repeatable process requirements Implement a
Figure 3: Level 2 goal-focused requirements processes – a high level analysis
P1: Follow a written organizational policy for managing the system requirements allocated to the software project (O)
P2:
Establish project responsibility for analysing the system requirements and allocating them to hardware, software, and other system components
(O)
P3:
Implement training programme to recognise and meet technical and organisational requirements project needs
(O)
P4: Establish process to identify stakeholders in the
requirements phase of the project (O)
P5:
Provide adequate resources and funding for managing the allocated requirements in project (e.g. time, budget, people, tools)
(O)
P6: Establish process to identify skills needs within project, e.g. UML, formal methods, good communication (O&T)
P7: Institute process to maintain organisational stability within project, e.g. control staff change (O)
P8: Explore alternative solutions, requirements techniques and tools for the project (T)
P9: Establish/maintain process to involve key stakeholders within the project (O)
P10: Establish/maintain process to reach agreement with customer on requirements for project (O)
P11:
Set realistic goals to address business requirements and requirement process improvement needs within the project
(O)
P12: Establish/implement process to assess feasibility and external environment of project (O&T)
P13: Establish/maintain repeatable requirement traceability process that is project based (T)
P14: Establish a repeatable process to manage complex requirements at project level (T)
P15: Establish a repeatable process to manage vague requirements (T)
P16: Establish a repeatable process to manage requirements growth at project level (T)
P17: Establish a repeatable process to manage user understanding at project level (T)
P18: Monitor progress of the set requirements goals from P11 (O)
P19: Agree and document technical and organisational attributes specific to project (O&T)
P20:
Establish a process to review allocated requirements within the project to include software managers and other affected groups
(O)
5.3 Expert panel response rate
We invited twenty-seven experts to participate in validating the R-CMM and twenty-three accepted (representing a take-up rate of 85%). However, twenty completed questionnaires were received representing a response rate of 87% of experts who accepted our invitation to participate. As we are unable to confirm the reason for the non-participation of the 13% of experts who agreed to participate and did not return their questionnaires, some likelihood of bias is present. However, according to SPSS [44], a response rate of over 80% is unlikely to bias survey results.
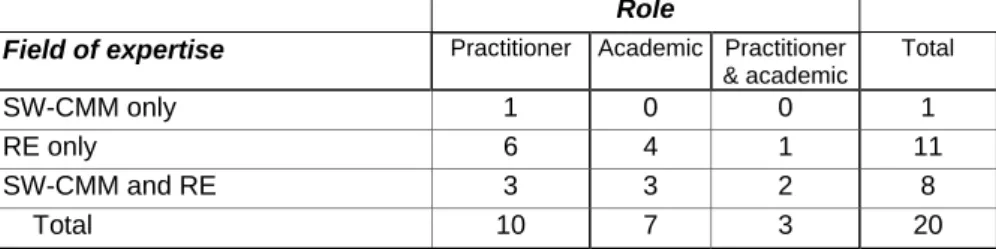
5.4 Expert panel demographics
Table 2 classifies our experts according to their own assessment and our knowledge of their expertise. It shows that almost all the experts have a good or expert knowledge of RE (95%), whereas only 45% of participants have a good or expert knowledge of the SW-CMM. Experts were targeted in academia for having published work in RE and/or SPI, whereas our industrial experts were selected for their experience in the field of RE and/or implementing improvement programs. Appendix B gives a breakdown of the R-CMM validation panel who agreed to be named.
Table 2: Distribution of expertise in the R-CMM validation expert panel
Role
Field of expertise Practitioner Academic Practitioner & academic Total SW-CMM only 1 0 0 1 RE only 6 4 1 11 SW-CMM and RE 3 3 2 8 Total 10 7 3 20 6. Survey Instrument
The data collection method significantly influences the data analysis process that can be used in the research [45]. At this exploratory stage we need to replicate questions directly associated with our model criteria. We therefore chose the questionnaire as our primary data collection method as it is best suited to the nature and type of data that we need to analyse. Results from this questionnaire are used to indicate possible strengths and weaknesses within the model and generate theory where we consider the wider implications of experts’ attitude to the SW-CMM and RE process.
6.1 Questionnaire design
Questions are used to explore model components which are grouped together to satisfy each success criteria as shown in the entity relationship diagram in Figure 4.
Questions Question Section 1 Question Section 2 Question Section The R-CMM Model Component 1 Model Component 2 Model … ….3, etc M Success Criteria Adherence to CMM … ... Verifiable 1 1 M
Figure 4: Relationship between Success Criteria, Questionnaire Design and R-CMM model
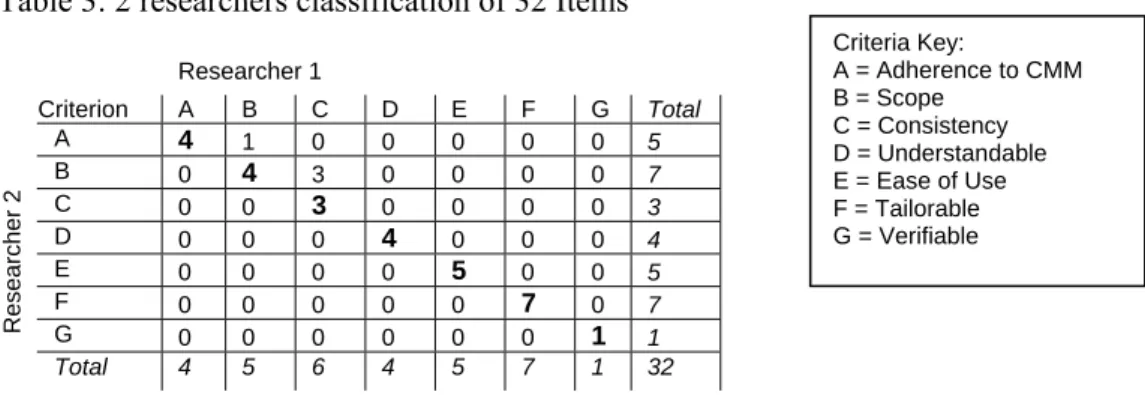
The entity relationship model in Figure 4 shows that we combine multiple items in our questionnaire to test each success criteria to help average out possible errors in single item responses [39]. A comparison is made to show how two independent researchers group the questions according to our success criteria and rules. We test the reliability of these categorizations through the Cohen’s kappa (κ) statistic where agreement between the evaluations of two raters (rating the same object) is
measured [46]. The data showing the level of this agreement is shown in Table 3, the numbers in bold show where the two researchers agree.
Table 3: 2 researchers classification of 32 Items Researcher 1 Criterion A B C D E F G Total A 4 1 0 0 0 0 0 5 B 0 4 3 0 0 0 0 7 C 0 0 3 0 0 0 0 3 D 0 0 0 4 0 0 0 4 E 0 0 0 0 5 0 0 5 F 0 0 0 0 0 7 0 7 Researcher 2 G 0 0 0 0 0 0 1 1 Total 4 5 6 4 5 7 1 32 Criteria Key: A = Adherence to CMM B = Scope C = Consistency D = Understandable E = Ease of Use F = Tailorable G = Verifiable
The kappa statistic for this inter-rater reliability test is .85 which indicates an almost perfect agreement [47]. However taking a more general benchmark that “a kappa of 0.7 or more is usually considered to be an acceptable level of agreement” [48] we can be confident that the groups of multiple items in the questionnaire do indeed relate to the associated criteria. However, an analysis of the 4 disagreements resulted in 2 items being moved to a more suitable criterion. The test was therefore useful in
confirming a high level of agreement as well as highlighting individual inconsistencies in item classification.
6.2 Pilot Study
In order to uncover potential problems in the design and application of the questionnaire we ran a pilot study involving five researchers in the fields of RE and SPI. Prior to releasing their questionnaire, Berry and Jeffery [49] ran a test on each item in order to assess respondents’ level of understanding, level of knowledge, level of difficulty in responding and level of relevance to subject area. We dealt with these 4 points through examining the pilot test responses and making changes as a result of the feedback as follows:
• Level of understanding: In some cases pilot study participants did not feel qualified to answer the questions. As a result of this feedback we created a web-page that included further definitions and background information relating to the model. Personal contact details were also given for any specific information.
• Level of knowledge: Experts were targeted specifically for their level of knowledge in a particular model related area. The questionnaire had a ‘no opinion’ or ‘don’t know’ option against all model related questions. Experts were told that they were not expected to be an expert in all areas in the covering letter.
• Level of difficulty in responding to the question: Our pilot study did not highlight any
problems in responding to the questions. However, we included a further comments section at the end of the questionnaire. In practice the design of our response scale proved workable with the exception of 3 items where a participant felt it necessary to add a further scale. In all cases the added response was a ‘neutral’ category. In the absence of a defined ‘neutral’ category we may in some cases be forcing participants to give a ‘no opinion’ response when they have an opinion. We therefore emphasise that the ‘no opinion’/‘don’t know’ category includes the neutral response.
• Level of relevance. None of the pilot study participants questioned the relevance of the questions. However, earlier changes to the questionnaire involved deleting company affiliation demographic information. This is because the experts’ direct experience needed for validating the R-CMM may have little or no connection with the company they work for.
We also used the pilot study to assess the level of time commitment required to complete the questionnaire which we estimated to be 1 hour.
6.3 Placing responses in context
We sent each member of the expert panel a questionnaire and an accompanying R-CMM
documentation booklet2. The accompanying documentation comprises a set of model components that
guide the expert from a high level framework view through to a detailed guideline view of the R-CMM. It also gives an overview of the purpose of the R-CMM and what it is endeavouring to represent. The documentation also includes a method for assessing the strength of a RE process. For more details see [50-52].The analysis of questionnaire responses falls in three categories:
(1) Establish the expert’s view on the established SW-CMM as a process improvement model; (2) Note how strongly the expert felt about the need for RE process support; and
(3) Measure the experts’ perception of how well the model complied with the success criteria. We need to be aware of the possible effect that results from activities 1 and 2 above. This is because the way experts view the SW-CMM and the current RE process may influence their responses to the focus of this validation exercise, which is to test how well the R-CMM complies with our success criteria as indicated in (3) above.
6.4 Response categories
We are aware of the importance of relating our outcome measures to the objectives of the study [43]. In a similar study to our own, Dybå [39] considers the relative merits of different measurement scales and concludes that a 5 point attitude scale is the most reliable measure, whereas, by contrast, El Emam and Birk [27] use a 4 point attitude scale in their validation questionnaire.
We chose to use both scales in the questionnaire to suit the granularity of response required. We provide examples here of how we used a 5 point scale (Figure 5), and how we used a 4 point scale (Figure 6). Figure 6 also shows that for our analysis, we collapse and dichotomize the 4 point scale data to view responses as either ‘supportive’ or ‘critical’ of the model. Although this conversion results in a slight loss of information, viewing responses in two categories eases interpretation and analysis of the data. Also, we argue that collapsing the data in this way is less subjective as one person’s ‘agree’ may be another person’s ‘strongly agree’.
Too few Correct number
Å Æ
Too many No
opinion
(1) (2) (3) (4) (5)
“Does the model have the right number of processes
at this level?” [ ] [ ] [ ] [ ] [ ] [ ]
Figure 5: Example of a bi-polar 5-point attitude scale
We exclude the ‘no opinion’ scores from our analyses as these responses are neither supportive nor critical of our model. El Emam and Birk [27] also collected their data through a questionnaire, however they regarded the ‘Don’t know’ responses as missing values and proceeded to assign values to this response category using the method of multiple imputation. We do not consider this method appropriate for our study considering the small size of our sample. We therefore do not incorporate the ‘no opinion’, ‘missing’ or ‘neutral’ responses into our analysis of the strengths and weakness of the R-CMM.
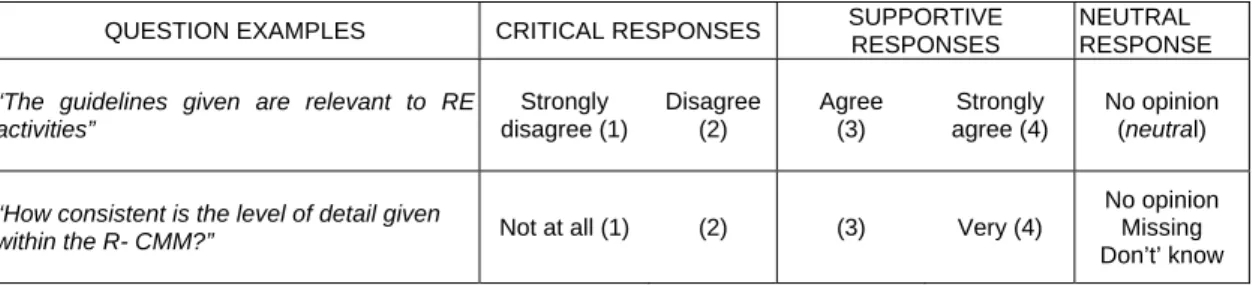
QUESTION EXAMPLES CRITICAL RESPONSES SUPPORTIVE RESPONSES
NEUTRAL RESPONSE “The guidelines given are relevant to RE
activities” Strongly disagree (1) Disagree (2) Agree (3) Strongly agree (4) No opinion (neutral)
“How consistent is the level of detail given
within the R- CMM?” Not at all (1) (2) (3) Very (4)
No opinion Missing Don’t’ know Figure 6: Example of an ordinal 4 point attitude scale
To avoid the problem of ‘participant acquiescence’ we sometimes reverse the supportive response categories [53], e.g. for some questions, the values of (1) and (2) are supportive whereas in a few questions the same values (1 and 2) are interpreted as critical of the model.
6.5 Confidence Intervals
As we designed the R-CMM we may be biased in our design of the survey instrument and how we evaluate the responses. We argue that the subjective design of the survey instrument is unavoidable and a limitation of a study involving a small group of people with limited time-scales and resources. However we endeavour to counter the potential weakness in our evaluation of the survey by reporting all responses to the questionnaire as raw scores, prior to making any observations about these scores. (See [54] for a full validation report including raw score tables).
The experts involved in this study are not a large group selected through a scientific sampling method, although we believe them to share many characteristics with the population of experts as a whole. Although it is possible to use the sample data to calculate the proportion of the sample ( ) which is supportive of each statement, and this sample value is our best estimate of the value of this proportion in the population, it is unlikely to be equal to the population value. Based on the calculation of the standard error of the sample statistic, we can place an interval around the sample statistic that specifies the likely range within which the population value is likely to fall. This interval is called a confidence interval [55].
pˆ
The term confidence interval refers to the degree of confidence, expressed as a percentage, that the interval contains the population proportion. A 95% confidence interval will contain the population value 95% of the time. This means that 5% of intervals constructed will not contain the population value. The width of the confidence interval (CI) is determined by the confidence level and the sample size, n, which is used in the calculation of the standard error of the estimate. CIs use a critical value (z value) from the standard normal distribution, corresponding to the confidence level. The higher the degree of confidence, the wider the confidence interval - we have chosen to construct 95% confidence intervals, as this is the most conventional value, analogous to carrying out significance tests at the 5% significance level. The larger the sample size, the smaller the standard error and the narrower the confidence interval. As we are restricted to a maximum sample size of 20 (in the case where there are no missing values) we expect our confidence intervals to be quite wide. We therefore exercise caution when reporting our results.
The formula for the calculation of the confidence interval for a proportion used by El Emam and Jung [56] is found in most standard statistics textbooks, for example, [44, 57]. However, use of this formula requires the sample size n to be quite large, and/or the proportion to be approximately equal to a half. A rule of thumb for the use of this formula states that n and n(1- ) must both be >5 [57]. This is unlikely to be the case for our data. As such, we will instead use the formula for the score confidence interval due to Wilson (1927) in [58] and given below
pˆ
⎟⎟ ⎠ ⎞ ⎜⎜ ⎝ ⎛ ⎟⎟ ⎟ ⎟ ⎠ ⎞ ⎜⎜ ⎜ ⎜ ⎝ ⎛ ⎥⎦ ⎤ ⎢⎣ ⎡ − + + ± + z p p z n n z n n z p /2 ˆ(1 ˆ) 2 /2/4 / / 1 2/2/ 2 2 2 / ˆ α α α α
where n = number of valid responses, = proportion of supportive responses, α = 0.05 for a 95% CI, and z(α/2) = 1.96 from tables of the standard normal distribution. Agresti and Coull [58] show that this formula, unlike that used by El Emam and Jung [56], gives the desired level of confidence "for virtually all combinations of n and p".
pˆ
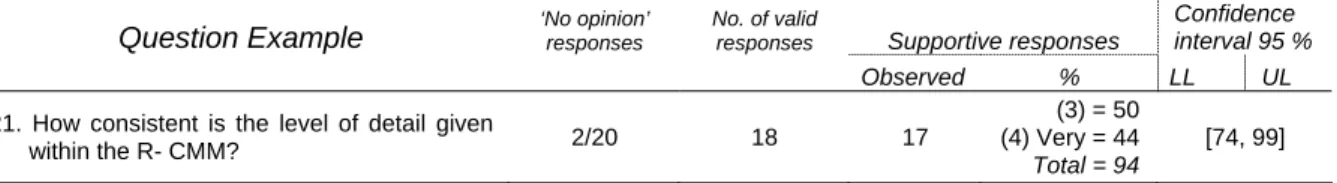
Figure 7 is an extract from our results tables in Section 7. The figure shows how we interpret the responses to a question where 18 experts gave a valid response, and 94% of the responses were supportive. Using an alpha level of 0.05, the 95% confidence interval with Lower Limit (LL) 74%, and Upper Limit (UL) 99%, allows us to state that we are 95% confident that the proportion of supportive responses for the whole population of experts would fall within this [74%, 99%] range. Therefore, it is unlikely (a 5% chance) that support among the population would fall below 74% or above 99%.
Question Example ‘No opinion’ responses
No. of valid
responses Supportive responses
Confidence interval 95 %
Observed % LL UL
21. How consistent is the level of detail given
within the R- CMM? 2/20 18 17
(3) = 50 (4) Very = 44 Total = 94
[74, 99]
Figure 7: Reporting Confidence Intervals 6.6 Benchmarks
El Emam and Jung [56] set 80% supportive responses to be the threshold for taking action based on developer feedback. With our small sample size, we look to the confidence intervals (CIs) to guide us towards interpreting the true level of support given to each item. As we have used multiple items to address most of our criteria, we use our results to compare, in relative terms, where the model’s strengths and weaknesses are. Where the CI does not include 80% or above, we take as an indication that more work is required in this area of the model. Conversely, model strengths are indicated by both the UL and LL being 80% or above. This is a high target as combining the CI formula with our sample size means that this can only be achieved with 100% support from over 14 valid responses. 7. Questionnaire Results
This section presents our experts’ responses to the questionnaire. (See [54] for detailed information on the responses). The numbering of the questions in the tables reflects the order in which they appear in the questionnaire. The terms ‘framework’ and ‘model’, as used in the questionnaire, refer to a
‘skeleton’ representation as well as a more developed, granular description of the RE process. We use the term ‘item’ to refer to the question and all its associated results (the row of results). The term CMM refers to the SW-CMM and not the R-CMM.
7.1 Attitude to SW-CMM
As stated in our introduction, the R-CMM is based closely on the overall structure of the SW-CMM. Therefore, experts’ opinion on the strengths and weaknesses of the SW-CMM may affect their perception of the R-CMM. The confidence levels in Table 4 indicate that some experts are critical of aspects of the SW-CMM. Of particular concern to our study is the response to Item 16 showing some disagreement that the SW-CMM reflects current best practices. There is, however, a general
Table 4: Expert attitude to SW-CMM
Supportive responses
Confidence interval 95% Questions ‘No opinion’ responses
No. of valid responses
Critical
responses Observed % LL UL
13. The SW-CMM clearly defines software rocess activities p 2 18 4 14 Agree = 56 Str agree = 22 Total = 78 [55, 91]
14. The SW-CMM's 5 stage framework helps companies to prioritise process implementation 2 18 4 14 Agree = 67 Str agree = 11 Total = 78 [55, 91]
15. The SW-CMM framework can be tailored to suit a company's specific needs
6 14 3 11
Agree = 64 Str agree = 14 Total = 78
[52, 92]
16. The guidelines in the SW-CMM represent
current best practice in software 6 14 6 8
Agree = 57 Str agree = 0 Total = 57
[33, 79]
In order to assess whether individual perceptions of the SW-CMM are carried through to the R-CMM validation, we divided the participants into those who were critical of the CMM (n = 9) and those who were not (n = 9). An exact chi-squared test and a 3Mann-Whitney U test were performed to compare
how the two groups responded to seven key R-CMM related items [59]. The chi-squared test results shows no significant association between row and column variables and the Mann-Whitney U test results indicate that, in general, the two sets of responses are drawn from identical populations (n critical = 9, n supportive = 9, p > 0.05 in six out of the seven key questions). Therefore, experts who are critical of the SW-CMM and experts who are supportive of the SW-CMM are giving similar responses to R-CMM related questions.
7.2 The RE Process as a problem
Table 5: Expert Opinion of the RE process
Supportive responses Confidence interval 95% Questions ‘No opinion’ responses No. of valid responses Observed % LL UL
5. There is evidence to suggest that companies have
problems with their RE process 0 20 20
Agree = 20 Str agree = 80 Total support = 100
[84, 100]
6. It is likely that the RE process leads to more problems in
development than other software engineering activities 0 20 19
Agree = 45 Str agree = 50 Total support = 95
[76, 99]
7. In general, the RE process is in need of improvement 1 19 19
Agree = 32 Str agree = 68 Total support = 100
[83, 100]
There is a consensus amongst the experts that in general the RE process is in need of further improvement as companies continue to experience problems with this software development phase. Only 1 expert believed that the RE process does not cause more problems in development than any other software engineering activity.
7.3 R-CMM Success Criteria:
Multiple item responses to the seven success criteria as detailed in Table 1 (Section 3) are presented in the following sub-sections.
7.3.1: Success criteria one: Adherence to SW-CMM
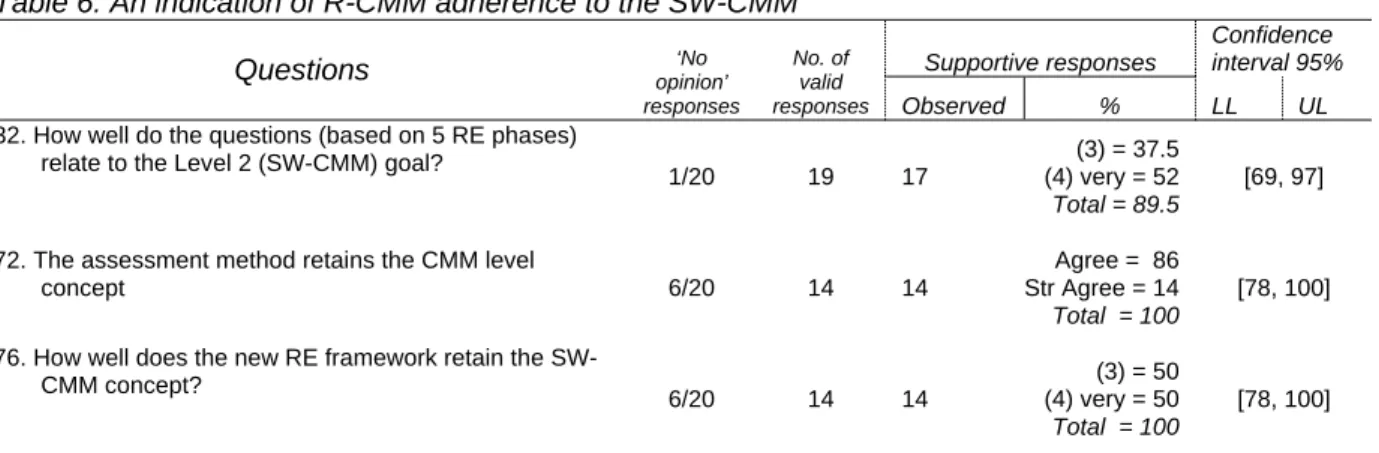
Questions in Table 6 test how well the R-CMM adheres to the SW-CMM structure and concept. Table 6: An indication of R-CMM adherence to the SW-CMM
Supportive responses
Confidence interval 95% Questions opinion’ ‘No
responses
No. of valid
responses Observed % LL UL
32. How well do the questions (based on 5 RE phases) relate to the Level 2 (SW-CMM) goal?
1/20 19 17
(3) = 37.5 (4) very = 52 Total = 89.5
[69, 97]
72. The assessment method retains the CMM level
concept 6/20 14 14
Agree = 86 Str Agree = 14 Total = 100
[78, 100] 76. How well does the new RE framework retain the
SW-CMM concept? 6/20 14 14 (3) = 50 (4) very = 50 Total = 100 [78, 100]
Looking at Table 6, all participants who gave a valid response were in agreement that the assessment method (Item 72) and the framework (Item 76) retain the CMM concept. The four participants who had no previous knowledge of the CMM all gave a ‘no opinion’ response when asked about the framework retaining the SW-CMM concept. This result gives us confidence in how the experts are answering the CMM related questions.
Support is slightly reduced as experts examine how well the 5 phases of RE adhere to SW-CMM maturity goals (Item 32). However, all items used to test the CMM adherence criteria include 80% support within their confidence limits indicating that this area is not of immediate concern.
7.3.2: Success criteria two: Limited Scope
Questions in Table 7 test the scope of the R-CMM, i.e. whether the boundaries imposed on the model are clear and appropriate.
Table 7: Expert Opinion of R-CMM Scope
Supportive responses Confidence interval 95% Questions ‘No opinion’ responses No. of valid responses Observed % LL UL
19. How complete is the R-CMM framework? (asked at beginning of questionnaire when examining high level
model) 6/20 16 8
(3) = 29 Very = 29 Total = 58
[33, 79]
28. How appropriate is the level of detail in the R-CMM for
an initial guide to the RE process? 1 19 11
(3) = 47 Very = 11 Total support = 58
[36, 77] 29. How appropriate is it to include organisational
processes (e.g. requirements skills audit) and technical processes (e.g. techniques to trace requirements) in one model?
0 20 18
(3) = 25 Very = 65 Total support = 90
[70, 97]
34. How well do questions [the 5 RE phases] cover all the key activities involved in the requirement stage of software development? 2 18 17 (3) = 61 Very = 33 Total support = 94 [74, 99]
41. Each process relates to RE activities 0 20 11
Agree = 40 Strgly agree = 15 Total = 55
[34, 74]
77. How complete is the R-CMM framework? (asked at
end of questionnaire) 5/20 15 10
(3) = 53 Very = 13 Total = 66
Table 7a: Expert opinion on the level of information provided Too
few Correct Number Too many
No
opinion Total (1) (2) (3) (4) (5)
27. We have divided the RE phase of software engineering into 20 key processes. Is this a good number or would the model benefit from a more comprehensive list?
0 2 6 10 1 1 20
51. There is sufficient detail in document 3 to guide the user
towards recognizing baseline RE processes 2 4 6 2 1 5 20
Table 7a presents raw scores only because the uneven number of response categories cannot be dichotomised.
Testing the scope of the model falls into three categories: process inclusion, number of processes and level of detail.
• Process inclusion:
When we compare Items 29 and 41 there appears to be a conflict in what are considered key processes in a RE process improvement model. There is a strong agreement that it is appropriate to include both technical and organisational processes in the model, yet there is a critical response to these same processes being categorised as RE activities. Use of 4McNemar's test [46] shows that there are
differences in how individuals respond to the two questions (X2 = 5.143, df = 1, p = 0.016 for
two-tailed exact test with N = 20 cases) [60]. However when we asked the experts to rate the twenty ‘candidate’ processes we include in the model as being key to baseline processes, all processes were considered as essential by some of the experts. The process that all experts agreed to be essential was to “Establish/maintain process to reach agreement with customer on requirements for project” (see Table A in Appendix C for the list of candidate processes and a breakdown of how the experts rated each process). Processes that were rated as ‘not needed’ represented a small percentage (7.75). • Number of processes:
Experience shows that organisations do their best when they focus on a manageable number of process areas [61]. Item 27 (in Table 7a) indicates that the 20 key baseline processes are slightly too many for this level of abstraction. Alternatively, this response may suggest that the model contains some sub-processes that are not considered key to the RE process as indicated by Item 41. The number of processes included in process improvement models varies. For example, the SW-CMM has only 5 key process areas at level 2, whereas the Requirements Good Practice Guide [22] includes 36 guidelines in their Level 2 equivalent model.
• Level of detail
The model would possibly be enhanced by giving each process a greater depth of detail as shown through the critical results in Items 28 and 51. We asked how complete the R-CMM high level model was (Item 19) and how complete the model was having looked at all the model components (Item 77). By complete, we mean that the model includes all essential properties of the RE process at the given level of abstraction. This is a very complex area, and difficult to answer, as we have only given the experts a partial model. However, given that the experts were made aware of what the model is trying to capture, the slight increase in valid response level and support for the model at the end of the questionnaire (Item 77) suggests that looking at all the model components supplied led to a more rounded understanding of the R-CMM.
Testing this criterion gives us an impression of whether the model was complete and cohesive enough in presentation to allow for experts to gain a feel for where the boundaries lie. We now need to consider whether the model breadth (as in the number of processes included) is detracting from the model depth (as in the level of detail). It could be that reducing the number of processes in the model makes the model more manageable. However, further investigation is required to gain a better idea of what constitutes a manageable number of RE processes.
7.3.3 Success criteria three: Consistency
Questions in Table 8 test whether the R-CMM features are consistent and complete at this level of development.
Table8: An indication of R-CMM consistency
Supportive responses Confidence interval 95% Questions ‘No opinion’ responses No. of valid responses Observed % LL UL
21. How consistent is the level of detail given within the
R-CMM 2/20 18 17
(3) = 50 Very = 44 Total = 94
[74, 99]
40. All Key processes are represented (at a baseline
level) 3/20 17 10
Agree = 53 Strgly agree = 6 Total = 59
[36, 78]
42. Each process relates to Maturity Level 2 (baseline
processes) 7/20 13 10
Agree = 62 Strgly agree = 15
Total = 77 [54, 100]
45. All processes listed are at a similar level of abstraction 3/20 17 7
Agree = 35 Strgly agree = 6 Total 41
[22, 64]
55. The guidelines are at the same level of granularity. 2/20 18 16
Agree = 78 Strgly agree = 11 Total = 89
[67, 97]
Consistency between maturity levels appears strong with 94% support (Item 21). At this initial stage of development the maturity structure is modelled at a very high level, however the positive response suggests the R-CMM has a firm foundation. Support for whether all key processes are represented at a baseline level is critical as the CI does not include the threshold value of 80% (Item 40). It is possible that the processes are not considered consistent with the baseline ‘repeatable’ process concept (Item 42). We need to ensure that we are guided by the SW-CMM concept and not the best practice literature that can introduce processes into the R-CMM that are not based on a logical order of
implementation. Another area in need of improvement is the lack of consistency of process abstraction with the CI for Item 45 falling well below our 80% threshold. Yet, the more detailed guidelines that focus on individual key processes appear to have a more consistent level of granularity with the CI including our 80% threshold (Item 55).
7.3.4 Success criteria four: Understandable
We view this criterion as the semantics of the model and use the questions in Table 9 to test whether the R-CMM is understandable and has meaning.
Table 9: An indication of R-CMM meaning and comprehension
Supportive responses Confidence interval 95% Questions ‘No opinion’ responses No. of valid responses Observed % LL UL
24. How easy is it to understand the path from initial goal,
to question, to final process? 0/20 20 17
(3) = 50 very = 35 Total = 85
[64, 95]
37. Each individual process is easy to understand (i.e.
they are clearly defined and unambiguous) 3/20 17 5
Agree = 24 Strgly agree = 6
Total = 30
[13, 53]
47. Viewing RE in 5 stages helps practitioners to
understand when to implement each process 1/20 19 13
agree = 58 Strgly agree = 11 Total = 69
[46, 85]
80. How clear is this presentation of the model 0/20 20 17
(3) = 65 very = 20 Total = 85
We asked how clear the presentation of the model is three times in the questionnaire (representing 3 different model abstractions). The full list of responses are given in [54]. All responses are similar to Item 80 and give approximately 85% support. However with a fairly wide confidence interval, we do not infer that this support is necessarily representative of the population. Navigating from goals through to recommended processes receives a similar 85% support from our panel. This implies the goal focus is retained throughout the model description. The balance of agreement is that viewing RE in five stages helps practitioners to understand when to implement each process with 69% support. Yet, one expert stated that he would rather see RE in ‘phases’ rather than ‘stages’ as implied in the question.
The response to understanding individual processes is critical with just 30% of experts believing that definitions of processes in the R-CMM are clearly defined and unambiguous. This is the most critical response given throughout the model validation. It could be that by using the language of the SW-CMM to define our processes we are compounding the weakness of the SW-SW-CMM rather than strengthening it. For example the process “Follow a written organisational policy for managing the system requirements allocated to the software project” is taken directly from the SW-CMM. One expert recognises the need for clarity stating “The biggest problem with any of these models is
interpretation, if the model can be interpreted differently it will be”. This clearly is a major problem as we want the improvement effort to be repeatable, allowing organisations to view the state of their processes over time and between projects. If they interpret the processes differently, it is likely they are measuring different things.
Another expert thought the model didn’t differentiate between ‘software requirements’ and ‘system requirements’ activities explaining that ‘requirements engineering’ is understood to involve
implementation activities whereas requirements capture is a system level activity. The R-CMM involves both software and systems activities yet taking a process view of RE it does not separate these activities specifically.
We are aware of the lack of examples and poor definitions in the SW-CMM (for examples, see [23]; [26]). The RE process is very complex and to express each key sub-process required to create a strong RE process in terms that are universally understood is problematic. This is because there is currently no one industry standard or dictionary definition of terms that we can refer to. This confusion is highlighted in [61]. Taking processes from several sources has created a hybrid model that without further reference appears ambiguous and vague. We are not surprised by the critical response to this Item; we anticipated it by providing further definitions on a web page for our experts to refer to. However as these definitions were not included with the documentation sent to the experts we cannot be certain that those who gave a critical response to the clarity of the model did look at the supporting web-page provided.
What we can be confident about from these results however is that the definitions as they appear currently in the model are insufficient. They must either be more detailed at the level presented, or accompanied by definitions that are easy to access and understand. If the experts cannot understand the meaning behind the processes listed, it is also debatable whether they can accurately answer the questions related to their appropriateness as a key baseline process. Clearly more tests are required in this area prior to proceeding with model development.
7.3.5 Success criteria five: Ease of use
Questions in Table 10 test expert perception of the level of ease with which the model might be implemented, i.e. how closely the model matches the practice it represents.
Table 10: An indication of R-CMM ease of use Supportive responses Confidence interval 95% Questions ‘No opinion’ responses No. of valid responses Observed % LL UL
22. How much previous knowledge of the SW-CMM do you think you need to be able to interpret this framework? 2/20 18 13 Fair know = 56 No know = 17 Total = 72 [49, 88]
47. Viewing RE in these 5 phases is a reflection of how
RE are implemented in practice 0/20 20 13
Agree = 55 Strgly Agree = 10 Total = 65
[43, 82]
56. Dividing the RE process into smaller activities in this
way will help practitioners to implement the process 1/20 19 18
Agree = 58 Strgly Agree = 37 Total = 95
[75, 99]
76. How useful is it to take a process view of requirements to improve the overall requirements process? 5 2/20 18 18 (3) = 33 Very = 67 Total = 100 [82, 100]
84. How realistic is it to ask companies to look at their RE
process in this structured way? 2/20 18 10
(3) = 33 Very = 22 Total = 55
[34, 75]
The strong agreement with the statements given in Items 76 and 56 suggests that the R-CMM will help process implementation by decomposing the high level descriptive process into a lower level
prescription. However the perennial problem of bridging the gap between theory and practice is shown by 45% of our experts believing that it is unrealistic to expect companies to view their requirements in this structured way (Item 84). One expert added, “.. some agile development methods suggest much less RE activities (different RE activities for that matter); to what extent can your framework cope with a completely different view of RE…?”
The sentiment that the model structure is unhelpful is compounded by only 35% of experts believing that the lifecycle view of RE (i.e. requirements management, elicitation, negotiation, specification, verification) does not reflect software and system requirement practices (Item 47). Although this question does include our 80% acceptance threshold in the CI, we were surprised that it did not receive stronger support.
It appears that a user does not require an in depth knowledge of the SW-CMM to interpret the R-CMM (Item 22). Although this question has the built in assumption that our model is similar to the SW-CMM, the responses do indicate a high level of model independence that is likely to lead to a fast take-up of model concepts requiring minimal model-related training. Our raw scores [54] show that no participant believes that the user needs to have an expert knowledge of the SW-CMM to interpret the R-CMM, rendering the general response as fairly positive.
7.3.6 Success criteria six: Tailorable
The questions in Table 11 test how easily the R-CMM might be tailored to suit individual company needs.
5There is an inherent weakness in the phrasing of question 76 when taken out of the questionnaire context. It should state,
Table 11: An indication of R-CMM Tailorability Supportive responses Confidence interval 95% Questions ‘No opinion’ responses No. of valid responses Observed % LL UL
25. How easy would it be to adapt this framework (e.g. {add|remove|amend} goals, questions and processes)? 1/20 19 18 (3) = 47.5 Very = 47.5 Total = 95 [75, 99] 66. How easy would it be to adapt this assessment
method to meet individual company needs (e.g. measure different processes/use different measurement criteria)? 0/20 20 16 (3) = 70 Very = 10 Total = 80 [58, 92]
44. It would be possible to extend each process to create specific guidelines and prescriptions, i.e. convert process guidelines into practice.
1/20 19 18
Agree = 58 Strgly Agree = 37 Total = 95
[75, 99]
59. The activities [given in the guideline model component] are general and likely to apply to most companies. 1/20 19 15 Agree = 63.5 Str Agree = 16.5 Total = 80 [57, 91]
The responses of 80% or above in this category are all fairly positive, especially when considering adapting elements in the substantive framework (Figure 3) referred to in Item 25. Looking back to how the experts responded to the SW-CMM question on adaptability (Table 4, Item 15), the panel were not so enthusiastic with a lower support of 78% as opposed to the 95% support given to the R-CMM. The R-CMM potential for being adapted appears to be a relative strength of the design. However, we appreciate that the model presented is at a fairly high level and the more detailed and more prescriptive the R-CMM becomes the less likely it is that the model can be tailored to suit all development environments.
7.3.7 Success criteria seven: Verifiable
We asked whether the questionnaire allowed the experts to give a fair assessment of the model. Results in Table 12 indicate how verifiable our model is in the context of the methodology presented in this paper, i.e. the questions and response categories provided.
Table 12: A measure of R-CMM verifiability
Not enough Correct Too much No opinion Total 1 2 3 4 5 85. Has the level of detail provided by this questionnaire
allowed you to give a fair assessment of the strengths
and weaknesses of the new R-CMM? 1 3 13 2 1 0 20
The questionnaire allowed 65% (13/20) of our experts to give a fair opinion of the model. Looking at the bi-polar responses in Table 12, having too much detail may have prevented the experts from giving a fair opinion. However, as there were only six missing responses in the entire questionnaire set of 1,700 responses (85 questions x 20 participants), we see little sign of questionnaire fatigue. Three out of four experts who felt that there was not enough detail to allow them to give a fair assessment added further comments. However, we cannot state that these extra comments necessarily allowed them to explain precisely how they felt about the model. One expert suggested a different type of evaluation altogether, feeling that “applying the model to a project would allow me to evaluate the ‘strengths and weaknesses’ of the model more effectively”. This would certainly be a more exact test, and is
considered for future work when we have addressed some of the more pressing issues raised in this study. It is therefore possible that the assessment component of the R-CMM will provide a more direct method of verifying the model’s strengths and weaknesses.
7.4 Overall impression
Table 13 gives the experts’ overall impression of the R-CMM. Table 13: Overall impression
Supportive responses Confidence interval 95% Questions ‘No opinion’ responses No. of valid responses Observed % LL UL
60. It would be helpful to provide guidelines for all
processes listed in the Level 2 model 1/20 19 18
(3) = 37 Very = 58 Total = 96
[75, 99]
82. How useful would it be to the software industry to
continue to develop this model? 2/20 18 13
Agree = 56 Strgly Agree = 17 Total = 73
[49, 88]
83. How useful would it be to the research community to
continue to develop this model? 4/20 16 12
Agree = 50 Strgly Agree = 25 Total = 75
[51, 90]
Item 60 relates to the decomposition of one process into several more prescriptive sub-processes that guide users towards how to implement best practices. There is near consensus that it would be helpful to develop more detailed guidelines (Item 60) based on our given processes. The experts’ support for the R-CMM guidelines appear more pronounced when we compare it to their attitude towards the SW-CMM guidelines given in Table 4, Item 15. The critical response in Item 15 (CI does not include 80% in its range) suggests a weakness in the SW-CMM, whereas the 96% support for the R-CMM
guideline in Item 60 suggests a strength.
When considering further development of the model, the panel of experts were not so unanimous. However, 74% (averaging responses to Items 82 and 83 in Table 13) were in favour of further
development of the model and both CI’s contain our 80% threshold within their limits suggesting that on balance further development would be useful to both the software industry and to the research community.
Reflecting a general polarisation of attitudes, we received both encouraging and discouraging comments about the model. A positive view is given by one expert who stated: “Hooking the RE process to the CMM is a great idea – many organizations have “bought into” the CMM process improvement initiatives and many organisations realise that poor RE is a source of myriad
development problems. The association of these two ideas can go a long way toward improved RE processes”.
A counter example is given by an expert who finds the connection with the CMM unhelpful:
“The problem with these checklist approaches is that they take no account of good process design… Tickbox approaches offer an easy solution that ensures CMM compliance rather than good RE.” 8: Summary of results
8.1 Using Experts to validate the R-CMM
The process of using an expert panel to validate the R-CMM has proved very helpful in highlighting some of the model’s potential strengths and weaknesses. We believe that the involvement of such a high calibre panel adds weight and rigor to our results. The high response rate and the many additional comments and contributions made, suggest that the experts took the task seriously. The range of responses elicited from this relatively small group formed a good basis for us to gauge how the R-CMM might be viewed in practice. It is a particularly worthwhile exercise as it provides an objective view on work that, otherwise, could easily become unrelated to the needs of the community. We therefore welcome the mix of opinions offered by this diverse group of experts.
Despite some polarisation of views there was relatively strong agreement that the RE process is in need of further support. Table 14 shows the experts’ perception of the R-CMM.
Table 14: Summary of expert perceptions of the R-CMM
characteristics limitations
Adheres to SW-CMM The model is incomplete (intentional at this level
of abstraction)
Is consistent at a high level of detail Ambiguous process definitions
Has a clear framework (although some experts would rather a more flexible structure)
Unrealistic structured view (phases don’t necessarily relate to RE practices)
Takes a process view of RE Inconsistent level of abstraction (a problem of
combining multiple sources)
Decomposes activities Missing key baseline processes
Is adaptable/tailorable Incorrect key baseline processes
The assessment component has potential to measure RE process strengths and weaknesses
The assessment component is not self-explanatory
8.2 Linking theory to practice
The R-CMM reflects the general needs of the software industry by attempting to provide a solution to recognised problems in the RE process. Taking a process view of RE and creating a model that can be tailored to a company’s individual needs also supports software industry. However, the 5 phase lifecycle structure of the R-CMM does not necessarily reflect how RE processes are implemented in practice. It is therefore questionable how helpful this dimension of the model is.
Testing whether the R-CMM represented RE key practices proved contentious as many experts believed that the R-CMM had either the wrong processes or missing processes. When asking experts to rank the twenty candidate processes, however, each process was considered essential by at least one expert. We did not intend the R-CMM to include all RE processes, just those that are key to a majority of software development companies. Should an organisation want to adapt to the methods of newer improvement models such as the CMMI, then this CMM approach will help their migration [61]. The mixture of responses from the experts suggests that it would be impossible to create a RE model that includes key RE processes relevant to all types of software development companies and individual practitioners. The best we can expect is that there is a generic quality to the R-CMM that allows software companies to identify and adapt RE processes to meet their own needs.
Although the experts did not believe each of the 20 candidate baseline processes to be strictly
‘requirements’ related, they did support combining organisational processes and technical processes in one model. We believe that this suggests that the R-CMM gives practitioners the freedom to
concentrate on understanding and improving their technical RE processes. The technical processes are at a descriptive level that allows for creative adaptation.
As the panel of experts included many software practitioners, their input into answering how the R-CMM reflects the needs of the software industry is particularly relevant. We therefore conclude that the R-CMM partially reflects the needs of the software community, and the survey has helped us to identify areas where the R-CMM can be improved to meet this objective.