Development of a new improved model of the ITIL V3 framework for
the information system of Telecom operator
A. Tanovic*, F. Orucevic**, I. Androulidakis***
*Department for IT development of multimedia services, BH Telecom d.d. Sarajevo
Obala Kulina Bana 8, Sarajevo 71000, Bosnia and Herzegovina
** Department of Computer Science and Informatics University of Sarajevo, Faculty of Electrical
Engineering
Zmaja od Bosne bb, Sarajevo 71000, Bosnia and Herzegovina
***Jožef Stefan International Postgraduate School
Jamova 39, Ljubljana SI-1000, Slovenia
[email protected], [email protected], [email protected]
Abstract: - Management of IT services is of particular importance for every organisation. ITIL is the most populary framework for the management of IT services. Previous researches showed that are needed some improvements of this framework. This paper describes improved model for ITIL V3 framework which is a result of integration of this framework with CobiT framework. Measurements are done in the information system in one Telecom operator in Bosnia and Herzegovina. Measurements showed that the improved model for ITIL V3 framework is better in its performances than the old model. This paper has a scientific value because it introduces one new model for ITIL V3 framework.
Key-Words: ITIL, CobiT, Provisioning system, Third-party services Management, Performance and Capacity Management, Continuous Service Management, Systems Security Management, Costs Management.
1 Introduction
Information Technology Infrastructure Library (ITIL) is the most popular framework for the management of IT services [3], [4], [5]. In version ITIL 2011, it has 3 new processes which are respectivelly added into these phases: Strategy Management for IT Services (Service Strategy) [1], Business Relationship Management (Service Strategy) [1] and Design Coordination (Service Design) [2]. Also, some old processes are improved: Financial Management for IT Services (Service Strategy) [1], Demand Management (Service Strategy) [1], Service Level Management (Service Design) [2], Service Asset and Configuration Management (Service Transition) [3], Change Evaluation (Service Transition) [3], Problem Management (Service Operation) [4] and 7-Step Improvement Process (Continual Service Improvement) [5]. This is a model which is signed as the old ITIL model in the rest of the paper. Control Objectives for Information and related Technology (CobiT) is the most popular framework for the management of IT Governance [8]. CobiT 5.0 has these 4 phases in which are placed 34 processes: plan and organise, acquire and implement, deliver and support and monitor and evaluate [7]. Some last researches showed that
CobiT is very similar to ITIL in some phases or processes [6], [10]. The aim of this framework is to produce information which has to satisfy business objectives and governance objectives. Some other researches for CobiT include: [11], [12], [13], [14] and [16]. These researches produced quantified models of CobiT for corporate IT governance. These models are implemented in many organizations and this kind of IT governance is in the strong relationship with SOA governance. Internal audits showed the high level of CobiT implementation in these organizations.
Section II of the paper describes Provisioning system of the Telecom operator which is the test environment for the research in this paper. Section III of the paper describes measurements for Incident Management and Problem Management after the releasing of Provisioning system into production by using the old model for ITIL V3 framework. Section IV of the paper describes comparative analysis between 2 implementation phases from ITIL V3 and CobiT and based on this we proposed a new model for ITIL V3 which has now some processes which are added from CobiT framework. Section V of the paper describes measurements for Incident Management and Problem Management by using a new model for ITIL V3 framework. Section VI,
which is the conclusion of the paper, describes differences between results from sections III and V. Previous research of authors is the paper is [15] in which is described one model for ITIL V3 framework which is a result of integration with PRINCE 2 framework. It is added only one new process into a new model for ITIL V3 framework. The second previous research of authors is the paper [17] in which is described the development of a new model for IMS system. This paper only describes schedule of processes for IMS system. In paper [18] is described the difference between ITIL 2007 and ITIL 2011. The last researches which connect ITIL and CobiT are: [6] and [10] and these researches are based on theoretical hypothesis [8], [9]. The result of these researches is a new model for ITIL framework which has positive elements of the implementation from CobiT framework and ISO/IEC 27000 standard. This new model of ITIL framework is performed in some processes of ITIL Service Strategy and ITIL Service Design phase especially in Information Security Management process. Other researchers that have examined issues regarding the social acceptance of IT governance in the broader sense [19], [20].
2 Test environment
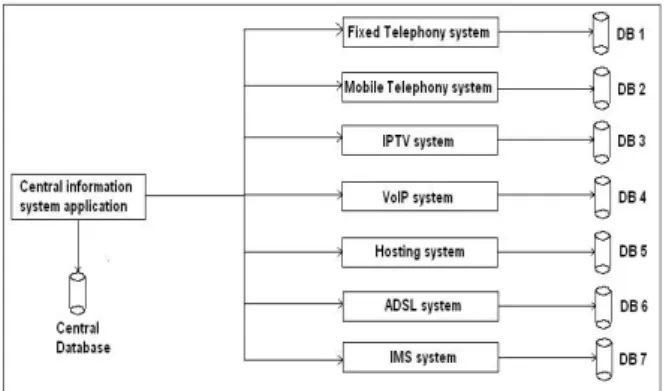
We have chosen a Provisioning system of Telecom operator as the test environment [17]. Provisioning system is the central information system system of the Telecom operator which connects central information system application and other 7 different systems: fixed telephony system, mobile telephony system, IPTV system, VoIP system, Hosting system, ADSL system and IMS system [17]. Figure 1. presents this system. This system is developed by using ASAP tool. This is a tool which significantly reduces time-consuming work and it connects different software systems into one new system.
Figure 1. Provisioning system
Table I shows all functions of the Provisioning system. These functions are responsible for actions with users, packages, devices and numbers. All actions are described in table I. Central information system application is connected with other seven systems by using web services.
TABLE I: FUNCTIONS OF THE PROVISIONING SYSTEM
Provisioning system function name
Meaning of the Provisioning function
addDevice
This function is responsible for the adding a new type of terminal equipment into central information system like: modems, set top boxes, voip adapters, mobile telephones and fixed telephones. deleteDevice
This function is responsible for deleting one specific device from the central database.
addSubscriberAndItsDefault User
This function adds new mobile telephony users, fixed telephony users, IPTV users, VoIP users, Hosting users, ADSL users and IMS users into central information system.
deleteSubscriber
This function deletes one subscriber from one Telecom operator’s service.
setSubscriber
This function is responsible for changing some parameters for subscribers like: package, phone number, mobile number, address, region etc.
connectDeviceForSubsciber
This function connects some type of terminal equipment to the specific user.
disconnectDeviceFromSubs criber
This function disconnects some terminal equipment from one specific user.
addSubscriberChPackage
This function is responsible for the assigning one specific channel package to one user. addSubscriberMobilePhone
This function assigns a mobile phone number to one specific user.
addSubscriberFixedPhone
This function assigns a fixed phone number to one specific user.
addSubscriberVoIPPhone
This function assigns a VoIP phone number to one specific user.
deleteSubscriberChPackage
This function deletes one specific channel package from one user.
deleteSubscriberMobilePhon e
This function deletes a mobile phone number from one specific user.
deleteSubscriberFixedPhone
This function deletes a fixed phone number from one specific user.
deleteSubscriberVoIPPhone
This function deletes a VoIP phone number from one specific user.
addPackage
This function adds one new package to one of the following systems: fixed telephony, mobile telephony, IPTV, VoIP, ADSL, Hosting and IMS system.
deletePackage
package from one of the following systems: fixed telephony, mobile telephony, IPTV, VoIP, ADSL, Hosting and IMS system.
3 Measurement of performances of the
implemented Provisioning system by
using the old model for ITIL V3
framework
For the testing of implemented Provisioning system, we have chosen 2 processes from Service Operation phase: Incident Management and Problem Management [10]. The reason for this is because these 2 processes are the best processes for the measurement of the implementation of some system. This is because every software or hardware incident or problem has to be solved in these 2 processes by using ITIL framework. Key Performance Indicators (KPIs) are chosen for the implementation of these 2 processes [10]. Table II describes the realisation of the key performance indicators for the old model of ITIL V3 framework. Test conditions between the measurement of the old model and a new model were the same. All these results are collected from all departments from Telecom operator.
TABLE II: REALISATION OF THE KEY PERFORMANCE INDICATORS FOR THE OLD MODEL OF ITIL V3 FRAMEWORK
Key Performance Indicator
The implementation of the key performance indicator
The percentage of the implementation of each key performance indicator Number of repeated incidents
Measurements showed that the number of repeated incidents is 14. These problems are mostly connected to setSubsciber function which is responsible for changing packages for each subscriber or for changing personal data for each subscriber.
40%
Remotely resolved incidents
Measurements showed that the number of remotely resolved incidents is only 2. These are incidents resolved remotely by the Service Desk. Employees from Service Desk solved only problems with changing address of subscriber and with changing one mobile package with another mobile package.
15%
Number of escalations
Measurements showed that the number of escalations for incidents that are not resolved in the agreed resolution time is only 1. This escalation started when 50 subscribers cancelled IPTV service because the Provisioning system could not change them from one IPTV
100%
package to another IPTV package.
Number of incidents
Measurements showed that the total number of incidents which are registered by Service Desk is 60. Some of incidents showed that some additional functions of the system are not good implemented. For example, the function of assigning HD channels to IPTV subscribers is not working.
20%
Incident resolution time
Incident resolution time, or average time for resolving an incident, is 2 days (48 hours). Based on SLA, this time should be only 12 hours.
25%
First time resolution time
Measurements showed that the number of incidents that are resolved at the Service Desk during the first call is only 12, and the total number of incidents is 60. Employees from Service Desk known only to solve some simply incidents like assigning terminal equipment to users, for example modems for ADSL service.
20%
Resolution with SLA
Rate of incidents resolved during solution times agreed in SLA is 60 %. The result for fixed telephony system is 90%, for mobile telephony system result is 40%, for IPTV service 60%, for VoIP service result is 70%, for ADSL service result is 60%, for Hosting system result is 40% and for IMS system result is 80%. The average result is 60%.
60%
Incident resolution effort
Measurements showed that the average work effort for resolving incidents is 3 days (72 hours). This time is 3 times less than the allowed time which is 24 hours. The reason for this is that Service Desk couldn’t solve some big issues like the problem for changing from one to another mobile package and because of this system developers have to solve this problems and they are working on the 3rd level of
support.
30%
Number of problems
Measurements showed that the total number of problems is 2. The 1st one is the problem with
setSubscriber function and the 2nd one is the problem with
assigning some additional TV channels to IPTV subscriber.
50%
Problem resolution time
This parameter is average time for resolving a problem. Both problems that are described are not solved by using the old model for ITIL V3 framework so the final result of the implementation of this KPI is 0%.
0%
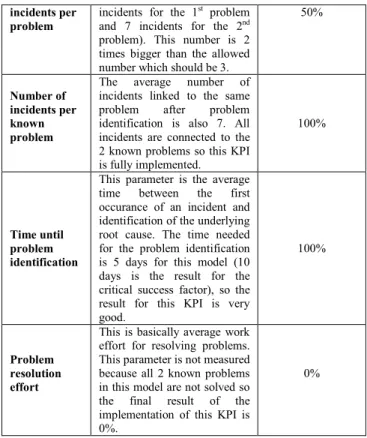
Number of
Measurements showed that the average number of incidents per each problem is 7 (7
incidents per problem
incidents for the 1st problem
and 7 incidents for the 2nd
problem). This number is 2 times bigger than the allowed number which should be 3.
50%
Number of incidents per known problem
The average number of incidents linked to the same problem after problem identification is also 7. All incidents are connected to the 2 known problems so this KPI is fully implemented.
100%
Time until problem identification
This parameter is the average time between the first occurance of an incident and identification of the underlying root cause. The time needed for the problem identification is 5 days for this model (10 days is the result for the critical success factor), so the result for this KPI is very good.
100%
Problem resolution effort
This is basically average work effort for resolving problems. This parameter is not measured because all 2 known problems in this model are not solved so the final result of the implementation of this KPI is 0%.
0%
The result of the successfully implemented KPIs for the old model for ITIL V3 is 44%, and for unsuccessfully implemented KPIs result is 56%. Figure 2. represents the ratio between successful and unsuccessful implemented key performance indicators for the old model for ITIL V3. It is evident that are results bad, and as we can see for many KPIs result is 0%.
Figure 2. The result of the implementation of KPIs for the old model for ITIL V3
4 The proposal for a new model for
ITIL V3 framework
Figure 3. presents processes for the old model for ITIL V3 framework (it is included only implementation phase which is Service Transition). This model has 6 processes which are presented on this figure.
Figure 3. Processes for the old model for ITIL V3 framework
The result of the implementation of KPIs for the old model for ITIL V3 is 44%, and it is pretty bad result. So based on this we did a comparative analysis between ITIL V3 and CobiT implementation phases. The implementation phase for ITIL V3 is Service Transition and for CobiT is Deliver and Support [6]. We used some previous researches for this [9] and [10]. The comparative analysis shows that CobiT processes between DS7 and DS13 are presented in an old model for ITIL V3 framework: DS7 – Educate and train users (ITIL V3: Knowledge Management), DS8 – Manage Service Desk and Incidents (ITIL V3: Incident Management), DS9 – Manage the configuration (ITIL V3: Release and Deployment Management), DS10 – Manage problems (ITIL V3: Problem Management), DS11 – Manage data (ITIL V3: Service Asset and Configuration Management), DS12 – Manage the physical environment (ITIL V3: Access Management) and DS13 – Manage operations (ITIL V3: Event Management) [9], [10]. The comparative analysis shows that CobiT processes between DS1 and DS6 are not presented in an old model for ITIL V3 framework [8]: DS1 – Define and manage service levels (we proposed a new process which is called Service Levels Management), DS2 – Manage third-party services (we proposed a new process which is called Third-party services Management), DS3 – Manage performance and capacity (we proposed a new process which is called Performance and Capacity Management), DS4 – Ensure continuous service (we proposed a new process which is called Continuous Service Management), DS5 – Ensure systems security (we proposed a new process which is called Systems Security Management) and DS6 – Identity and allocate costs (we proposed a new process which is called Costs Management).
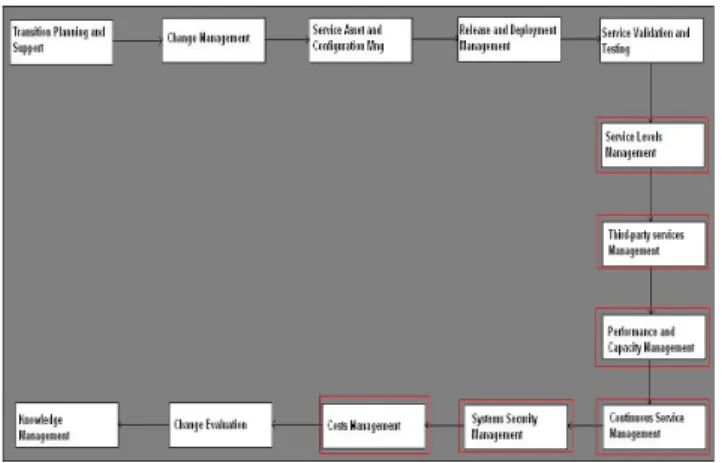
Figure 4. presents processes for the new model for ITIL V3 framework. This model has now 13
processes (7 old processes and 6 new processes) which are presented on figure 4.
Figure 4. Processes for the new model for ITIL V3 framework
The new model for ITIL V3 framework has these 6 new processes: Service Levels Management, Third-party services Management, Performance and Capacity Management, Continuous Service Management, Systems Security Management and Costs Management. Bellow is a brief description of activities for each new process.
Service Levels Management is responsible for these activities [7]:
• Create a framework for defining IT services.
• Build an IT Service Catalogue.
• Define service level agreements (SLAs) for critical IT services.
• Define operating level agreements (OLAs) for meeting SLAs.
• Monitor and report end-to-end service level performance.
• Review SLAs and underpinning contracts.
• Review and update IT service catalogue.
• Create service improvement plan.
Third-party services Management process is responsible for these activities [7]:
• Identify and categorise third-party service relationships.
• Define and document supplier management processes.
• Establish supplier evaluation and selection policies and procedures.
• Identify, assess and mitigate supplier risks.
• Monitor supplier service delivery.
• Evaluate long-term goals of the service relationship for all stakeholders.
Performance and Capacity Management is responsible for these process activities [7]:
• Establish a planning process for the review of performance and capacity of IT resources.
• Review current IT resources performance and capacity.
• Conduct IT resources performance and capacity forecasting.
• Conduct gap analysis to identify IT resources mismatch.
• Conduct contingency planning for potential IT resources unavailability.
• Continuously monitor and report the availability, performance and capacity of IT resources.
Continuous Service Management process is responsible for these activities [7]:
• Develop IT continuity framework.
• Conduct business impact analysis and risk assessment.
• Develop and maintain IT continuity plans.
• Identify and categorise IT resources based on recovery objectives.
• Define and execute change control procedures to ensure IT continuity plan is current.
• Regularly test IT continuity plan.
• Develop follow-on action plan from test results.
• Plan and conduct IT continuity training.
• Plan IT services recovery and resumption.
• Plan and implement backup storage and protection.
• Establish procedures for conducting post-resumption reviews.
Systems Security Management is responsible for the following process activities [7]:
• Define and maintain an IT security plan.
• Define, establish and operate an identity management process.
• Monitor potential and actual security incidents.
• Periodically review and validate user access rights and privileges.
• Establish and maintain procedures for maintaining and safeguarding cryptographic keys.
• Implement and maintain technical and procedural controls to protect information flows across networks.
• Conduct regular vulnerability assessments. Costs Management process is responsible for these activities [7]:
• Map IT infrastructure to services provided/business processes supported.
• Identify all IT costs and map them to IT services on a unit cost basis.
• Establish and maintain an IT accounting and cost control process.
• Establish and maintain charging policies and procedures.
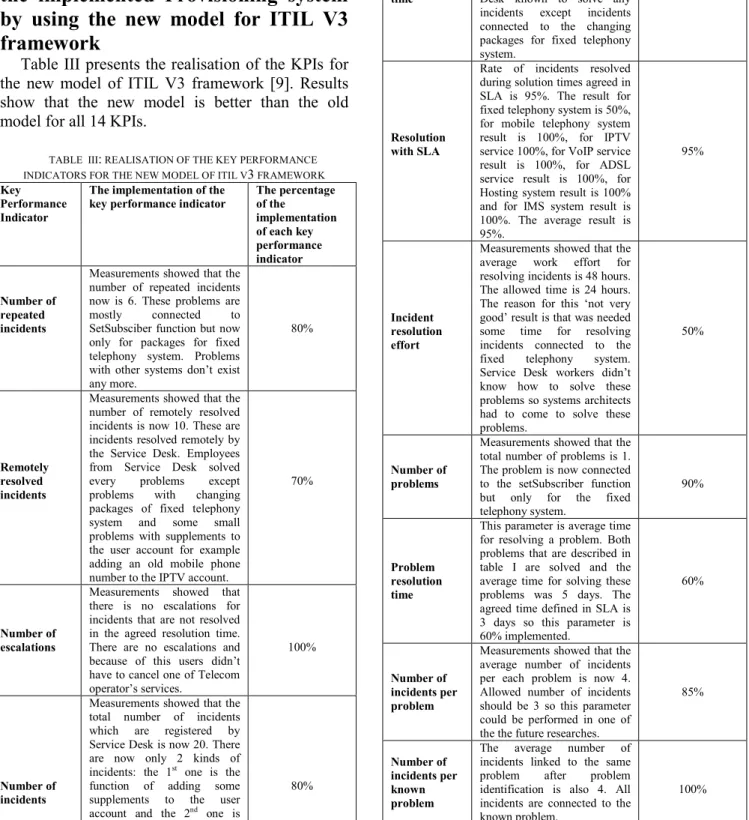
5 Measurement of performances of
the implemented Provisioning system
by using the new model for ITIL V3
framework
Table III presents the realisation of the KPIs for the new model of ITIL V3 framework [9]. Results show that the new model is better than the old model for all 14 KPIs.
TABLE III: REALISATION OF THE KEY PERFORMANCE INDICATORS FOR THE NEW MODEL OF ITIL V3 FRAMEWORK
Key Performance Indicator
The implementation of the key performance indicator
The percentage of the implementation of each key performance indicator Number of repeated incidents
Measurements showed that the number of repeated incidents now is 6. These problems are
mostly connected to
SetSubsciber function but now only for packages for fixed telephony system. Problems with other systems don’t exist any more.
80%
Remotely resolved incidents
Measurements showed that the number of remotely resolved incidents is now 10. These are incidents resolved remotely by the Service Desk. Employees from Service Desk solved every problems except problems with changing packages of fixed telephony system and some small problems with supplements to the user account for example adding an old mobile phone number to the IPTV account.
70%
Number of escalations
Measurements showed that there is no escalations for incidents that are not resolved in the agreed resolution time. There are no escalations and because of this users didn’t have to cancel one of Telecom operator’s services.
100%
Number of incidents
Measurements showed that the total number of incidents which are registered by Service Desk is now 20. There are now only 2 kinds of incidents: the 1st one is the
function of adding some supplements to the user account and the 2nd one is
80%
function of showing a phone number on the fixed telephony device which is one function that is connected only to the fixed telephony system.
Incident resolution time
The average time for resolving an incident is now 16 hours so this result is better for 32 hours than the old result.
80%
First time resolution time
Measurements showed that the number of incidents that are resolved at the Service Desk during the first call is 50, and the total number of incidents is 60. Employees from Service Desk known to solve any incidents except incidents connected to the changing packages for fixed telephony system.
85%
Resolution with SLA
Rate of incidents resolved during solution times agreed in SLA is 95%. The result for fixed telephony system is 50%, for mobile telephony system result is 100%, for IPTV service 100%, for VoIP service result is 100%, for ADSL service result is 100%, for Hosting system result is 100% and for IMS system result is 100%. The average result is 95%.
95%
Incident resolution effort
Measurements showed that the average work effort for resolving incidents is 48 hours. The allowed time is 24 hours. The reason for this ‘not very good’ result is that was needed some time for resolving incidents connected to the fixed telephony system. Service Desk workers didn’t know how to solve these problems so systems architects had to come to solve these problems.
50%
Number of problems
Measurements showed that the total number of problems is 1. The problem is now connected to the setSubscriber function but only for the fixed telephony system.
90%
Problem resolution time
This parameter is average time for resolving a problem. Both problems that are described in table I are solved and the average time for solving these problems was 5 days. The agreed time defined in SLA is 3 days so this parameter is 60% implemented.
60%
Number of incidents per problem
Measurements showed that the average number of incidents per each problem is now 4. Allowed number of incidents should be 3 so this parameter could be performed in one of the the future researches.
85%
Number of incidents per known problem
The average number of incidents linked to the same problem after problem identification is also 4. All incidents are connected to the known problem.
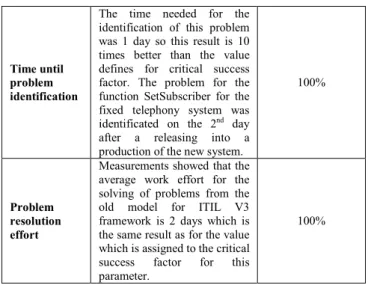
Time until problem identification
The time needed for the identification of this problem was 1 day so this result is 10 times better than the value defines for critical success factor. The problem for the function SetSubscriber for the fixed telephony system was identificated on the 2nd day
after a releasing into a production of the new system.
100%
Problem resolution effort
Measurements showed that the average work effort for the solving of problems from the old model for ITIL V3 framework is 2 days which is the same result as for the value which is assigned to the critical success factor for this parameter.
100%
The result of the successfully implemented KPIs for the new model for ITIL V3 is 84%, and for unsuccessfully implemented KPIs result is 16%. Figure 5. represents the ratio between successful and unsuccessful implemented key performance indicators for the new model for ITIL V3.
Figure 5. The result of the implementation of KPIs for the new model for ITIL V3
6 Conclusion
Measurements showed that the percentage of the successfully implemented key performance indicators for the old model for ITIL V3 is only 44%. For the new model, the result is pretty better and it is 84%. So new model is 91% better than the old model. The new model is equal or better in all 14 key performance indicators for Incident and Problem Management than the old model. Incident Management and Problem Management are 2 processes from Service Operation phase in which is shown the quality of the implemented Service Transition phase.
The new model for ITIL V3 framework has 6 new processes which are all added into Service Transition phase. These new processes are [7], [9]: Service Levels Management which is responsible for the building of IT Service Catalogue, Third-party services Management which is responsible for the defining and documenting supplier management
processes, Performance and Capacity Management which manages with establishing a planning process for the review of performance and capacity of IT resources, Continuous Service Management process which develops IT continuity framework, Systems Security Management which defines and maintains an IT security plan and Costs Management which is responsible for identifing all IT costs and mapping them to IT services on a unit cost basis.
Future research of authors in this area is connected to the testing of this developed model in some other services, for example in IPTV or VoIP service of Telecom operator [17], [18]. The aim is to improve even this model and to prove that this model is better in every environment than the old model. This is very important because in this way a new model replace the old model for ITIL V3 framework. The new model will reduce a time for introducing a new service, the number of incidents and problems on service desk and a time for a development of a new service.
References:
[1] S. Taylor, M. Iqbal, and M. Nieves, “ITIL Version 3 Service Strategy”, The Office of Government Commerce, July 2011.
[2] S. Taylor, V. Lloyd, and C. Rudd, “ITIL Version 3 Service Design”, The Office of Government Commerce, July 2011.
[3] S. Taylor, S. Lacy, and I. Macfarlane, “ITIL Version 3 Service Transition”, The Office of Government Commerce, July 2011.
[4] S. Taylor, D. Cannon, and D. Wheeldon, “ITIL Version 3 Service Operation”, The Office of Government Commerce, July 2011.
[5] S. Taylor, G.Case, and G.Spalding, “ITIL Version 3 Continual Service Improvement”, The Office of Government Commerce, July 2011.
[6] ITGI and OGC, “Aligning CobiT 4.1, ITIL V3 and ISO/IEC for Business Benefit – A Management Briefing From ITGI and OGC”, August 2008.
[7] IT Governance Institute, “CobiT Control Practices: Guidance to Achieve Control Objectives for Successful IT Governance”, 2nd Edition, May 2007.
[8] IT Governance Institute, “CobiT User Guide for Service Managers”, 1st Edition, April 2009. [9] ITGI, “CobiT Mapping: Mapping of ITIL V3
With CobiT 4.1”, August 2008.
[10] S. Sahibudin, M. Sharifi, and M. Ayat, “Combining ITIL, CobiT and ISO/IEC 27002 in Order to Design a Comprehensive IT
Framework in Organizations”, 2nd Asia International Conference on Modeling & Simulation (AICMS 2008), pp. 749-753, May 2008.
[11] D. Radovanovic, T. Radojevic, D. Lucic, and M. Sarac, “IT audit in accordance with CobiT standard”, 33rd International Convention MIPRO, pp. 1137-1141, May 2010.
[12] G. Ridley, J. Young, and P. Caroll, “CobiT and its utilization: a framework from the literature”, 37th Annual Hawaii International Conference on System Sciences, pp. 1-8, January 2004.
[13] S.J. Hussain and M.S. Siddiqui, “Quantified Model of CobiT for Corporate IT Governance”, 1st International Conference on Information and Communication Technologies (ICICT 2005), pp. 158-163, August 2005.
[14] F. Hojaji and M.R.A. Shirazi, “A Comprenhensive SOA Governance Framework Based on CobiT”, 6th World Congress on Services (SERVICES-1), pp. 407-414, July 2010.
[15] A. Tanovic and F. Orucevic, “Integration of PRINCE 2 model into ITIL V3 model”, 19th Telecommunications Forum (TELFOR 2011), pp. 102 – 105, November 2011.
[16] T. Goldschmidth, A. Dittrich, and M. Malek, “Quantifying Criticality of Dependability-Related IT Organization Processes in CobiT”, 15th IEEE Pacific Rim International Symposium on Dependable Computing, pp. 336-341, November 2009. [17] A. Tanovic, I. Androulidakis, and F.
Orucevic, “Design and implementation of the IP Multimedia Subsystem by using ITIL V3 recommendations”, 6th WSEAS International Conference on Communications and Information Technology (CIT’12), pp. 39-48, March 2012.
[18] A. Tanovic and F. Orucevic, “Advantages of the new ITIL V3 model in the implementation of the IMS system”, 6th WSEAS International Conference on Communications and Information Technology (CIT’12), pp. 183-191, March 2012.
[19]
Nikolaos Bardis, Nikolaos Doukas,
Oleksandr P. Markovskyi, Fast subscriber
identification based on the zero knowledge
principle
for
multimedia
content
distribution,
International
Journal
of
Multimedia
Intelligence and Security,
Volume 1, Number 4, pp. 363 – 377, 2010.
[20]