TRADE INTERCEPTOR CHARTING 4.0
Welcome to Trade Interceptor Charting 4.0 help file
This help file has been created to give you a fast understanding of what's possible with Trade Interceptor Charting 4.0 in order to get you started right away. It offers a full screen shot-based explanation of each application’s functionality.
In the "how to" section below, you will learn how to use the most important features and trading techniques provided by Trade Interceptor Charting 4.0 through simple step by step instructions.
Before you go through this printable version of Trade Interceptor Charting 4.0 Help, we recommend you take a look at our Quick Tour, which is available from the Online Help version. You’ll very quickly understand how the application works by clicking on the image areas of both the
Charting Window and the Quotes & Analysis Window.
To get you to speed quickly, we highly recommend that you take a look at ourself-running video demos, where the most important functionalities and techniques are explained in a few steps. You can have access to the demos while using the application, either by selecting "Help>Contents" from the applicationMenu Bar
CONTENT
APPLICATION OVERVIEW 6
The Chart Window 6
The Quotes & Analytics Window 7
Context Menus 8
Workspace Management 12
Online Help Menu 12
QUOTES 13
Streaming Quotes Table 13
Add Securities 14
Find Securities 14
Remove securities 15
Save Quote List 16
Table Management 16
Sort Tables 16
Resize tables 17
Create charts from quote table 17
Advanced quotes 18
CHARTS 19
Chart Windows 19
Caption Bar 20
Menu Bar 20
Fixed Toolbar 21
Charts area / Charts panes 22
Charts icons bar 23
Info Bar 24
Icons definitions 25
Create / Open a chart 26
Default Chart 27
Chart axis 28
Set Software to Local Time 28
Securities Window 30
New chart window 31
Copy chart 31
Compare Charts 32
Cascade and Tile windows 33
Lock/Unlock chart windows 33
Save / Retrieve templates 34
Rename / Delete templates 35
Change chart type 35
Change timescale 36
Chart and data visualization options 37
Cross cursor 38
Vertical cursor 38
Show last price barrier line 39
Zoom In / Zoom Out 39
Selective zoom 40
Timescale Up/Timescale Down 40
Scroll chart back and forth 40
Resize / Enlarge chart panes 42
Resize / Enlarge / Close indicators panes 42 Data Values Window / Table 43
Print Chart 44 GRAPHIC TOOLS, STUDIES AND OBJECTS 44
Change tools, studies and objects properties 44
Graphic tools 44
Trend Lines 45
Extend Trend Lines 46
Support and Resistance Lines 46
Vertical Time Lines 47
Lines and support 48
Regression Lines and Channels 50
Remove Graphic Objects 52
Graphic Studies 52
Fibonacci Retracements 53
Fibonacci Arcs 54
Fibonacci Target 56
Fibonacci Time Zones 57
Gann Fans 58
Gann Angle Lines 59
Gann Lines 60
Graphic Objects 61 Add Buy and Sell Signals 61
Add Text 62 Add Rectangle 63
Add Ellipse 64
Add Triangle 65 Add Arrow Line 66
Add Segment 67
INDICATORS 69
Indicators List 69
Add Indicators 70
Remove indicators 72 Change indicators properties 73
Copy indicators 73
TRENDRISK ANALYTICS 75 TrendRisk Analytics 75
TrendRisk Indicator 75
TrendRisk Scanner 77
TrendRisk Analysis 80
Add Alarm 82 TRADING 83 Paper Account Management 83
Paper Trading Control Panel Trading Intelligence 84
CUSTOMIZE APPLICATION 91
General User Preferences 92
Color Preferences 94
Chart Grid Options 96
Screen style 96
Personalize Fixed Icons Bar 98
Messages 98
EXIT APPLICATION 98
APPLICATION OVERVIEW
Trade Interceptor Charting 4.0 is a new generation trading support station which gives you access to multi-feed market data.
It gives you the opportunity to use exclusive analytics such as TrendRisk, used by professional traders, which are supplied with full training support. It also offers full integration to excel for endless real-time and history calculation.
Furthermore, you don't need to burden your PC with another heavy download: the application resides on the server side. This also gives you the fastest connection to market data, together with the possibility to have access to the program from any PC in the world, through an internet connection. All your preferred templates and preferences will always be there, as they are saved on the server side.
Once you've logged in, you will have access to all the application's functionalities through 2 main windows:
- Chart Window
- Quotes & Analytics window
The Chart Window:
To see how to open a new chart window and to learn about the difference between the Master Chart Window and New Chart Windows, see section Chart Windows.
The Quotes & Analytics Window:
The Quotes & Analytics Window gives you access to a series of tabs and table management functionalities. It allows you to save and manage your personal configurations, access the real-time quotes list functionalities, TrendRisk scanner functionalities, TrendRisk Analysis and the interactive pointer-driven Chart Values table, Alarms module, Advanced Quotes, Data Values table.
- The Streaming Quotes table allows you to monitor real-time streaming market prices
- TrendRisk Scanner table allows you to know TrendRisk Risk/Reward ratio associated to each currency, and the expected target expected for each timescale. The system also gives you recommended Stop levels
- TrendRisk tab provides you with ongoing market commentaries and forecasts for each currency - The interactive Data Values table helps you read chart data values through the help of your mouse pointer.
- Alarms tab allows you to enter various and sophisticated alarms for each currency you want
- Advanced Quotes allows to visualize (and detach) quote windows with more data in them as well as monitoring the quotes of any the brokers provided
- Messages tab provides administrators' messages sent to all or specific users regarding issues related to the application or user accounts
Context
Menus
:
A series of context menus are available from a simple right-click of the mouse, which give you fast and easy access to specific functionalities.
Six pop-up context menus can be used through a right-click of the mouse, to allow fast access to specific functionalities:
1. Chart Window Context Menu: This context menu allows you to: - copy and delete graphic instruments
- read and modify the properties of graphic instruments - delete indicators
- read and modify the properties of indicators - rescale the chart to fit in window
- scroll to the last bar - restore default scale - close indicator chart area
- load pre-defined or custom color templates - change timescale
- add alarm - show/hide quotes
2. Icons Bar Context Menu: This menu allows you to:
- enable/disable specific icon groups, personalizing to fit your needs, - show or hide the Menu Bar
Example of Icons Bar Context Menu:
3. Quotes & Analytics Template Tabs
- This menu allows you to rename or delete a previously saved template
4. Streaming Quote Table Context Menu: This context menu allows you to:
- open a new security chart in a new chart window - place new order
- remove selected security or all securities from the Streaming Quote Table - customize columns of the table
- customize color and font properties of Streaming Quote Table
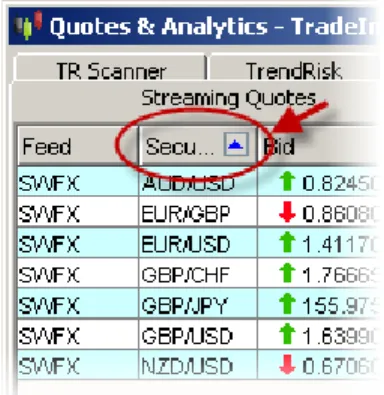
Example of Streaming Quote Table Right-Click Context Menu:
5. TrendRisk Scanner Table Context Menu This context menu allows you to:
- open a security chart in a new window - add a security to the Streaming Quote Table
Example of TrendRisk Scanner Table Right-Click Context Menu:
6. Data Values Table Context Menu:
This Menu allows attaching or detaching the Data Values Table from the Quotes & Analytics Window. For further details see section Data Values Window / Table
Workspace management / Preferences
The application gives you the possibility to: - work with several chart windows simultaneously - resize and enlarge both charting and indicators areas - copy charts
- copy indicators
- cascade, tile windows horizontally and vertically in your screen - attach/detach the Data Values window to better read chart data - save and retrieve your templates
- personalize the chart panes colors - set general user preferences
- resize the icons bar and hide the Menu Bar
Online Help Menu
By selecting "Help/Content" from the Menu Bar, you'll have access to a comprehensive Help Menu including Online Video Demos of the application's main functionalities, a printable PDF version of the Help File, and the complete Online Web Help.
You can open this menu at any time while using the application to run a demo or check the help file, and therefore be up to speed in a minimum learning time.
QUOTES
Streaming Quotes Table
The Streaming Quotes Table is the first table displayed in the Quotes & Analytics window.
It allows you to watch real-time currency price updates from various data feed providers and create new charts automatically through a simple double-click of the mouse.
Example of Steaming Quotes Table:
From this table you can:
- select and upload new currencies to your quote table: see section Add Securities - remove currencies from the quote table: see section Remove Securities
- create a new chart: see section Create Chart from Quote Table - open, rename or delete your configurations
- sort data in the quote table: see section Sort Table - resize the table's columns: see section Resize Table Two right-click context menus are available on this table: - one from the configurations tab
- another one from the main quotes table
Add Securities
To add securities to the Streaming Quotes Table, open the Securities Window, by clicking on the "Select Securities" button, located in the bottom right corner of the table.
In the Securities Window, first select one of the data feed providers from the providers list, in the upper left part of the window. The window will automatically display the security list offered by the provider in the main table.
To find a security, you can either:
- use the scroll bar, located on the right side of the security table, in order to visualize all the table's rows
- or use the Speed Search option provided in the panel which is located above the currency table. See section Find Securities.
To add one security to the Streaming Quotes Table, select it from the main security table in the Securities Window and press the "OK" button in the bottom right part of the window, or simply double-click on it.
You can add more than one security at a time to the Streaming Quotes Table, in two ways: - you can either add a full list of securities by using the "Shift" key of your keyboard:
After you've selected the first instrument you want to add to the table, keep the "Shift" key pressed and select the last security you want to add to the list. To add the selected currency list to the Quote table, press "OK"
- or you can add a specific selection of securities by using the "Ctrl" key of you keyboard:
Keep the "Ctrl" key pressed and select the currencies you want to add to the Quote table. When you finish selecting the securities, press "OK"
To close the window and ignore the operation, press "Cancel".
To remove securities from the Streaming Quotes Table, see section: Remove Securities
Find Securities
With the Speed Search functionality provided in the upper part of the Securities Window, you can quickly find a security by typing either its Code or its Full Name in the appropriate box. The security will automatically be displayed in the Security table, under the Speed Search Panel.
Remove Securities
You can remove securities from the Streaming Quotes Table, in two ways:
1. Select a security in the table and press the "Remove" button located under the table 2. Select a security in the table, open the right-click menu and select "remove"
To remove more than one security at a time from the quote table, you can either:
- Select a list of securities by using the "Shift" key of your keyboard (after you've selected the first instrument you want to remove, keep the "Shift" key pressed and select the last security you want remove from the list).
Then open the right-click menu and select "remove", or press the "Remove" button.
- Make a specific selection of securities by using the "Ctrl" key of you keyboard (keep the "Ctrl" key pressed and select the currencies you want to remove from the Quote table).
Then open the right-click menu and select "remove", or press the "Remove" button.
Save Quote Lists
Quote lists can be saved as part of personal templates.
Table Management
A series of functionalities allow to easily manage the tables of the Quotes & Analytics window. 1. Each table of the Quotes & Analytics window can be:
- sorted by columns - resized
2. A series of buttons located in the bottom right corner of the tables allow to: - add new securities to the quote grid
- remove one or more securities from the quote grid - refresh TrendRisk scanner
3. Two vertical and horizontal scroll bars allow visualizing table rows and columns easily. 4. A series of pop-up context menus allow you to:
- rename or delete template by right clicking on a template tab
- remove one or more securities from the quote grid, by right clicking on a currency row
- open a new currency chart from the quote grid or from TrendRisk Scanner, by right clicking on a currency row
- add a currency of the TrendRisk Scanner table directly to the quote grid, by right clicking on a currency row of TR Scanner table.
Sort Table
You can sort the Streaming Quotes Table by selecting one of the columns headers and double-clicking on it.
Repeating the operation will reverse the table's sort order.
Resize Table
You can resize each column of the Streaming Quotes Table by placing your mouse on the line separating 2 column headers and use the mouse double-arrow by keeping your mouse pressed while resizing the column.
See also section Sort Table
Create Charts from Quote Table
To create a currency chart directly from the quote table, first open the Quotes & Analytics Window, and make sure you've already inserted securities to the Streaming Quotes Table (see section Add Securities).
There are 2 ways to create a chart from the Quote Table:
1. If you double click on a currency row, a new chart will be created in your Master Chart
Window (This window is directly linked to the Quotes & Analytics window and can be recognized from the icon ).
2. If you right-click on a currency and select the "+ Chart" function, a new chart will be created in a New Chart Window. You will have the possibility to decide whether to lock or unlock this new window from the
Advanced Quotes
This window allows you to have better visual perception of quotes.
Advanced Quotes window allows you to add or remove quote widows of different currencies even from any feed that we provide (FXCM, Dukaskopy, MBT, FXSOL, Riflexo).
Thus you may compare for example quotes and spreads of a currency provided by different brokers. You can also detach (and re-attach) any of these quote windows from Advanced Quotes window in order to place it somewhere over the main chart
See also: Streaming Quotes Table Data Values Window/Table
CHARTS
Chart Windows
Chart windows are composed of: - a caption bar
- a menu bar - a fixed toolbar - main charts area - a chart icons bar
For a description of each icon's function click here.
It's important to distinguish between the "Master Chart Window" and "New Chart Windows":
The Master Chart Window (or Main Chart Window) is the first which appears after you've logged in. You can recognize it from the icon shown at the bottom right of the window, located on the Chart Icons Bar.
This icon tells you that this window is locked to the Quotes & Analytics window, and cannot be unlocked. It means that any request made from the Quotes & Analytics window will automatically be displayed on the Master Chart Window.
Example scenarios:
- When you double click on a currency from the Streaming Quotes Table of the Quotes & Analysis Window, the Master Chart Window will instantly display the new requested currency chart.
- When you double click on a currency from TrendRisk Scanner Table, the Master Chart Window will instantly display the new requested currency chart and timescale.
New Chart Windows, can be recognized from the or icons at the bottom right of the window and can be locked or unlocked from the Quotes & Analytics Window. When you ask for a new chart window, it will be locked by default.
A locked chart window will react as follows:
- any request from the Streaming Quotes Table will subsequently affect the new locked chart window. - requests from TrendRisk Scanner Table will only affect the Master Chart Window.
On the contrary, an unlocked chart window will be totally independent from the Quotes & Analytics window, which means that it won't be affected by double clicks from either the Streaming Quotes Table, nor TrendRisk Scanner Table.
An unlocked chart window can be managed independently by using the icon and the timescales drop-down list to request a new currency chart, or change timescale.
To know how to open New Chart Windows, see section: New Chart Window
To see how to lock or unlock New Chart Windows, see section: Lock/Unlock chart window
Caption Bar
The caption bar is the first bar you see at the top of the Chart Window and shows you: - the application's version number
- the data provider
- the chart currency and timescale
- on the right end, Microsoft's icons to iconize, enlarge and close the window. The caption bar shows you which of the windows your working with is active.
Menu Bar
The Menu Bar is located at the top of the application's Chart Window, just under the caption bar. This bar is displayed by default and can be hidden by selecting "View>Main Menu Visible". For a more detailed description, see section Icons Bar Context Menu.
If you click or place your mouse over one of the Menu Bar's titles, a drop-down menu will appear automatically.
These menus give you access to the following functionalities: - set security
- open & save templates - print chart
- select chart window color scheme - enable X/Y chart panning
- rescale to fit in window - scroll to last bar
- select chart style(bar, candlesticks, line chart etc.) - use graphic lines and tools
- use graphic studies - use graphic objects - zoom in/out
- hide / show extended trend lines - set general user preferences - set color preferences
- set grid options
- set default Fibonacci preferences - open new chart window
- copy chart
- cascade, tile windows horizontally or vertically - open Help link
- exit application
For a detailed description of these functionalities, click on the above links.
Fixed Toolbar
The fixed toolbar is located under the Menu Bar of the Chart Window.
With the fixed toolbar you can: - select a new chart currency - set new chart timescale - add/remove and use indicators
- add/remove and use graphic instruments - add/remove and use graphic objects - use cursors
- use selective zoom
For a detailed explanation of each icon's functionality, see also sectionIcons Definition. This toolbar is fully customizable:
- you can select which icon groups to display or hide. This action is possible through a simple right-click on the bar, which will open the context menu.
- you can also hide the Toolbar and the Menu Bar together by clicking on the small arrow below the Toolbar
Example: Toolbar context menu
For more details see sectionContext menu.
Charts Panes
Charts Panes include the currency chart and indicators areas of the Chart Window. They show: - The main chart (or currency) pane, with its title indicating currency pair, time period, price type and broker
When you open the application, you'll see a default currency chart , which can be personalized using the General Preferences Window.
- Indicators are displayed on separate panes, under the main currency chart.
To see how to add, remove or copy indicators, change indicators properties and create your own indicators, see the Indicators list and the appropriate links.
Real-Time price updates and indicators levels are indicated on the Y axis ; the time and date on the X axis
A series of chart management tools are displayed on the Chart Icons Bar, located under the charts panel, next to the scroll bar.
Example of a Charts Panel:
Chart Icons Bar
The Chart Icons Bar, is located at the bottom of the Chart Window, under the Chart Panes.
It shows a series of small icons, designed to help you easily manage charts. This menu gives you access to the following functionalities:
- Timescale UP/ Timescale Down- load one step higher or lower timeframe of the chart - Lock / Unlock chart window, see also section Chart Windows
- Zoom In and Zoom Out
- Open General Preferences window - Copy chart
For a detailed explanation of each icon's functionality, see also section Icons Description See also section Scroll Chart
Icons Definitions
Each of the icons described below is located either on the Fixed Toolbar, in the Menu Bar's tabs or on the Chart Icons Bar.
1. Icons of the Fixed Toolbar
Opens the Securities Window for the selection and upload of a currency pairs to the Chart Panes
Create and remove simulation accounts. Set the initial deposit sum for trading
The Paper Trading Control Panel shows opened, pending and booked orders, as well as the usual data related to orders- type, size, open price etc. and also equity balance, margin levels ans s.o.
Opens the "Add Indicator" window for indicators selection
Opens Perspective Chart in a pane at the bottom of the screen showing visualized part of the historical data and the whole historical data period
Makes candlesticks three dimensional, for different than usual 2D visualization.
Allows to use cross cursor, cursor line and zoom on the chart from the drop down menu of the icon
Allows drawing a trend line
Allows placing a support/resistance line
Allows placing a vertical line on the chart
Opens access to 5 different regression tools available regression line
raff regression channel standard error channel standard deviation channel regression channel
Opens access to Fibonacci tools fibonacci retracement
fibonacci target
fibonacci arcs fibonacci time zones
Opens access to Gann Tools
gann line
gann fan
angle lines
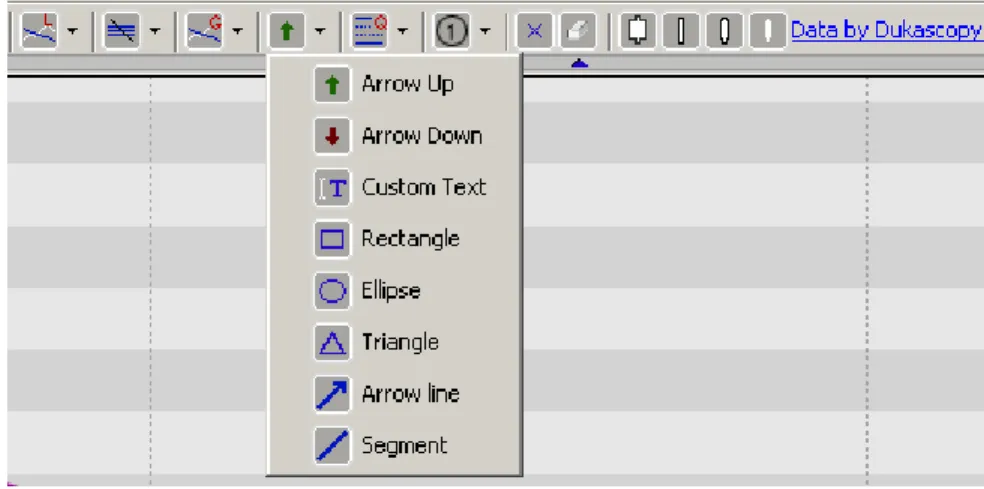
Draw different graphic objects like rectangle, ellipse, arrow, enter text etc. arrow up Allows to insert a Buying signal on the chart
arrow down Allows to insert a Selling signal on the chart
allows to insert text on the chart
rectangle Allows to draw a rectangle on a chart ellipse Allows to draw on Ellipse on a chart triangle Allows to draw a triangle on a chart
arrow line Allows to draw an Arrow pointing a place on the chart
segment Allows to draw segment lines in order to construct patterns for example
Draw different graphic tools- Channel Lines, Andrew's Pitchfork etc quadrant line
tirone levels
speed resistance lines speed resistance arcs andrew's pitchfork odds
cycle lines channel lines
percentage retracements
Place Eliot Wave labels
Remove all indicators from the whole currency pair window, both superior and inferior indicators
Remove all tools, i.e. Fibonacci tools, trend lines, support/ressistane annotations etc.
Create / Open a Chart
There are 4 possible ways to create a chart with Trade Interceptor Charting 3.3: - from the chart window, opening the Securities Window - see point1
- using the Streaming Quotes Window - see point 2 - by opening a New Chart Window - see point 3 - by copying an existing chart - see point 4
1. Using the Securities Window:
- Open the securities window, either by clicking on the icon located on the Fixed Toolbar of the Chart Window, or by selecting "File/Set Security" from the Menu Bar.
- First select one of the data feed providers from the providers list, in the upper left part of the window. The window automatically displays the items offered by the provider in the currency list.
You can find a security by either using the scroll bar, located on the right side of the currency list, in order to visualize all the table rows, or the Speed Search option which is located above the currency list. See section Find Securities with Speed Search.
- Select a security from the security list, - Select the Timescale in the left column,
- Select the history period from the second column, - finally press the "OK" button to create the chart.
- Press "Cancel" if you want to close the window without creating a new chart.
2. Using the Streaming Quotes Window:
See section: Create Charts from Quote Table
3. Opening a New Chart Window:
See section: New Chart Window
4. Copying an existing chart window:
Default Chart
When you open the application, the chart window displays a default currency chart, including: - the chart's title, which is shown at the top, including the currency, data provider, price type and timescale
- outlined candlesticks chart:
To change chart style to bar chart or line chart see section Change Chart Type
To remove the candles outlines and customize charts, see section General User Preferences - TrendRisk indicator: TrendRisk Bands, TrendRisk Stop Bands and Tip Center
click on the following links to see how to modify indicators properties, delete indicators or add new indicators
- White screen color scheme with solid color background:
to change chart skin or personalize colors, see section General User Preferences - Y axis showing only the last price value.
To personalize the Y axis, see General Preferences
For more information about the chart axis, read also section Chart Axis
Chart Axis
Chart data can be read using the X axis or horizontal coordinates, and the Y axis or vertical coordinates.
Prices and chart levels on the Y axis:
The Y axis shows pips-based price coordinates.
- Currency prices are updated in real-time and streamed to the vertical axis of the chart. The last price update is shown by default on red background.
It is possible to change the background color of the real-time price updates by clicking on the icon located on the chart icons bar and selecting "Color Preferences" from the General Preferences window. Then select "Real-Time Price Label" to select the new background color and click Apply and OK to complete the operation.
- Indicators levels are not displayed on the Y axis by default.
You can modify this in the General Preferences to have all indicators and oscillators' latest levels automatically displayed on the vertical axis. For this you need to open the Indicators option window, either by clicking on the icon located on the chart icons bar, or by selecting "Options/General Preferences" in the Menu Bar, then enable with "tick" the option " Show indicator price label on Y-axis" in Indicators
You can also add a pips-based grid shading to the chart and indicators areas. See how to personalize the grid and chart area in section General Preferences.
Time and Dates on the X axis
The X axis shows time and date based on the selected timescale unit.
You can also personalize the vertical timelines of the grid, from the General Preferences window. See section General Preferences.
See also section Software Time Zones.
Software Time Zones
To set the application on your local time zone, open the General Preferences window - either by selecting "Options/General Preferences" from the Menu Bar, or clicking on the icon located on the Chart Icons Bar - and select the appropriate time from the "Time Zone" frame.
Example:
If you press "Save as Default" before closing the General Preferences window, the application will automatically be set on your preferred time zone each time you use the application.
You can change the application's time zone for a single work session (ie. if you're traveling) in the same way, without saving the new time as default, but by simply selecting a time zone and closing the General Preferences window.
You can read the last price time in the Streaming Quotes table, which is automatically updated according to your local time zone.
Securities Window
This window allows you to select and upload currency prices on both the chart panels of the Chart Window, and the tables of the Quotes & Analytics window.
To open the securities window from the chart window, you can either select File/Set Security from the Menu Bar, or click on the icon , located on the Fixed Toolbar.
To open the securities window from the Streaming Quotes Table, click on the "Select securities" button located in the bottom right corner of the window.
Note that when you open this window from the Streaming Quote Table to create a quote list, the columns Timescale and Period are not active.
To see how to upload currency prices on a chart Panel, see Create/Open a chart
New Chart Window
By clicking on the icon - located in the bottom right corner of the Chart Window, under the Charts Panel - or by selecting "Window/New Window" from the Menu Bar, you can open a New Chart Window and start uploading a new currency, or change a currency timescale, etc. Each new chart window gives you access to all the charting functionalities.
New Chart Windows can be recognized from the icons or which are located in the bottom right corner of the window, on the Chart Icons Bar.
A New Chart Window can either be:
- "locked" meaning that it's linked to the Quotes and Analytics window, in which case, if you request a new currency from the Streaming Quotes Table, the new chart window will automatically be updated with the new currency,
- or "unlocked", meaning that it remains independent from the Quotes and Analytics window, so you'll be able to request a different security than the one displayed on the Master Chart Window.
To learn more about the difference between New Chart Windows and the Master Chart Window, see section Chart Windows.
To see how to lock or unlock a new chart window, see section Lock/Unlock chart window. You can open as many new chart windows as you want.
By using Microsoft Windows' icons in the top right corner of each new window, on the caption bar, you can resize, iconize or close the chart windows in order to easily manage your workspace, you can also cascade or tile windows vertically or horizontally on your screen. See section Cascade and Tile Windows.
See also section how to Save and retrieve your personal templates.
Copy Chart
Or you can do this from Chart Icons Bar
This will automatically open a new chart window with the same chart and indicators configuration. See also sections:
New chart window Chart Windows
Lock / Unlock chart window
Compare Charts
This function available on Trade Interceptor 4.0 allows you to compare two currency pairs on one single chart.
Its "Properties select compare security" window gives access to the settings.
The window has "Parameters" and "Style" sections where you can:
- select a security for comparison - set comparison options
Cascade and Tile Windows
You can automatically re-arrange windows in your screen by selecting one of the following visualization options, accessible from the menu "Windows" on the Menu Bar:
- Cascade - Tile 1 column - Tile 2 columns - Tile Vertically
You can subsequently save your template in order to retrieve your screen layout easily. See sections:
Save / Retrieve templates Rename / Delete templates
Before reading this section, make sure you've read the explanation about Chart Windows
You can unlock a new chart window, so that it remains independent from the Quotes & Analytics window, by clicking on the icon .
The chart window is unlocked when you see the icon .
If you decide to unlock a chart window, any change you'll request from the Quotes and Analytics Window will not affect this chart window. So, if you request a new currency chart from the Streaming Quotes Table, for example, the unlocked chart window won't be updated with the new currency. You'll also be able to request a different security directly from the New Chart Window independently, by clicking on the icon of New Chart Window's Fixed Toolbar.
You can lock a new chart window in order to link it again to the Quotes and Analytics Window by clicking on the icon .
The chart window is locked when you see the icon . When a chart window is locked, it means that any request from the Quotes & Analytics window will also affect this window.
By default new chart windows are locked, which means that if you request a new currency chart from the Streaming Quotes Table or from TrendRisk Scanner table, all the chart windows which are locked will be updated with the new currency.
Note that the Master Chart Window - which is the first appearing after you've logged in, and which you can recognize from the icon - cannot be unlocked.
Save / Retrieve Template
With Trade Interceptor Charting 4.0 you can save and retrieve as many template as you'd like.
1. To save a template
, you can either click on the icon , which is located in "File/Save template" from the Menu Bar.The system automatically loads configurations in a default file.
All you have to do is to give a name to your configuration and press the "Save" button.
A new tab will instantly appear at the bottom of the Quotes & Analytics window, allowing you to easily retrieve this template at any time while using the application.
2. To open a template:
There are 3 ways to retrieve a configuration. You can either:
1) click on one of the tabs at the bottom of the Quotes & Analytics window (See image above) 2) right-click on the chart and choose Open Template from the context menu
or 3) select "File/Open template" from the Menu Bar.
This will open the default directory from where you can select a template and press the "Open" button to open it.
You can use the right-click context menu to rename or delete template. See sections: Context Menu and Rename / Delete Configurations.
Rename / Delete templates
Template tabs are located at the bottom of the Quotes & Analytics Window.
To Rename
a previously saved template, right-click on the name of the template you would like to rename. This will open the pop-up context menu. Select "Rename". Give a new name to your template. Press "Save" to save the new template's name.To Delete
a previously saved template, right-click on the name of the configuration you'd like to delete. This will open the pop-up context menu. Select "Delete" to automatically remove and cancel this template from the templates tabs.See also sections: Context Menus
Save / Retrieve Configurations
Change Chart Type
To switch from one chart type (bar chart, candlesticks chart, line chart etc.), to another, you can click Menu Bar>View and you will be able to switch to:
bar chart
candlestick chart
line chart
candlevolume chart
point and figure chart
renko chart
kagi chart
Change Timescale
There are 3 ways to change the timescale of a chart:
1. right-click on the chart and change the time scale from the bottom of the context menu 2. select a timescale from the Timescale drop-down menu, located in the Fixed Toolbar Example:
3.You can also change timescale and history period through the Securities Window. For more details, see section Securities Window
Charts and Data Visualization
There are various ways to visualize chart data and read data values with Trade Interceptor Charting 4.0
- using the cross cursor - using the vertical cursor
- using the Zoom in / Zoom out functionalities - using the selective Zoom
- repositioning the chart to fit in window - resizing and enlarging charts panels - resizing and enlarging indicators panels
- using the interactive data values tablesimply moving your mouse over the chart - print the chart
Cross Cursor
The Cross Cursor is one of the ways to read chart data.
It can be activated or disabled through a single mouse click on the icon
Example of active Cross Cursor:
To use the cross cursor:
- first click on the icon, located on the Fixed Toolbar - click on a chart or indicator pane to activate the cursor
- two crossing lines are automatically displayed on the chart and the values (level and time) are shown on the x and y axis
- move the mouse over the chart area to read data values of chart and indicators.
Before using any other chart tool, you first need to disable the cross cursor, by simply clicking again on the icon
Vertical Cursor
The Vertical Cursor is one of the ways to read chart data.
This cursor can be activated or disabled through a single mouse click on the icon
click on the chart or indicator panel. A vertical line is displayed automatically together with a data info box, showing the data values of the selected chart level.
To read other chart values, click on another point of the chart and the new data will be displayed automatically.
The data values shown by the vertical cursor in the info box are: - the date and time of the selected level
- the open, high, low and close prices of the selected chart bar or candle stick, or alternatively, the closing price of selected line chart level
Users can choose to hide or show the info box displaying the cursor line values, from the General Preferences window, but default setting is hidden info box.
To open the General Preferences window, select Options/General Preferences from the Menu Bar, or click on the icon located on the Chart Icons Bar, in the bottom right corner of the Chart Window. See more details in section: General User Preferences
Before using any other chart tool, you first need to disable the vertical cursor functionality, by simply clicking again on the icon
Show last price barrier
You can draw a barrier line at the last price level by using the General Preferences window.
To open the General Preferences Window, select Options/General Preferences from the Menu Bar, or click on the icon located on the Chart Icons Bar, in the bottom right corner of the Chart Window. In the Chart Options, select the option: "Draw barrier line on last value" and the line will be displayed automatically.
If you want to have this line drawn by default on all your charts, click on the button "Save as default" and press "OK" to close the operation.
Zoom In / Zoom Out
There are 3 ways to change the chart's visualization scale:
- An easy way is to use the mouse wheel, and scroll in or out by simply activating the wheel. If you don't have a Wheel Mouse, you can either:
the Chart icons bar, and repeat the operation as many times as you'd like until you reach the right visualization scale
- Select "Options/Zoom In" or "Options/Zoom Out" from the Menu Bar and repeat the operation as many times as you'd like until you reach the right visualization scale
You can also zoom into a specific part of a chart, by using the selective zoom (see section: Selective Zoom)
Or you can enlarge you chart or indicator panels by double-clicking on the chart or on the indicator (see sections: Enlarge Chartand Enlarge Indicator)
Selective Zoom
Using the selective zoom is one of the ways to visualize chart data. Other methods are explained in section : Charts and Data Visualization
To zoom into a specific chart area, click on the icon , displayed on the Fixed Toolbar above the charts Panel.
Use the left-click command of your mouse to select the first part of the area you'd like to zoom into. Release the command and move your mouse to the other end of the area you'd like to zoom into. The charts Panel will automatically show the selected area.
To confirm the area you'd like to zoom into, just press the left-click command of your mouse again.
Timescale UP/ Timescale Down
To quickly switch between different time frames of the chart window use the icons and in Chart Icons Bar
The icon allows switching to the next higher timescale with one step for every click
The same applies for the icon which allows to switch on the next lower timescale with every click
Scroll Chart Back and Forth
To scroll historical data of charts and indicators, you can
Use the scroll bar
which is displayed under the Charts Panel. To move back in time on the chart, move the scroll bar to the left. To move forward in time, move the scroll bar to the right.It is possible to hide the scroll bar thanks to the General Preferences window. See section General Preferences
This functionality also give you the possibility to scroll in the future, in order to give you the necessary empty space on the chart for projections of strategies and studies.
See also related sections:
- Scroll to the Last Bar to see how to quickly rescale the chart to the last bar in one click. - Move Chart
- Fit in Window
Scroll to last bar
To automatically rescale a currency chart to the last bar - meaning that the last bar of the chart shows the last price update - you can either:
- right-click in the chart area and select "Scroll to the Last Bar" from the Context Menu - or select "View/Scroll to the Last Bar" from the Menu Bar
See also related sections: - Move Chart
- Scroll Chart - Fit in Window
Move Chart
You can move currency charts vertically and horizontally
by clicking on the main chart pane and dragging them right, left,up or down. This functionality is called "chart panning" and is activated by default.After you've moved a chart, it is possible to automatically rescale it using the "Fit in Window" functionality.
To see how to use this feature, see section Fit in Window.
To move a chart horizontally only
, you should activate the function: "Y panning", which will automatically disable the X chart panning functionality.To activate this function, you can either click on the icon located in "View/Y Panning" from the Menu Bar.
To restore the default "X and Y chart panning" option
, allowing both vertical and horizontal panning, you can click on the icon again in "View/Enable Y Panning" from the Menu Bar.See also: section “Scroll to Last Bar” to see how to rescale the chart to the last bar automatically.
Fit In Window
To restore the default position of your main chart in the screen, you can either - Right-click on the main chart. This will open the right-click context menu. Then select "Fit in Window".
Example: How to restore the "Fit in Window" option through the right-click context menu:
See also related sections: - Move Chart
- Scroll Chart
- Scroll to the Last Bar
Resize/Enlarge Main Chart
- To enlarge a currency chart to full screen, double click on the chart pane. To go back to the previous chart lay-out, simply double click again on the chart.
- To resize the main chart area, place your mouse over the horizontal line between the main chart area and the indicators area. When the mouse pointer shows resizing arrows, keep your left-mouse button pressed and drag the bordering line to another place.
Other ways to read or visualize chart data are explained in section: Charts and Data Visualization See also section: Resize/Enlarge/Close Indicator
Resize/Enlarge/Close Indicator Area
- To enlarge
an indicator area to full screen, double click on it.To go back to the previous lay-out, double click again on the indicator's area.
- To resize
indicator areas, place your mouse over the horizontal line bordering the indicator area. When the mouse pointer shows resizing arrows, keep your left-mouse button pressed and drag the bordering line to another place.Data Values Window/Table
This interactive window / table gives you the possibility to read the exact value of each chart and indicator level, by simply moving your mouse pointer over a chart.
The Data Values Table appears by default as a detached window in front of the Chart Window when you open the application.
Example of detached Data Values window:
This window can easily be attached to or detached from the application's main window as follows: - by right-clicking on the Data Values table, and selecting "Detach" or "Attach"
- If you close the detached Data Values Window, it will automatically be attached to the Quotes & Analytics Window as the 4h Tab.
Other ways to read or visualize chart data are explained in section: Charts and Data Visualization
Print Chart
To print a chart window,
Select "File/Print" from the Menu Bar
Then select printing and printers options, to print the chart window.
GRAPHIC TOOLS, STUDIES AND OBJECTS
Graphic Tools
Graphic tools available in Trade Interceptor Charting 4.0 are: - trend lines
- support/ resistance lines - vertical time lines
- regression lines and channels - lines and supports
To find out more about these graphic tools, click on the appropriate link in the above list. Other graphic instruments such as studies and objects are explained in sections: - Graphic Studies
- Graphic Objects
To know how to change the properties of Graphic tools and instruments, see section Change Tools Properties
Change Tools Properties
There are 2 ways to change the properties of graphic tools such as lines, objects and studies.
1. Using the Context menu:
- place your mouse on the tool
- open the right-click context menu and select "Properties+ tool name" - modify properties from the properties box
- press "Save As Default" if you want to activate the new properties each time you will use this indicator
- or press "OK" to apply these properties only to the active chart window - press "Cancel" to ignore modifications and return to the default settings.
2. Using the Active objects window
Graphic tools can also be personalized through the "Show Active Objects" icon in the upper left corner of the chart pane.
There you can set the properties of your choice of interest from all the tools and indicators currently on the chart.
Trend Lines
This section explains how to: - draw one or more trend lines - extend a trend line
- move a trend line - remove a trend line - copy a trend line
- To see how to change trend lines properties, go to section: Change Tools Properties
1. How to draw one or more trend lines:
A. Using the icons of the Fixed Toolbar
- To draw a trend line on a chart or on an indicator, click once on the icon .
Click on the chart where you'd like the trend line to start and keep the left command of your mouse pressed while drawing the line.
Release your left mouse command when you finish drawing the trend line.
After the operation, the trend line function is not disabled. In order to disable it from drawing a second trend line unintentionally, right-click on the chart and the function will be instantly disabled or click on the icon .
B. Using the Menu Bar
Alternatively, you can select "Tools/Tools/Trend Line" from the Menu Bar and start drawing trend lines. To disable the function, select "Tools/Tools/Trend Line" again or right-click on the chart.
2. How to move a trend line:
You can move a trend line on the chart by disabling "freeze" from the trend line "Properties" accessible through right-click over the trend line.
You can set this setting (unfreeze) as default so that from now on other trend lines will be movable by default.
3. How to extend a trend line:
You can extend a trend line from one end or the other, by selecting one end (placing your mouse over it) and keep the left-command of your mouse pressed to extend the line to another chart level.
menu. This function is not enabled by default.
4. How to copy a trend line:
You can copy and paste a trend line by right-clicking on the trend line you'd like to copy and select: Copy Trend Line
A new similar trend line will automatically appear on the chart.
5. How to remove a trend line:
You can remove a trend line either by right-clicking on it and select: Delete Trend Line.
Or by using the "Clear all tools" icon (See section: Remove Graphic Instruments)
Extend Trend Lines
With Trade Interceptor Charting 4.0, Trend Lines are not extended in the future by default.
You can enable and disable this function again from "Properties Trend Line" when you righ-click on the trend line.
If you save as default after making this setting, all the trend lines from that moment on will be extended.
If you only click "OK" this setting will apply for that trend line only.
Support and Resistance Lines
This section explains how to:
- draw one or more support and resistance lines - move support and resistance lines
- copy support and resistance lines - delete support and resistance lines
- To see how to change horizontal lines properties, go to section: Change Tools Properties
1. How to draw support and resistance lines on a chart or on an indicator:
A. Using the icons of the Fixed Toolbar:
-To draw a horizontal line, click once on the icon . Then click on the chart where you'd like the support or resistance line to be drawn. A horizontal line will automatically be drawn on that point and the function will automatically be disabled after the operation. By default the function is enabled until it is turned off manually by clicking the icon.
B. Using the Menu Bar
Alternatively, you can select "Tools>Tools>Support/Resistance Line" from the Menu Bar and start drawing one or more lines.
To disable the function go through the same path "Tools>Tools>Support/Resistance Line" again. The function is automatically disabled when you select another graphic instrument.
2. How to move support and resistance lines:
You can move a support or resistance line on the chart by selecting it and dragging it to a different place. By default this is not possible until it is unfrozen from properties menu of the tool.
3. How to copy support and resistance lines:
You can copy and paste support and resistance lines by right-clicking on the line you'd like to copy and select: Copy Support/Resistance Line
A new similar line will automatically appear on the chart.
4. How to delete support and resistance lines:
You can remove support and resistance lines either by right-clicking on them and select: Delete Support/Resistance Line.
Or by using the "Clear all tools" icon (See section: Remove Graphic Instruments)
Vertical Time Lines
This section explains how to:
- draw one or more vertical time lines - move vertical time lines
- copy vertical time lines - delete vertical time lines
- To see how to change vertical lines properties, go to section: Change Tools Properties
1. How to draw vertical time lines on a chart or on an indicator:
A. Using the icons of the Fixed Toolbar:
-To draw a vertical line, click once on the icon . Then click on the chart where you'd like the line to be drawn. A vertical line will automatically be drawn on that point.
You can continue placing vertical lines on every mouse click until you disable the function by clicking its icon on the Fixed Toolbar.
- To draw several lines, double-click on the icon, draw the lines one after the other. When you're finished, click on the icon again to disable this function.
B. Using the Menu Bar
Alternatively, you can select "Tools/Tools/Vertical Line" from the Menu Bar and start drawing 1 ore more lines.
To disable the function, select "Tools/Tools/Vertical Line" again.
2. How to move vertical time lines:
You can move a vertical line on the chart by selecting it and dragging it to a different place. By default this is not possible until it is unfrozen from properties menu of the tool.
3. How to copy vertical time lines:
You can copy and paste vertical time lines by right-clicking on the line you'd like to copy and select: Copy Vertical Line.
A new similar line will automatically appear on the chart.
4. How to delete vertical time lines:
You can remove vertical time lines either by right-clicking on them and select: Delete Vertical Line. Or by using the "Clear all tools" icon (See section: Remove Graphic Instruments)
Lines and Supports
The tools representing "Lines and Supports" category on Fixed Toolbarare:
Quadrant Lines
Tirone Levels
Speed Resistance Lines
Speed Resistance Arhes
Andrew's Pitchfork
ODDS
Cycle Lines
Channel Lines
Percentage Retracement
This section explains how to: - draw tools
- move tools - extend tools
- copy tools - delete tools
- To see how to change "Lines and Supports" tools' properties, go to section: Change Tools Properties
1. How to draw tools from "Lines and Supports" category:
A. Using the icons of the Fixed Toolbar:
- To draw a "Lines and Supports" tool on a chart or on an indicator, click on the icon in Menu Bar and click on the desired tool's icon (see above) in order to start drawing it on the chart.
Select one of the lines' ends and keep the left command of your mouse pressed to extend to line to the level where you'd like the channel line to end up. Release your mouse command when you finish drawing the tool.
B. Using the Menu Bar
Alternatively, you can select "Tools/Lines and Supports" from the Menu Bar, choose specific tool and start drawing it
To disable the function, select "Tools/Lines and Supports" again.
The function is automatically disabled when you select another graphic instrument.
2. How to move tools from "Lines and Supports" category:
You can move one tool at a time by just selecting it with your mouse and dragging it to a different place( first make sure in "Properties+ tool name" that the tool is not frozen)
To move for example both channel lines (the tool with icon ) together, press the Shift key, select the lines and drag them to another place.
3. How to extend
tools of category "Lines and Supports:
You can extend some tools in the past and in the future by selecting one end of a line, keeping the left-command of your mouse pressed, and drag the lines to extend them.
You can automatically draw extended dashed lines of the tool in the future, by changing the tool's properties (this applies only to Quadrant- and Channel Lines and Tirone levels)
Tools properties can be changed:
- through a right-click of the mouse on the tool. Then select "Properties+ tool name" from the context menu, and select "Extend Lines" from the Properties box on tools which allow this option. You can also save this option as default to activate it each time you will use this graphic tool
You can save this option as a default option by pressing "Save As Default" to activate it each time you will use this graphic tool
4. How to copy tools of category "Lines and Supports:
To copy your tool, right-click on the instrument you'd like to copy and select: "Copy + tool name" A new similar set of lines will automatically appear on the chart.
5. How to delete tools of category "Lines and Supports:
You can remove the tools either by right-clicking on them and select: "Delete + tool name" Or by using the "Clear all tools" icon (See section: Remove Graphic Instruments)
Regression Lines and Channels
The regression tools available on Trade Interceptor 4.0 are:
Regression Line
Raff Regression Channel
Standard Error Channel
Standard Deviation Channel
Regression Channel
This section explains how to: - draw regression tools - extend regression tools - copy regression tools - delete regression tools
- To see how to change regression tools' properties, go to section: Change Tools Properties
1. How to draw regression tools:
A. Using the icons of the Fixed Toolbar:
choose the desired regression tool by clicking on its icon( see above) then click on the chart where you'd like the lines to start. Keep the left command of your mouse pressed to draw the lines from the beginning to the end of the selected chart area. Release your mouse command when you're finished with the drawing.
When you're finished, click on the icon again to disable this function since it is not disabled automatically by default.
B. Using the Menu Bar
Alternatively, you can select "Tools>Regression Lines" from the Menu Bar choose one of the five tools and start drawing.
To disable the function go through the same path "Tools>Regression Lines" again. The function is automatically disabled when you select another graphic instrument.
2. How to extend regression tools:
You can extend regression tools in the past or in the future by selecting one line's end and using the left-command of your mouse to extend the lines to another chart level.
You can automatically draw extended dashed lines in the future, by changing their properties. Tools properties can be changed:
- through a right-click of the mouse on the tool. Then select "Properties+tool name" from the context menu, and select "Extend Lines" from the Properties box. You can also save this option as default to activate it each time you will use this graphic tool
- or by using the "Active Objects Window": see Change Tool Properties
You can save this option as a default by pressing "Save As Default" to activate it each time you will use this graphic tool.
3. How to copy regression tools:
You can copy and paste regression tools by right-clicking on the instrument you'd like to copy and select: "Copy+ tool name"
A new similar instrument will automatically appear on the chart.
4. How to delete regression tools:
You can remove regression tools either by right-clicking on them and select: "Delete + tool name". Or by using the "Clear all tools" icon (See section: Remove Graphic Instruments)
Remove Graphic Instruments
You can delete graphic tools, studiesand objects, either one by one, or all together simultaneously.
1. To remove one graphic instrument at a time:
You can either:
- Right-click on an instrument and select: Delete Instrument
- Or click on the icon located in the upper left corner of the chart pane then choose the desired instrument for removing and click" Delete" button.
2. To remove all graphic instruments simultaneously:
- simply click on the icon and all tools will be canceled simultaneously.
Graphic Studies
Graphic studies available in Trade Interceptor Charting 4.0 are: - Fibonacci Arcs
- Fibonacci Retracements - Fibonacci Target - Fibonacci Time Zones - Gann Lines
- Gann Fans - Angle Lines
To find out more about these graphic studies, click on the appropriate link in the above list. See also sections:
- Graphic Tools - Graphic Objects
Fibonacci Retracements
You can find all Fibo tools in the Fixed Toolbar:
1. To draw Fibonacci Retracements:
A.
Using the icons of the Fixed Toolbar: - Click on the icon .Click on the chart where you'd like the retracements line to start
Keep the left command of your mouse pressed to draw the retracements Release your mouse command when you're finished.
B. Using the Menu Bar
Alternatively, you can select "Tools/Fibonacci Tools/Fibonacci Retracement" from the Menu Bar and start drawing one or more retracements.
To disable the function, select "Tools/Fibonacci Tools/Fibonacci Retracement" again. The function is automatically disabled when you select another graphic instrument.
2. To move Fibonacci Retracements:
Just click on the main line to select the tool and drag it to a different place. This option is possible after you unfreeze the tool form "Properties" box
3. To copy Fibonacci Retracements:
You can copy and paste Fibonacci Retracements by right-clicking on the instrument you'd like to copy and select: Copy Fibonacci Retracements
A new similar instrument will automatically appear on the chart.
4. To change the level and angles of Fibonacci Retracements:
You can change Fibonacci retracements angles directly from the graph by selecting the main line from one end and move it to the new chosen angle.
Example:
Fibonacci Arcs
You can find all Fibo tools in the Fixed Toolbar:
This section explains how to: - draw Fibonacci arcs - move Fibonacci arcs - extend Fibonacci arcs
- change the properties of Fibonacci arcs - copy Fibonacci arcs
- delete Fibonacci arcs
1. How to draw Fibonacci arcs:
A. Using the icons of the Fixed Toolbar:
- click on the icon .
Click on the chart where you'd like the arcs line to start
Keep the left command of your mouse pressed to draw the line and arcs Release your mouse command when you're finished.
B. Using the Menu Bar
Alternatively, you can select "Tools/Fibonacci Tools/Fibonacci Arcs" from the Menu Bar and start drawing one or more arcs.
To disable the function, select "Tools/Fibonacci Tools/Fibonacci Arcs" again. The function is automatically disabled when you select another graphic instrument.
2. How to move Fibonacci arcs:
You can move Fibonacci arcs on the chart by selecting the arcs area and dragging it to a different place. By default this is not possible until it is unfrozen from properties menu of the tool.
3. How to extend Fibonacci arcs:
You can extend Fibonacci arcs in the past and in the future, by selecting one end of the line and using the left-command of your mouse to extend the line to another chart level.
4. How to change the properties of Fibonacci arcs:
You can change Fibonacci arcs properties either by right-clicking on the main line. Then select "Properties Fibonacci Arcs" from the context menu, and modify properties from the Properties window,
or by clicking the icon "Show Active Objects" in order to choose the Properties window from there
You can save the new properties as default properties to activate them each time you will use this graphic tool by pressing "Save As Default", or you can apply these properties only to the active chart window by pressing "OK".
If you want to cancel the operation and return to the default properties, press "Cancel"
5. How to copy Fibonacci arcs:
You can copy and paste Fibonacci arcs by right-clicking on the instrument you'd like to copy and select: Copy Fibonacci arcs
A new similar instrument will automatically appear on the chart.
6. How to delete Fibonacci arcs:
You can remove Fibonacci arcs either by right-clicking on them and select: Delete Fibonacci arcs. Or by using the "Clear all tools" icon (See section: Remove Graphic Instruments).
Fibonacci Target
You can find all Fibo tools in the Fixed Toolbar:
1. To draw Fibonacci Target:
A.
Using the icons of the Fixed Toolbar- Click on the icon .
Click on the chart to select the first level of the Fibonacci Target area. Keep the left command of your mouse pressed to draw the Fib. Target Release your mouse command when you're finished.
B. Using the Menu Bar
Alternatively, you can select "Tools/Fibonacci Tools/Fibonacci Target" from the Menu Bar and start drawing one or more retracements.
To disable the function, select "Tools/Fibonacci Tools/Fibonacci Target" again. The function is automatically disabled when you select another graphic instrument.
2. To move Fibonacci Target:
Just click on the main line to select the tool and drag it to a different place. This option is possible after you unfreeze the tool form "Properties" box
3. To copy Fibonacci Target:
You can copy and paste Fibonacci Target by right-clicking on the instrument you'd like to copy and select: Copy Fibonacci Target
A new similar instrument will automatically appear on the chart.
4. To change the properties of Fibonacci Target:
A. You can set your Fibonacci preferences as default properties, in order to apply them each time you use the study by selecting "Show Active Objects" from the chart's upper left
corner , find your "Fibonacci Target" tool and insert new properties such as add lines, change line color and style, insert new line level, automatically extend retracements lines. Then press OK to save the new properties as default settings.
B. Directly from the chart: Right-click on the tool.