Space Projection Model Instructions
PURPOSE OF THE MODELThe Space Planning Model provides a fair and equitable assessment of space needs at Texas’ public universities, technical colleges, the Lamar State Colleges, and public health-related institutions. It is used to assess the need for new construction and to determine whether an institution’s new construction will qualify for maintenance and operation funding provided by general revenue. Understanding the concepts of the Space Model will assist the institution in its planning efforts.
THE MODEL
This active model responds to an institution’s evolving characteristics that drive its need for space. The model is sensitive to an institution’s unique characteristics among programs, levels of instruction, total current fund and research expenditures, and clinical space. It responds to both economies and diseconomies of scale resulting from:
(1) large numbers of classrooms and class labs of varying size that can more efficiently be matched to large numbers of classes;
(2) small enrollments which demand certain minimum space requirements; and (3) institutional complexities resulting from research or public service activities.
USES OF THE MODEL • BOARD REVIEW
The Texas Higher Education Coordinating Board uses the model as part of its review process in the consideration of proposals for facilities projects that would generate new space.
• RESOURCE ALLOCATION
The model is also used for the allocation of the Infrastructure Formula Funds, Higher Education Assistance Fund, and in the evaluation of requests for Tuition Revenue Bonds.
PUBLIC UNIVERSITIES, TECHNICAL COLLEGES, AND LAMAR STATE COLLEGES
In October 1992, the Texas Higher Education Coordinating Board approved the Space Projection Model for Higher Education Institutions in Texas for public universities, technical colleges, and the Lamar State Colleges. The model predicts the net assignable square feet (NASF) of educational and general (E&G) space an institution needs in five categories:
teaching, library, research, office, and support space. In 1997, the Legislature incorporated the model into the funding formulas for general academic institutions. It is also used in the
Because of its importance, the Commissioner of Higher Education appointed an advisory committee to review the model and report any findings and recommendations. The Board approved changes to the model in July 1998. In September 1999, the Commissioner requested the University Formula Advisory Committee to include the model in its review of the
infrastructure formula; the Board adopted a change to the Library Factor recommended by the Committee in April 2000. The Board approved the most recent change, to the Teaching Factor, in April 2002. This document describes the model reflecting the Board’s actions.
HEALTH-RELATEDINSTITUTIONS
In October 1992, the Texas Higher Education Coordinating Board approved the Health-Related Space Projection Model. This model predicted the need for educational and general (E&G) space in net assignable square feet (NASF) of health-related institutions in four
categories: teaching, research, office, and support space. The model is used by the Board to make decisions related to the approval of proposals providing additional space.
In June 1998, the Senate Finance Committee asked the Coordinating Board to review the model to ensure that it accurately reflected the space needs of health-related institutions. To address those concerns, the Health-Related Space Projection Model Advisory Committee was appointed by the Commissioner of Higher Education to review the model and report its findings and recommendations. The committee included a representative from each of the affected institutions and met between June 1998 and January 1999. In September 1999, the Commissioner requested that the Health-Related Formula Advisory Committee include the model in its review of health-related formulas. The Commissioner adopted many of the
committee’s recommendations and presented them to the Coordinating Board at its April 2000 meeting. This document describes the model as adopted by the Coordinating Board at that meeting. No further changes have been made in the model since that time.
Academic Five-Factor Model
The five-factor academic space projection model predicts the educational and general (E&G) space required for a public university, technical college, or state college to fulfill its missions of teaching, research, and public service. Auxiliary space, such as dormitories, bookstores, intercollegiate athletics, or other auxiliary enterprises, is not included.
The base unit of the model’s factors is room type.1 Only E&G space receives
appropriations for maintenance and operations, and it is the only space predicted by this model. Room types are grouped into the five space categories in the model and are associated with the specific data that drive each particular type of space.
Each factor is based on drivers or elements that are used to compute the predicted space in each category. These data are developed from various institutionally provided information and their certified state reports.
FACTORS DRIVERS/PREDICTORS
Teaching space Level and program areas of an institution’s funded semester credit hours Library space Faculty, students, approved programs, and holdings
Research space Research expenditures and students’ reported semester credit hours Office space Faculty, staff, and current fund E&G expenditures
Support space A percentage of the total prediction for all the other factors
Academic Five-Factor Model
Academic Institutions
Teaching Space
Library Space
Research Space
Office Space
Support Space
1
Room types are taken from the National Center for Higher Education Management Systems’ (NCHEMS) Higher Education Facilities Inventory and Classification Manual and described in the Coordinating Board’s Texas Higher Education Facilities Inventory Procedures Manual.
Factor 1 - Teaching Space
Teaching space includes rooms used for instruction and are represented in the institution’s facilities inventory by room type. The following room types are considered in this factor:
Room Type Description
100 classrooms
210-235 class labs, special class labs, and self-study labs
500 physical education, demonstration, audiovisual, and animal quarters 600 assembly, exhibition, lounge, meeting rooms, and locker rooms The predicted teaching space depends on two factors:
funded semester credit hour production by program area
funded semester credit hour production by level of course
A full-time-student equivalent (FTSE) is calculated for each program area and course level based on credit hours. FTSE are calculated using the Coordinating Board’s standard methodology of contact hours divided by 300 and semester hours divided by 15. A reduced allowance is made for the graduate levels because these students require less special or general use space, classrooms, and class labs.
Level Credit Hours FTSE Allowance
Undergraduate 15 100%
Master’s and professional 12 70%
(law and optometry)
Doctorate-level programs 9 40%
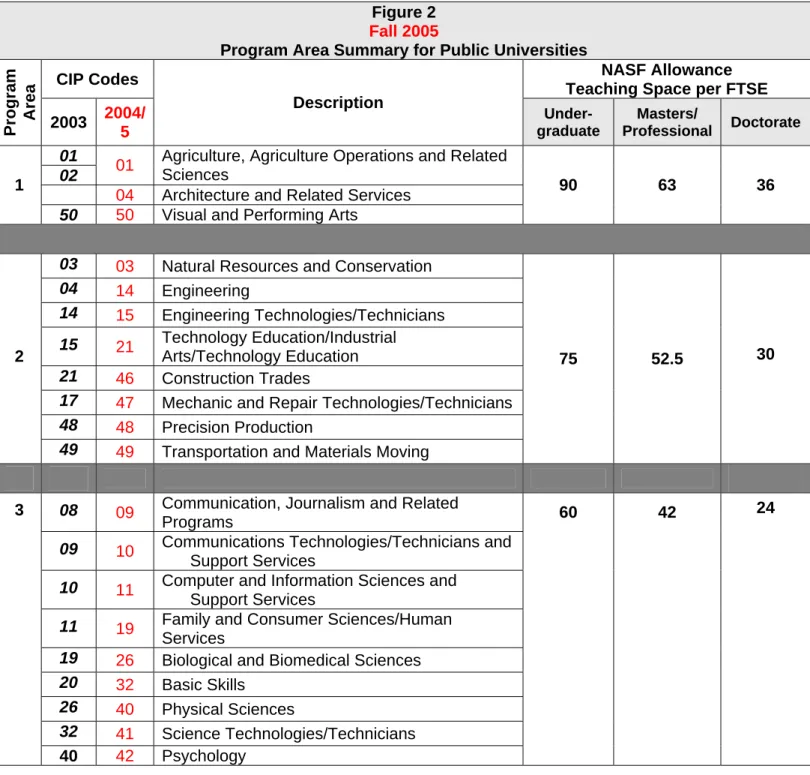
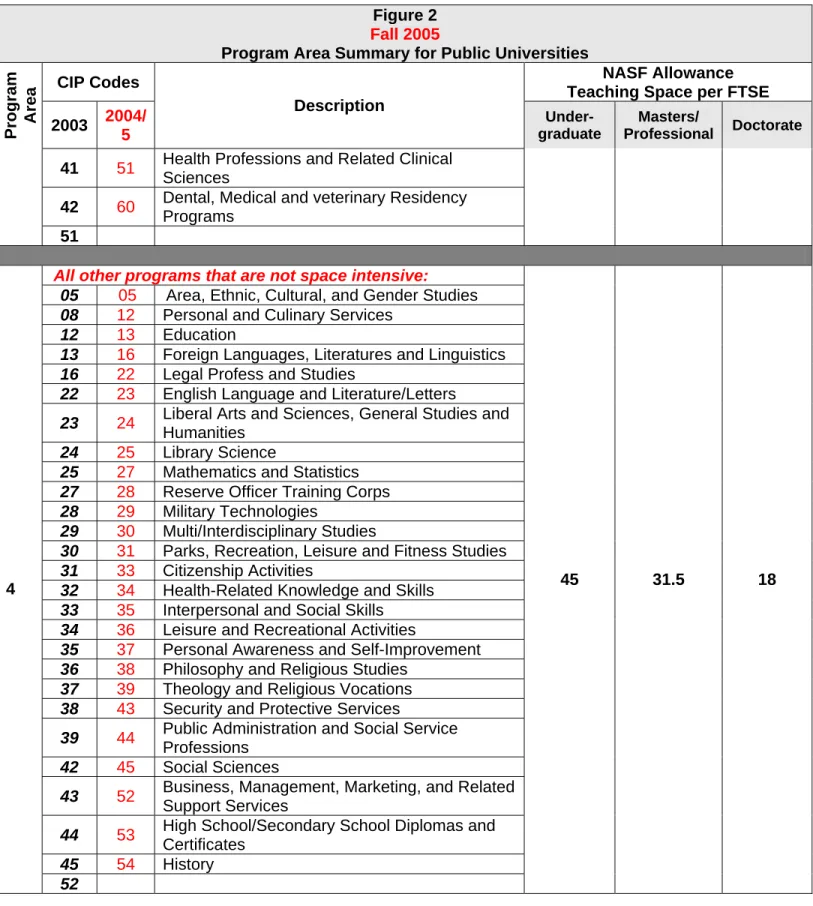
Teaching space is assigned to one of four different programmatic areas based on space requirements. Figure 2 presents these program areas and the CIP codes that are included in each area. Program Area 4 is used as the base for all calculations, and additional NASF are added to this calculation depending upon the program area. Figure 1 presents how the base NASF for Program Area 4 is determined and the additional NASF allowed for each program area.
Figure 1
Base by Program Area4
Room Type Room Category Square Feet per FTSE
Classroom 110 11
Class Lab 210 8
Special Class Lab 220 3
Self Study Lab 230 3
P.E. etc. 500s 10
Assembly, etc. 600s 5
Subtotal 40
Service Space 5
Total Program Area 4 45 (BASE)
Program Area 1 BASE + 45 = 90
Program Area 2 BASE + 30 = 75
Program Area 3 BASE + 15 = 60
An economy of scale variable is applied to those institutions with more than 15,000 undergraduate FTSE. A factor of .98 is used for the first 1,000 FTSE above 15,000, and the factor decreases .02 for each increase of 1,000 undergraduate FTSE. It is only applied to the predicted undergraduate space.
Teaching space is assigned to one of four different programmatic areas based on space requirements. Figure 1 presents these program areas and the CIP codes that are included in each area.
Figure 2 Fall 2005
Program Area Summary for Public Universities
CIP Codes NASF Allowance
Teaching Space per FTSE
Program Area 2003
2004/ 5
Description
Under- graduate
Masters/
Professional Doctorate
01
02 01
Agriculture, Agriculture Operations and Related Sciences
04 Architecture and Related Services 1
50 50 Visual and Performing Arts
90 63 36
03 03 Natural Resources and Conservation
04 14 Engineering
14 15 Engineering Technologies/Technicians
15 21 Technology Education/Industrial Arts/Technology Education
21 46 Construction Trades
17 47 Mechanic and Repair Technologies/Technicians
48 48 Precision Production 2
49 49 Transportation and Materials Moving
75 52.5 30
08 09 Communication, Journalism and Related
Programs
09 10 Communications Technologies/Technicians and Support Services
10 11 Computer and Information Sciences and Support Services
11 19 Family and Consumer Sciences/Human Services
19 26 Biological and Biomedical Sciences
20 32 Basic Skills
26 40 Physical Sciences
32 41 Science Technologies/Technicians 3
40 42 Psychology
Figure 2 Fall 2005
Program Area Summary for Public Universities
CIP Codes NASF Allowance
Teaching Space per FTSE
Program Area 2003
2004/ 5
Description
Under- graduate
Masters/
Professional Doctorate
41 51 Health Professions and Related Clinical Sciences
42 60 Dental, Medical and veterinary Residency Programs
51
All other programs that are not space intensive:
05 05 Area, Ethnic, Cultural, and Gender Studies
08 12 Personal and Culinary Services
12 13 Education
13 16 Foreign Languages, Literatures and Linguistics
16 22 Legal Profess and Studies
22 23 English Language and Literature/Letters
23 24 Liberal Arts and Sciences, General Studies and Humanities
24 25 Library Science
25 27 Mathematics and Statistics
27 28 Reserve Officer Training Corps
28 29 Military Technologies
29 30 Multi/Interdisciplinary Studies
30 31 Parks, Recreation, Leisure and Fitness Studies
31 33 Citizenship Activities
32 34 Health-Related Knowledge and Skills
33 35 Interpersonal and Social Skills
34 36 Leisure and Recreational Activities
35 37 Personal Awareness and Self-Improvement
36 38 Philosophy and Religious Studies
37 39 Theology and Religious Vocations
38 43 Security and Protective Services
39 44 Public Administration and Social Service Professions
42 45 Social Sciences
43 52 Business, Management, Marketing, and Related Support Services
44 53 High School/Secondary School Diplomas and Certificates
45 54 History 4
52
45 31.5 18
Technical Colleges and the Lamar State Colleges
The space factors for academic programs at the Texas State Technical Colleges (TSTC), Lamar State College-Orange, Lamar State College-Port Arthur, and Lamar Institute of Technology are the same as those used by the universities but have additional program areas for vocational courses. Figure 3 presents the space factors for the four vocational program areas.
Figure 3
Vocational Program Areas Space Factors Vocational
Program Area
Programs NASF per
FTSE
1
Auto mechanics Auto body repair Construction & industrial trades
Agriculture Fire protection technology Machine shop
Air conditioning and heating
Cosmetology
120
2 Vocational Nursing Allied Health Printing and Graphic Arts
90
3
Secretarial Business data processing
Drafting and design
Instrumentation Culinary arts Radio & TV repair
Electronics
Home economics 60
4 Law enforcement Mental health Management
Commercial pilot Technology Marketing
Cooperative work experience
Occupational health & safety
45
Factor 2 - Library Space
Library Space for Public Universities
Library space includes all room type 400s -- reading/study rooms, stack space, and associated service areas -- and all room type 300s with a 41 (library) usage code. Library spaceis calculated primarily using the Association of College and Research Libraries (ACRL) standards for college libraries. Figure 4 presents the calculation variables for volumes.
Figure 4
Calculation Variables (Volumes)
Volume Predictor Volumes
Basic Collection 85,000
Allowance per FTE faculty 100
Allowance per FTE student 15
Allowance per undergraduate major field 350
Allowance per master’s if highest degree offered 6,000 Allowance per master’s if not highest degree offered 3,000 Allowance per 6th year specialist degree field 6,000
Allowance per doctoral field 25,000
Predicted university library space depends upon two factors: the number of volumes and the number of users. Figure 5 lists the amount of NASF allowed per volume and per user.
Figure 5
University Library Space Allowance Factors
Number of Volumes NASF per Volume
For the first 150,000 volumes 0.10
For the next 150,000 volumes 0.09
For the next 300,000 volumes 0.08
For holdings above 600,000 volumes 0.07
For law library holdings 0.25
Type of User NASF per User
FTE student 6.25 NASF
FTE faculty 3.0 NASF
NASF is calculated for each factor, and the sum is then multiplied by 12.5 percent to determine staff needs.
Staff Space = 12.5% of the total space calculated (TS1)
Total Space (TS2) = TS1 + Staff Space
The result is then multiplied by 17 percent to account for unforeseen needs. Additional Library Space = 17% of TS2
Total Space (TS3) = TS2 + Additional Library Space
The final value is obtained by multiplying the outcome by 0.95. According to the ACRL, libraries that provide 90 to 100 percent of the NASF predicted by the formula are graded “A” in terms of space. By applying a 95 percent adjustment to the NASF sum, the model predicts a reasonable amount of NASF to meet the needs of the institution.
Library Space for Technical Colleges and Lamar State Colleges
The library calculation for the TSTC campuses, Lamar State College-Port Arthur, Lamar State College-Orange, and Lamar Institute of Technology is dependent upon the FTSE reported by each institution. Each FTSE is provided 50 volumes at 0.10 NASF for each stack space and 6.25 NASF for study space. To account for staff needs, 12.5 percent of the sum of the stack space and study space is added.
Stack Space = FTSE x (50 volumes x .10 NASF) Study Space = FTSE x 6.25 NASF
Staff Space = 12.5 percent of the total space calculated
Total Predicted Library Space = Stack Space + Study Space + Staff Space
Factor 3 – Research Space
Research space includes all non-class (research) laboratories and service rooms (room type 250 and 255). Predicted research space is determined using one of two methods,
depending on which method yields the greatest NASF prediction.
Method 1
Multiply 9,000 NASF for every inflated $1 million in average research expenditures reported by the institution. The inflated rate is determined by the Consumer Price Index from September 1991 (the year the space model was developed) to the September that corresponds to the fall enrollment data being used for the model. An average of the last three years’
research expenditures is used for this calculation. For example: September 1991 factor = 137.2
September 2002 factor = 181.0
Inflation rate = (181.0 – 137.2) / 137.2 = 31.92%
Divisor = $1,000,000 X ($1,000,000 X 0.3192) = $1,319,242
Method 2
For each FTSE the institution reports, allot 3 NASF.
Factor 4 - Office Space
Office space includes all offices, conference rooms, and associated service areas (room type 300s). Type 300 rooms reported with a 41 (library) usage code used in the library factor formula are omitted from the office space calculation to eliminate duplication. Predicted office space is determined using one of two methods, depending on which method yields the greatest NASF prediction.
Method 1
The first method depends on the FTE faculty reported by the institution. The source for FTE faculty is the Coordinating Board’s CBM-008 Faculty Report. The staff FTE is estimated to be 1.8 times FTE faculty for universities and 1.25 times FTE faculty for the Texas State
Technical Colleges, Lamar State College - Orange, Lamar State College - Port Arthur, and Lamar Institute of Technology. Each FTE faculty is allowed 190 NASF, and staff FTE is allowed 170 NASF each.
Figure 6 presents how the space needs for FTE faculty and staff FTE are determined. Figure 6
Determination of Faculty FTE and Staff FTE Space Need
Type of Space Faculty Space Need Staff Space Need
Office 120 NASF 120 NASF
Conference Room 30 NASF 20 NASF
Service Area 20 NASF 10 NASF
Departmental Administration 20 NASF 20 NASF
Total 190 NASF 170 NASF
Method 2
The second method is dependent upon the current E&G expenditures reported by the institution. For each $1 million (adjusted for inflation) reported, 3,500 NASF is allowed.
Factor 5 - Support Space
Support space is calculated at 9 percent of the sum of predicted space from the teaching, library, research, and office factors. Support space includes all data processing/ computer rooms, shops, storage, vehicle storage, and associated service areas (room type 700s).
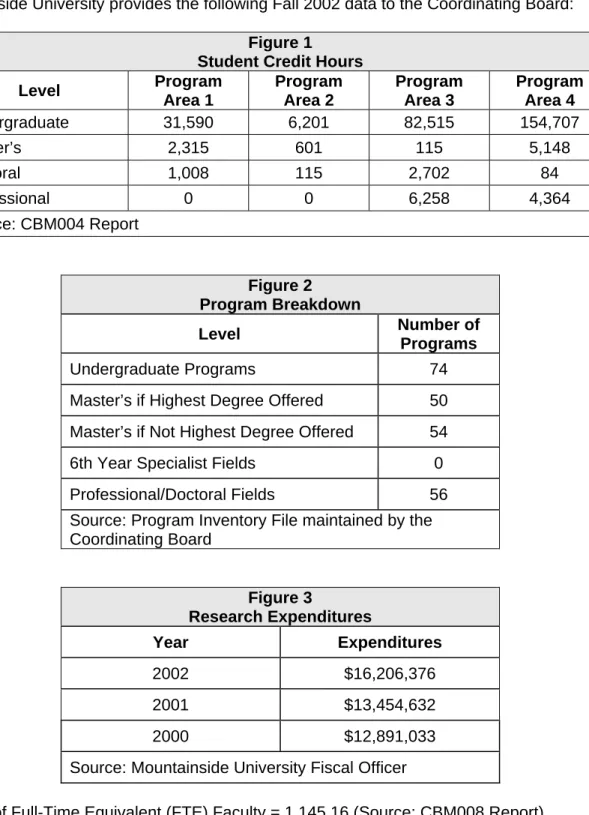
Example of Space Model Calculations “Mountainside University”
Mountainside University provides the following Fall 2002 data to the Coordinating Board: Figure 1
Student Credit Hours
Level Program
Area 1
Program Area 2
Program Area 3
Program Area 4
Undergraduate 31,590 6,201 82,515 154,707
Master’s 2,315 601 115 5,148
Doctoral 1,008 115 2,702 84
Professional 0 0 6,258 4,364
Source: CBM004 Report
Figure 2 Program Breakdown
Level Number of
Programs
Undergraduate Programs 74
Master’s if Highest Degree Offered 50 Master’s if Not Highest Degree Offered 54 6th Year Specialist Fields 0 Professional/Doctoral Fields 56 Source: Program Inventory File maintained by the Coordinating Board
Figure 3
Research Expenditures
Year Expenditures 2002 $16,206,376 2001 $13,454,632 2000 $12,891,033 Source: Mountainside University Fiscal Officer
Number of Full-Time Equivalent (FTE) Faculty = 1,145.16 (Source: CBM008 Report) Law Library Volumes = 175,900 (Source: Mountainside University Fiscal Officer)
Predicted Teaching Space
Mountainside University’s student credit hours are the basis for calculating predicted teaching space. First, the full-time student equivalent (FTSE) is calculated by dividing the number of credit hours for each program area and level by the appropriate Coordinating Board credit hour standard for that level:
Figure 4
Calculated Teaching Space
Undergraduate Master’s Doctoral Professional
Credit Hour Standard 15 12 9 12
Total Reported
Credit Hours 31,590 2,315 1,008 0 34,913
Progra m
Area 1 Calculated
FTSE 2,106.00 192.92
112.00 0
2,410.92 Reported
Credit Hours 6,201 601 115 0 6,917
Progra m
Area 2 Calculated
FTSE 413.40 50.08 12.78 0
476.26 Reported
Credit Hours 82,515 115 2,702 6,258 91,590
Progra m
Area 3 Calculated
FTSE 5,501.00 9.58
300.22 521.50 6,332.31 Reported
Credit Hours 154,707 5,148 84 4,364 164.303
Progra m
Area 4 Calculated
FTSE 10,313.80
429.00 9.33 363.67
11,115.80 Total Reported Credit
Hours 275,013 8,719 3,909 10,622 297,723
Total Calculated FTSE
(Credit Hours / Standard) 18,334.20 681.58
434.33 885.17
20,335.28
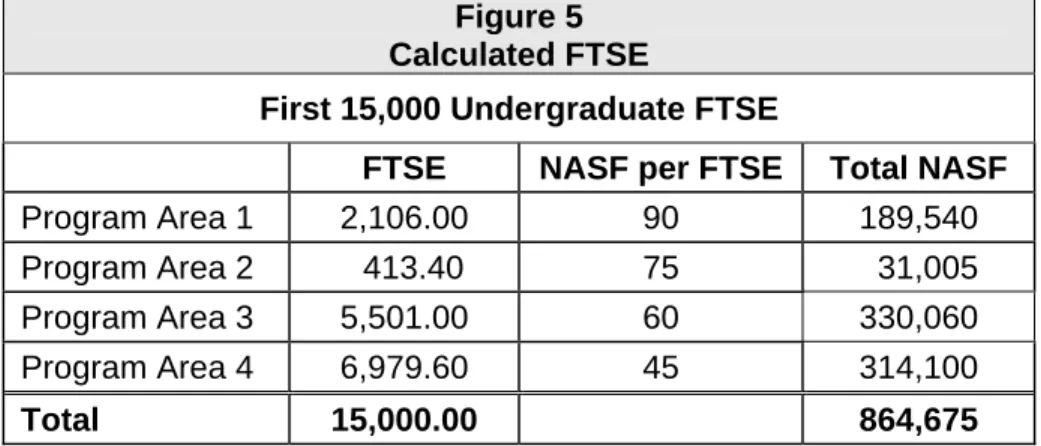
The NASF can be calculated by multiplying the FTSE for each program area and level by the corresponding NASF per FTSE specified by the Coordinating Board. Because Mountainside University has more than 15,000 undergraduate FTSE, the economy of scale coefficients must be applied to each 1,000 FTSE increment above 15,000.
Figure 5 Calculated FTSE
First 15,000 Undergraduate FTSE
FTSE NASF per FTSE Total NASF
Program Area 1 2,106.00 90 189,540
Program Area 2 413.40 75 31,005
Program Area 3 5,501.00 60 330,060
Program Area 4 6,979.60 45 314,100
There are 18,334.20 undergraduate FTSEs at Mountainside University. The 15,000 FTSE limit is reached after the FTSEs in Program Areas 1, 2, 3 and 6,979.60 FTSEs from Program Area 4 have been accounted for, so the economy of scale coefficients are applied to the additional 3,334.20 FTSEs in Program Area 4:
Figure 6
Adjustment for >15,000 Undergraduate FTSE FTSE
Increment Coefficient Result
NASF per
FTSE Total NASF
1,000 0.98 980 45 44,100 1,000 0.96 960 45 43,200 1,000 0.94 940 45 42,300 334.20 0.92 307.46 45 13,836
Total 143,436 Total predicted teaching space for the undergraduate level is:
Calculated FTSE NASF 864,675 NASF Adjustment + 143,436
Predicted Undergraduate = 1,008,111 NASF
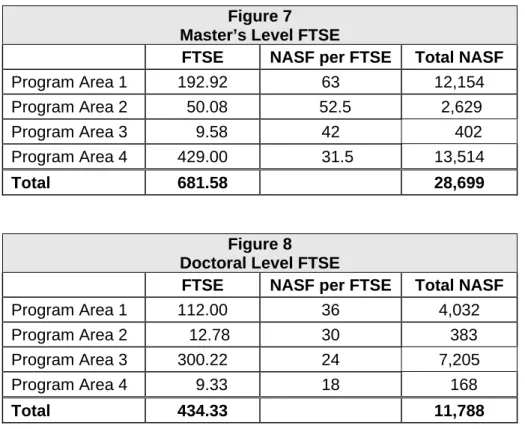
Predicted teaching space for the Master’s, Doctoral, and Professional levels do not use economies of scale coefficients, so the calculation is more straightforward:
Figure 7 Master’s Level FTSE
FTSE NASF per FTSE Total NASF
Program Area 1 192.92 63 12,154
Program Area 2 50.08 52.5 2,629 Program Area 3 9.58 42 402 Program Area 4 429.00 31.5 13,514
Total 681.58 28,699
Figure 8 Doctoral Level FTSE
FTSE NASF per FTSE Total NASF
Program Area 1 112.00 36 4,032
Program Area 2 12.78 30 383
Program Area 3 300.22 24 7,205
Program Area 4 9.33 18 168
Figure 9
Professional Level FTSE
FTSE NASF per FTSE Total NASF
Program Area 1 0.00 63 0
Program Area 2 0.00 52.5 0
Program Area 3 521.50 42 21,903
Program Area 4 363.67 31.5 11,456
Total 885.17 33,359
The sum of the predicted teaching space for the undergraduate, master’s, doctoral, and professional level FTSE results in the total predicted teaching space for Mountainside University:
Predicted Undergraduate Space = 1,008,111 NASF Predicted Master’s Space + 28,699 NASF Predicted Doctoral Space + 11,788 NASF Predicted Professional Space + 33,359 NASF Total Predicted Teaching Space = 1,081,957 NASF
Predicted Library Space
Mountainside University’s FTE faculty, FTSE, and program levels are the basis for calculating predicted library space. First, the predicted number of volumes is calculated for each factor and summed:
Figure 10
Calculated Library Space
Factor Amount
Reported
Volumes per Factor
Volumes Calculation
Basic Allowance 85,000 85,000
Per Faculty FTE 1,145.16 100 114,516
Per Student FTE 20,335.28 15 305,029
Per UG Major Field 74 350 25,900
Master’s if Highest Degree Offered 50 6,000 300,000 Master’s if Not Highest Degree
Offered 54 3,000 162,000
6th Year Specialist Field 0 6,000 0
Professional/Doctoral Field 56 25,000 1,400,000
Total Calculated Volumes 2,392,445
The calculated volumes are used to determine the total space required to store library holdings. The first 150,000 volumes receive 0.10 NASF per volume. Lower NASF-per-volume coefficients are applied to subsequent volumes. Law library holdings are permitted 0.25 NASF per volume:
Figure 11 Calculated Volumes
Number of Volumes NASF per
Volume
Mountainside
Volumes Total NASF
For the first 150,000 volumes 0.10 150,000 15,000 For the next 150,000 volumes 0.09 150,000 13,500 For the next 300,000 volumes 0.08 300,000 24,000 For holdings above 600,000 volumes 0.07 1,792,445 125,471
For law library holdings 0.25 175,900 43,975
Total NASF for Volumes 221,946
Space needs for faculty and students is then calculated: Figure 12
Calculated Faculty and Student Space
Type of User NASF per
User
Number of
Users Total NASF
FTE Faculty 3.00 1,145.16 3,435
FTE Student 6.25 20,335.28 127,096
Total NASF for Users 130,531
The sum of the NASF for Volumes and NASF for Users is multiplied by 12.5 percent to determine staff space needs.
NASF for Volumes 221,946 NASF for Volumes 221,946 NASF for Users + 130,531 NASF for Users 130,531
x 0.125 = 352,477
NASF for Staff = 44,060 NASF for Staff + 44,060
Total NASF = 396,537
The result is then multiplied by 17 percent to determine additional space for unforeseen needs. Total NASF 396,537
x 0.17
Additional Library Space = 67,411 NASF
Total NASF 396,537
Additional Space + 67,411
Total Library Space = 463,948 NASF
Predicted library space is obtained by multiplying the outcome by 0.95. Total Library Space 463,948
x 0.95
Predicted Research Space
Predicted research space is calculated two ways. The method that yields the greatest amount of space is used.
Method 1
The first method is based on the average of the last three years of reported research expenditures *. An inflated $1 million is determined from the consumer price index:
September 1991 Factor from Consumer Price Index = 137.2 September 2002 Factor from Consumer Price Index = 181.0 Inflation Rate = (181.0 - 137.2) / 137.2 = 31.92% Divisor $1,000,000 x ($1,000,000 x 0.3192) = $1,319,242
* Research expenditures include the expenditures reported in the institution’s Annual Financial Report (AFR) plus any foundation or 501c3 and TEES pass-through expenditures reported on the Annual Research Expenditures Report to the Coordinating Board.
The average research expenditures figure is divided by the inflated $1 million amount. For every inflated $1 million in average research expenditures, 9,000 NASF is allowed.
Average Research Expenditures 2002 $16,206,376 Average Research Expenditures 2001 + $13,454,632 Average Research Expenditures 2000 + $12,891,033 Average Research Expenditures 3 years = $42,552,041
÷
3= $14,184,014
Number of Inflated $1 million =
Average Research Expenditures, 3 years $ 14,184,014 Inflated $1 million
÷
$ 1,319,242= $ 10.75
Total NASF for Method 1
9,000 NASF
x 10.75
= 96,750 NASF
Method 2
The second method is based on the number of calculated FTSE. For each FTSE, 3 NASF are allotted:
Total NASF for Method 2
20,335.28
x 3 NASF
= 61,006 NASF
In the case of Mountainside University, Method 1 results in a higher predicted research space: Total Predicted Research Space = 96,750 NASF
Predicted Office Space
Predicted office space is calculated two ways. The method that yields the greatest amount of space is used.
Method 1
The first method is dependent upon the FTE faculty reported by the institution. The staff FTE is estimated to be 1.8 times the FTE faculty for universities. FTE faculty is allowed 190 NASF each, and staff FTE is allowed 170 NASF.
Reported FTE Faculty 1,145.16 Factor x 1.8
Calculated Staff FTE 2,061.29
Figure 13
Calculated Office Space
FTE Type NASF per
FTE
Number of
FTEs Total NASF
FTE Faculty 190 1145.16 217,580
FTE Staff 170 2,061.29 350,419
Total NASF for Method 1 567,999
Method 2
The second method is based on the current E&G expenditures reported by the institution. For each $1 million (adjusted for inflation) reported, 3,500 NASF is allotted.
Reported Current Expenditures = $243,030,459 Divided by Inflated $1 million
÷
$ 1,319,242 Number of Inflated $1 million = 184.22Total NASF for Method 2 =
NASF 184.22
NASF Allotment x 3,500 Total NASF Method 2 = 644,770
In the case of Mountainside University, Method 2 results in a higher predicted office space: Total Predicted Office Space = 644,770 NASF
Predicted Support Space
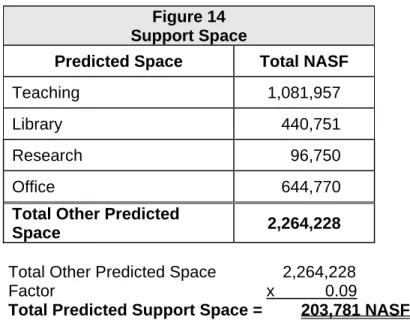
Predicted support space is calculated at 9 percent of the sum of predicted space from the teaching, library, research, and office factors:
Figure 14 Support Space
Predicted Space Total NASF
Teaching 1,081,957
Library 440,751
Research 96,750
Office 644,770
Total Other Predicted
Space 2,264,228
Total Other Predicted Space 2,264,228 Factor x 0.09
Total Predicted Support Space = 203,781 NASF
Calculating Space Surplus/Deficit
Mountainside University’s total predicted E&G NASF for fall 2002 is: Figure 15
All Predicted Space
Predicted Space Total NASF
Teaching 1,081,957
Library 440,751
Research 96,750
Office 644,770
Support 203,781
Total Predicted Space 2,468,009
The actual amount of E&G NASF currently reported by Mountainside University in its Facilities Inventory File maintained by the Coordinating Board is used in identifying the actual space. Below is a sample of the data report details.
Figure 16
Total Campus Space by Room Type
TYPE OF ROOM NASF E&G NASF
Classrooms:
110 Classroom 215,523 215,523
112 Classroom Service 20,364 20,364
SUBTOTAL 235,887 235,887
Class Laboratories:
Figure 16 (con’t)
Total Campus Space By Room Type
TYPE OF ROOM NASF E&G NASF
215 Class Laboratory Service 68,278 68,278 220 Special Class Laboratory 45,821 42,698 225 Special Class Laboratory Service 10,554 9,845 230 Individual Study Laboratory 164,228 160,847 235 Individual Study Laboratory Service. 8,476 8,476
SUBTOTAL 413,341 406,128
Actual space is calculated for teaching, library, research, office, and support space, according to the room types associated with each factor. Mountainside University’s Facilities Inventory File is used to calculate actual space for the five factors (using the room types shown in Figure 17).
Figure 17 Total Actual Space
Actual Space Total NASF Room Type
Teaching 1,097,559 100, 210-235,
500,600
Library 401,348 400, 300 with 41
use code
Research 115,872 250, 255
Office 597,480 300
Support 275,157 700
Total Actual Space 2,487,416
The total actual space calculated needs to be adjusted to include E&G NASF that has been approved by the Coordinating Board, but is still under construction and, therefore, not included in the university’s Facilities Inventory File. Assume that Mountainside University has 157,864 E&G NASF approved but not online:
Actual Space in Facilities Inventory 2,487,416 NASF E&G Space Approved but Not On-Line + 157,864 NASF Total Adjusted Actual E&G NASF = 2,645,280 NASF
To determine the surplus/deficit for Mountainside University, subtract the total predicted E&G NASF by the space model from the total actual E&G NASF:
Adjusted Actual Space 2,645,280 NASF Predicted Space - 2,468,009 NASF
Space Model Surplus/(Deficit) = 177,271 NASF Surplus
The result is considered a surplus because Mountainside University has more actual E&G NASF than the space model predicts it needs.
Health-Related Institutions Five-Factor Model
The five-factor health space projection model predicts the educational and general (E&G) space required for a public health institution to fulfill its missions of teaching, research, and public service. Auxiliary space, such as housing, bookstores, or other auxiliary enterprises, is not included.
The base unit of the model’s factors is room type.2 Only E&G space receives
appropriations for maintenance and operations, and it is the only space predicted by this model. Room types are grouped into the five space categories in the model and are associated with the specific data that drive each particular type of space.
Each factor is based on drivers or elements which are used to compute the predicted space in each category. These data are developed from various institutionally provided information and their certified state reports.
FACTORS DRIVERS/PREDICTORS
Teaching space Reported headcount for each level and educational category Research space Research expenditures and full time equivalent faculty Office space Faculty, non-faculty, and current fund E&G expenditures Clinical space Actual clinical space
Support space A percentage of the total prediction for all the other factors and library space Health Related Institutions Five-Factor Model
Health Related Institutions
Teaching Space
Research Space
Office Space
Clinical Space
Support Space Factor 1 - Teaching Space
Teaching space includes those rooms used for instruction and are represented in the institution’s facilities inventory by room type. The following room types are considered in this factor:
Room Type Description
100 classrooms
210-235 class labs, special class labs, and self-study labs
500 physical education, demonstration, audiovisual, and animal quarters 600 assembly, exhibition, lounge, meeting rooms, and locker rooms
1
Room types are taken from the National Center for Higher Education Management Systems’ (NCHEMS) Higher Education Facilities Inventory and Classification Manual and described in the Coordinating Board’s Texas Higher Education Facilities Inventory Procedures Manual.
The predicted teaching space depends on two factors:
reported headcount by educational category
reported headcount by level of course
There are seven educational categories and four levels of course. Predicated teaching space is determined by multiplying reported headcounts by its appropriate NASF per Headcount factor. Figure 1 presents the NASF per Headcount factors for each level of course by
educational category.
Figure 1
NASF per Headcount by Level of Course Educational
Category
Undergraduate Grad/Residents Post Doctoral Fellow/Trainee
Medical 120 30 30 30
Dental 120 120 30 30
Public Health 75 75 30 30
Biomedical
Science 65 55 30 30
Nursing 75 75 30 30
Allied Health 75 75 30 30
Pharmacy 65 55 30 30
Factor 2 - Research Space
Research space includes all non-class (research) laboratories and associated service rooms (room type 250 and 255) and all animal quarters and associated service areas (room type 570 and 575 rooms). Predicted research space is determined using one of two methods, depending on which method yields the greatest NASF prediction.
Method 1
Multiply 9,000 NASF for every inflated $1 million in average research expenditures * reported by the institution. The inflated rate is determined by the Consumer Price Index from September 1991 (the year the space model was developed) to the September that corresponds to the Fall enrollment data being used for the model. For example:
September 1991 factor 137.2 September 2002 factor 181.0
Inflation rate (181.0 – 137.2) ÷ 137.2 = 31.92% Divisor $1,000,000 X ($1,000,000 X 0.3192)
= $1,319,242
Method 2
For each full time equivalent (FTE) faculty the institution reports, allot 250 NASF. * Research expenditures include the expenditures reported in the institution’s Annual Financial Report (AFR) plus any foundation or 501c3 and TEES pass-through expenditures reported on the Annual Research Expenditures Report to the Coordinating Board.
Factor 3 - Office Space
Office space includes all offices, conference rooms and associated service areas (room type 300s). Predicted office space is determined using one of two methods, depending on which method yields the greatest result. If the method 1 result is greater than the method 2 result, then the method 1 result is the predicted value. If the method 2 result is greater than the method 1 result, then the results from method 1 and method 2 are averaged to obtain predicted office space.
Method 1
The first method depends on the institution’s current E&G expenditures. Current expenditures are reported in the institution’s annual financial statement. Space for auxiliary uses such as sales and correctional off-site managed care are subtracted from reported expenditures to obtain current E&G expenditures. For each $1 million of E&G expenditures (adjusted for inflation), 1,600 NASF is allowed.
Method 2
The second method depends on the FTE faculty reported by the institution. The source for FTE faculty is the Coordinating Board’s CBM-008 Faculty Report. The non-faculty FTE is estimated by multiplying the reported FTE faculty for each institution by the ratio of FTE non-faculty to FTE non-faculty shown in each institution’s Legislative Appropriations Request. FTE faculty is allowed 190 NASF each, and non-faculty FTE is allowed 170 NASF each.
Figure 2 presents the ratios of FTE non-faculty to FTE faculty for each institution as of Fall 2002. Figure 3 presents how the space needs for FTE faculty and non-faculty FTE are determined.
Figure 2
Ratio of FTE Non-Faculty to Faculty
Institution Ratio
Texas Tech University Health
Science Center 3.16
The University of Texas Health
Science Center at Tyler 2.50
The University of Texas Health
Science Center at Houston 3.02
The University of Texas Health
Science Center at San Antonio 2.06 The University of Texas M.D.
Anderson Cancer Center 2.50
The University of Texas Medical
Branch at Galveston 2.50
University of North Texas Health
Sciences Center at Fort Worth 2.60 Texas A&M University Health
Science Center 3.51
Figure 3
Determination of Faculty FTE and Non-Faculty FTE Space Need
Type of Space Faculty Space Need Non-Faculty Space Need
Office 120 NASF 120 NASF
Conference Room 30 NASF 20 NASF
Service Area 20 NASF 10 NASF
Departmental Administration 20 NASF 20 NASF
Total 190 NASF 170 NASF
Factor 4 - Clinical Space
Clinical space includes all health care rooms located in student health care centers, medical centers, teaching hospitals, and veterinary facilities (room type 800s). A formula has not been developed to predict clinical space because health-related institutions in Texas offer different clinical arrangements. The actual clinical space reported in the institution’s facilities inventory maintained by the Coordinating Board is considered the predicted clinical space in this model.
Factor 5 - Support Space
Support space includes all data processing/ computer rooms, shops, storage, vehicle storage, and associated service areas (room type 700s) and all study/library space and associated service areas (room type 400s). Predicted support space is calculated at nine percent of the sum of predicted space from the teaching, research, office, and clinical factors plus a library factor. Single-program institutions such as The University of Texas Health Center at Tyler are assigned 25,000 NASF for libraries. Multi-program institutions such as Texas Tech Health Science Center are assigned 50,000 NASF.
Multi-Campus Adjustment
A multi-campus adjustment is applied to those institutions that have operations in
locations other than the main campus. Institutions that are eligible for the adjustment must have instructional programs that are carried out on branch campuses recognized by the Legislature. Figure 4 indicates the institutions and campuses that may receive the adjustment for fall 2002.
Figure 4
Branch Campuses Eligible for the Multi-Campus Adjustment Texas Tech
University HSC
Texas A&M University HSC
UT HSC at San Antonio
UT HSC at Houston
Amarillo McAllen Edinburg Brownsville
El Paso Temple Harlingen
Midland Laredo
Odessa
For each qualifying remote campus, institutions receive a multi-campus adjustment equal to 100 percent of the first 10,000 E&G NASF on that remote campus and 25 percent of all E&G NASF in excess of the first 10,000 NASF.
Example of Space Model Calculations “Mountainside University Health Science Center”
Mountainside University Health Science Center provides the following Fall 2002 data to the Coordinating Board:
Figure 1
Headcount by Level of Course Educational
Category
Undergraduate Grad/Residents Post Doctoral Fellow/Trainee
Medical 251 266 0 80
Dental 165 15 64 11
Public Health 0 0 0 0
Biomedical
Science 0 54 0 0
Nursing 157 56 0 0
Allied Health 75 243 0 0
Pharmacy 0 198 28 0
(Source: University Fiscal Officer)
Figure 2
Research Expenditures
Year Expenditures 2002 $89,578,354 2001 $80,214,654 2000 $69,256,546 Source: University Fiscal Officer
Number of Full-Time Equivalent (FTE) Faculty = 857.48 (Source: CBM008 Report)
Current E&G Expenditures = $627,864,112 (Source: University Fiscal Officer) Auxiliary Expenditures = $624,358 (Source: University Fiscal Officer)
Predicted Teaching Space
Mountainside University Health Science Center’s reported headcount is the basis for calculating predicted teaching space. Predicated teaching space is determined by
multiplying reported headcounts by its appropriate NASF per Headcount factor: Figure 3
Calculated NASF Undergraduate Level Reported
Headcount
NASF per
Headcount Total NASF
Medical 251 120 30,120
Dental 165 120 19,800
Public Health 0 75 0
Biomedical
Science 0 65 0
Nursing 157 75 11,775
Allied Health 75 75 5,625
Pharmacy 0 65 0
Total 648 67,320
Figure 4 Calculated NASF Grad/Residents Level Reported
Headcount
NASF per
Headcount Total NASF
Medical 266 30 7,980
Dental 15 120 1,800
Public Health 0 75 0
Biomedical
Science 54 55 2,970
Nursing 56 75 4,200
Allied Health 243 75 18,225
Pharmacy 198 55 10,890
Figure 5 Calculated NASF Post Doctoral Level
Reported Headcount
NASF per
Headcount Total NASF
Medical 0 30 0
Dental 64 30 1,920
Public Health 0 30 0
Biomedical Science 0 30 0
Nursing 0 30 0
Allied Health 0 30 0
Pharmacy 28 30 840
Total 92 2,760
Figure 6 Calculated NASF Fellow/Trainee Level Reported
Headcount
NASF per
Headcount Total NASF
Medical 80 30 2,400
Dental 11 30 330
Public Health 0 30 0
Biomedical Science 0 30 0
Nursing 0 30 0
Allied Health 0 30 0
Pharmacy 0 30 0
Total 91 2,730
The sum of the calculated NASF for the undergraduate, grad/residents, post doctoral, and fellow/trainee levels for Mountainside University Health Science Center:
Predicted Undergraduate Space = 67,320 NASF Predicted Grad/Residents Space + 46,065 NASF Predicted Post Doctoral Space + 2,760 NASF Predicted Fellow/Trainee Space + 2,730 NASF Total Predicted Teaching Space = 118,875 NASF
Predicted Research Space
Predicted research space is calculated two ways. The method that yields the greatest amount of space is used.
Method 1
The first method is based on the average of the last three years of reported research expenditures *. An inflated $1 million is determined from the consumer price index:
September 1991 Factor from Consumer Price Index = 137.2 September 2002 Factor from Consumer Price Index = 181.0 Inflation Rate = (181.0 - 137.2) ÷ 137.2 = 31.92% Divisor $1,000,000 x ($1,000,000 x 0.3192) = $1,319,242
* Research expenditures include the expenditures reported in the institution’s Annual Financial Report (AFR) plus any foundation or 501c3 and TEES pass-through expenditures reported on the Annual Research Expenditures Report to the Coordinating Board.
The average research expenditures figure is divided by the inflated $1 million amount. For every inflated $1 million in average research expenditures, 9,000 NASF allowed.
Average Research Expenditures 2002 $89,578,354 Average Research Expenditures 2001 + $80,214,654 Average Research Expenditures 2000 + $69,256,546 Average Research Expenditures 3 years = $239,049,554
÷ 3
= $79,683,185
Number of Inflated $1 million =
Average Research Expenditures 3 years $79,683,185 Inflated $1 million ÷ $ 1,319,242 = 60.40 Total NASF for Method 1
9,000 NASF x 60.40
= 543,607 NASF
Method 2
The second method is based on the number reported full time equivalent (FTE) faculty. For each FTE faculty, 250 NASF are allotted:
Total NASF for Method 2
857.48
x 250 NASF
= 214,370 NASF
In the case of Mountainside University Health Science Center, method 1 results in a higher predicted research space:
Predicted Office Space
Predicted office space is calculated two ways. The method that yields the greatest amount of space is used.
Method 1
The first method is based on the current E&G expenditures reported by the institution, minus any included auxiliary expenditures. For each $1 million (adjusted for inflation) reported, 1,600 NASF is allotted.
Reported Current Expenditures = $627,864,112 Minus Auxiliary Expenditures = $624,358 Total Current Expenditures = $627,239,754 Inflated $1 million ÷ $ 1,319,242 Number of Inflated $1 million = 475.45 Total NASF for Method 1 =
Number of Inflated $1 million = 475.45 NASF Allotment x 1,600 Total NASF Method 1 = 760,727
Method 2
The second method is dependent upon the FTE faculty reported by the institution. The staff FTE is estimated by multiplying the reported FTE faculty by the ratio of FTE staff to FTE faculty shown in Mountainside University Health Science Center’s Legislative Appropriations Request (LAR). FTE faculty is allowed 190 NASF each, and staff FTE is allowed 170 NASF.
Reported FTE Faculty 857.48 Factor (from LAR) x 2.50
Calculated Staff FTE 2,143.70 Figure 7
Calculated Office Space
FTE Type NASF per
FTE
Number of
FTEs Total NASF
FTE Faculty 190 857.48 162,921
FTE Staff 170 2,143.70 364,429
Total NASF for Method 2 527,350
If the method 1 result is greater than the method 2 results, then the method 1 result is the predicted value. If the method 2 result is greater than the method 1 result, then the results from method 1 and method 2 are averaged to obtain predicted office space. In the case of Mountainside University Health Science Center, method 1 yields the greatest result.
Predicted Clinical Space
Because a formula has not been developed to predict clinical, the actual clinical space reported in the Mountainside University Health Science Center’s facilities inventory, maintained by the Coordinating Board, is considered the predicted clinical space in this model.
Total Predicted Clinical Space = Total Actual Clinical Space = 82,597 NASF
Predicted Support Space
Predicted support space is calculated at nine percent of the sum of predicted space from the teaching, research, office, and clinical factors, plus a library factor. The library factor used is 50,000 NASF because Mountainside University Health Science Center is a multi-program institution.
Figure 8 Support Space
Predicted Space Total NASF
Teaching 118,875
Research 543,607
Office 760,727
Clinical 82,597
Total Other Predicted Space 1,505,806
Total Other Predicted Space 1,505,806 NASF Factor x 0.09
Subtotal 135,523 NASF
Library Factor = 50,000 NASF Total Predicted Support Space = 185,523 NASF
Multi-Campus Adjustment
Mountainside University Health Science Center has a recognized branch location in Tuscaloo, Texas. This location reports 50,000 E&G NASF. The multi-campus adjustment for the university is equal to 100 percent of the first 10,000 E&G NASF on that remote campus and 25 percent of all E&G NASF in excess of the first 10,000 NASF.
Reported E&G NASF 50,000 NASF 100 percent of first 10,000 NASF - 10,000 NASF Excess E&G NASF = 40,000 NASF 25 percent of Excess x 0.25
10,000 NASF
Total Multi-Campus Adjustment = 10,000 NASF + 10,000 NASF = 20,000 NASF
Mountainside University’s total predicted E&G NASF for Fall 2002 is: Figure 9
All Predicted Space
Predicted Space Total NASF
Teaching 118,875
Research 543,607
Office 760,727
Clinical 82,597
Support 185,523
Multi-Campus Adjustment 20,000
Total Predicted Space 1,711,329
The actual amount of E&G NASF currently reported by Mountainside University Health Science Center in its Facilities Inventory File maintained by the Coordinating Board is used in identifying the actual space. Below is a sample of the data report details.
Figure 10
Total Campus Space By Room Type
TYPE OF ROOM NASF E&G NASF
Classrooms:
110 Classroom 21,523 21,523
112 Classroom Service 3,364 3,364
SUBTOTAL 24,887 235,887
Class Laboratories:
210 Class Laboratory 25,984 25,984
215 Class Laboratory Service 4,278 4,278
220 Special Class Laboratory 1,821 1,821
225 Special Class Laboratory Service 115 115
230 Individual Study Laboratory 2,847 2,847
235 Individual Study Laboratory Service. 684 684
SUBTOTAL 35,729 35,729
Actual space is calculated for teaching, research, office, clinical, and support space, according to the room types associated with each factor. Mountainside University Health Science Center’s Facilities Inventory File is used to calculate actual space for the five factors.
Figure 11 Total Actual Space
Actual Space Total NASF Room Type
Teaching 98,976 100, 210-235, 500, 600
Research 468,335 250-255
Office 726,594 300
Clinical 82,597 800
Support 183,613 700, 400
Total Actual Space 1,560,115
The total actual space calculated must be adjusted to include E&G NASF that has been approved by the Coordinating Board, but is still under construction and, therefore, not included in the university’s Facilities Inventory File. Assume that Mountainside University Health Science Center has 157,864 E&G NASF approved but not online:
Actual Space in Facilities Inventory 1,560,115 NASF E&G Space Approved but Not On-Line + 57,864 NASF Total Actual E&G NASF = 1,617,979 NASF
To determine the surplus/deficit for Mountainside University Health Science Center, subtract the total predicted E&G NASF by the space model from the total actual E&G NASF:
Actual Space 1,617,979 NASF
Predicted Space - 1,711,329 NASF
Space Model Surplus/(Deficit) = ( 93,532) NASF Deficit
The result is considered a deficit because Mountainside University Health Science Center has less actual E&G NASF than the space model predicts it needs.