Tracking Darkports for Network Defense
David Whyte
Paul C. van Oorschot
Evangelos Kranakis
School of Computer Science
Carleton University, Ottawa, Canada
{
dlwhyte, paulv, kranakis
}
@scs.carleton.ca
Abstract
We exploit for defensive purposes the concept ofdarkports
– the unused ports on active systems. We are particularly in-terested in such ports which transition to become active (i.e. become trans-darkports). Darkports are identified by pas-sively observing and characterizing the connectivity behav-ior of internal hosts in a network as they respond to both le-gitimate connection attempts and scanning attempts. Dark-ports can be used to detect sophisticated scanning activity, enable fine-grained automated defense against automated malware attacks, and detect real-time changes in a network that may indicate a successful compromise. We show, in a direct comparison with Snort, that darkports offer a better scanning detection capability with fewer false positives and negatives. Our results also show that the network awareness gained by the use of darkports enables active response op-tions to be safely focused exclusively on those systems that directly threaten the network.
1
Introduction
The Internet is saturated with “nonproductive” network traffic that includes an estimated 25 billion global intrusion attempts per day [17, 33]. A precursor to most of these intru-sion attempts involves some form of reconnaissance activity to identify vulnerable systems or to determine the best point of access into a target network. Automated tools method-ically probe large blocks of Internet address space seeking vulnerable systems for recruitment into botnets [8, 19, 5, 2]. Large numbers of worm-infected systems randomly scan the Internet searching for susceptible systems to exploit. Per-haps most worrisome for a network operator is when a de-termined adversary directs specific scanning activity solely against their network searching for weaknesses to provide them with an entry vector. This type of reconnaissance is typically precise, deliberate, and focused.
A variety of complex heuristics have been successfully developed to detect scanning activity including the obser-vation of connection failures [11, 23], statistical measures [12, 25], abnormal network behaviors [28, 31, 6], and
con-nections to network darkspace [7, 14]. Current scanning de-tection algorithms focus largely on observing and classifying external network behavior (i.e. incoming network connection attempts) to detect scanning systems, although many types of sophisticated scanning techniques (e.g. botnet scanning, slow scanning) make it difficult or impossible to accurately determine root-cause origins of scanning activity.
In contrast, exposure maps [29] were proposed to detect scanning activity by passively observing legitimate traffic and attack scans (active scanning) directed at a target, and especially observing how internal hosts respond to exter-nal connection attempts. Preliminary investigation suggested they were suitable for detecting sophisticated scanning ac-tivity directed at an enterprise network, with greater interest in what an adversary is searching for, than in who is scan-ning the network. Successful connections to internal systems would be characterized in exposure maps to define the cur-rently active external interface to the network. In contrast to remote network security auditing techniques (e.g. Nmap [9]), exposure maps were asserted to facilitate an efficient, low-effort method to identify network vulnerabilities, with exposure status continually updated.
In this paper, we pursue these ideas and introduce dark-portswhich we define as unused ports (i.e. ports with no ser-vice responding) located on active hosts. Darkports provide a method to detect in real-time unauthorized service offerings from a host; these may indicate a successful compromise (e.g. a darkport suddenly starts to respond to a connection request).
First, we validate a preliminary assertion from the posi-tion paper [29] that exposure maps are very effective at de-tecting both simple and sophisticated TCP scanning activity directed at an enterprise network. In a direct comparison, the exposure map scanning detection capability was signifi-cantly better than the well-known Snort [22] (i.e. lower false negative and positive rates and the ability detect additional sophisticated scanning activity).
Secondly, we show that the identification of darkports during the construction of the exposure maps provides network-centric knowledge enabling fine-grained automated responses, e.g. to identify and deny specific systems network access when they are found to be performing scanning
activ-ity and thereafter trying to access a legitimate service in the network (common behavior for autorooters and worms [18]). This introduces the ability of selective automated response: a focused real-time active response option that limits the in-troduction of new access control rules to deny those scanning systems directly threatening network assets (i.e. those target-ing actual services offered by the network). We emphasize the subtle point, that systems that scan for services not of-fered by the network are simply identified (i.e. scan recorded) but otherwise ignored (e.g. no access control rule introduced to block the associated source IP address). This ability to initiate selective automated response reduces network con-figuration changes, complexity errors (e.g. by avoiding a dra-matic increase in router/firewall rules, and possibly leading to a self-imposed denial of service), and avoids unnecessary performance degradation of network security devices [4, 32]. Exposure maps and darkports differ from current scan-ning detection techniques as they rely on identifying the ser-vices offered by the network instead of tracking external con-nection events. The result is a scanning detection technique in which the utilized system detection state does not grow in proportion to the amount and fluctuation of external net-work traffic, but rather increases only with the number of services offered by the network, regardless of the size of the network and the external network activity. As an added benefit, maintaining information about internal hosts in the network instead of external host activity provides the neces-sary network-awareness to answer in real-time questions that should be asked after a scan is detected, such as “What infor-mation has been revealed as a result of the scan?”, and “Has the network behavior changed?”
The remainder of this paper is organized as follows. Sec-tion 2 refines the basic idea of exposure maps and darkports. Section 3 discusses how exposure maps can be used for scan-ning detection and automated response. Section 4 describes our implementation, the evaluation dataset, and methodol-ogy. Section 5 presents our evaluation results, including a comparison to Snort, and discussion of advanced scanning heuristics. Section 6 discusses the scalability and stability of exposure maps, including resilience to attacks. Section 7 presents limitations of the technique. Section 8 reviews re-lated work. We conclude in Section 9.
2
Exposure Maps and Darkports
We first describe the constituent components of exposure maps, how exposure maps are constructed and how they de-fine the darkports within the network. We focus on exposure maps relative to TCP ports.
COMPONENT DESCRIPTION. Exposure maps passively identify the services which have been confirmed (using an observed response during a training period) as being offered by the hosts of a given network. TCP packets with the SYN flag set start the three-way connection handshake. When a connection request is sent to a specific destination IP ad-dress/port, if a service is bound to that port and the port is
listening (open), the target host response is a packet with SYN ACK flag set, to start a session. Listening services, be-cause they respond to connection attempts or incoming pack-ets, leak information to scanners; they typically correspond to the active ports in a network and can be tracked in terms of what we define below as the HEM and the NEM. Once verified as permitted activity, the HEMs and NEM define the authorized access to individual hosts and the network.
More specifically, a host exposure map (HEM), associ-ated with a fixed IP address (host), is the set of ports ob-served responding to external connection attempts within a predefined period. For each active host i in the net-work, HEMi is a set of elements each of which begins with the IP address of i, followed by a port number j; there is such an element for eachportj that has responded to a connection attempt within a predefined period. In symbols, we can abbreviate this as HEMi =
n
IPi : portj
portj was observed responding o
.
The HEM is the externally visible interface of a host and can be considered to represent information leakage from the host that may reveal characteristics that can be used to ex-ploit it. Subsequent to the training period, as additional ports respond to external connection attempts, by definition the HEM is augmented by these ports.
Thenetwork exposure map(NEM) is defined as the col-lection of HEMs in a given networkN at any given point in time. The NEM defines how we expect the network to respond to external connection attempts. In symbols,
N EMN =Si∈NHEMi.We will often drop the subscript N inN EMN when the target network is implied by con-text. This also allows the natural definition ofN EMS for any subnetwork S ⊂ N, i.e. where S is a subset of the populated IP addresses in N. In an implementation, once the NEM has been built, the individual HEMs that comprise it can be checked for compliance with the network security policy. A NEM that complies with the network security pol-icy is called avetted NEM. We assume that any service (IP address/port pair) not compliant with the network security policy will, once detected, either be shutdown, or implicitly becomes part of the security policy. Thus, movement from a NEM to a vetted NEM is always possible.
We define the darkports on a given (real) host as those ports that have not been observed offering any services, and thus are not expected to accept external connection requests.1
The set of darkports for a host is the complement of its HEM. The set of darkports for a network is the union of the dark-ports on all its populated hosts. For example, a host with a HEM of only three TCP ports 22, 80, and 443 would have 216−3 TCP darkports i.e., all TCP ports excluding these three. If a darkport responds to an external connection at-tempt, it becomes atrans-darkport. This occurs either when
1Although a connection attempt to any port at a darkspace IP address (no
hosts assigned) will not accept a connection attempt, we restrict the term darkport to unused ports on a populated host address.
a host offers a new service (whether authorized or rogue), or a connection is made to a service that was not accessed during the training period. Either event causes the HEM to expand, and by definition the NEM expands and will differ from the vetted NEM. Once a trans-darkport is detected, this change can be checked against the network security policy so that the vetted NEM can be updated or any unauthorized service can be stopped.
EXPOSURE MAP CONSTRUCTION AND MAINTE
-NANCE. In summary, exposure maps are created by pas-sively observing a target network’s responses to incoming connection attempts (both legitimate connections and scan-ning attempts) over a traiscan-ning period. Every time a host re-sponds to an external TCP connection attempt, the IP address and port of the host offering the service is recorded. During the training period, each host in the network will reveal ser-vices that it offers; the corresponding ports are recorded in its HEM. After the training period, the vetted NEM can be used to identify all the active hosts on the network by their representative HEMs. Thereafter during ordinary network operation, passive observation of network packets continues, and for each connection attempt (i.e. each TCP SYN packet) compliance with the vetted NEM is tested in real-time. If the services offered by a host expand beyond the vetted NEM, an alert is generated to provide notification that trans-darkports have been detected; this indicates that either the vetted NEM needs to be updated, or some form of unauthorized activity is occurring.
In general, an important consideration for any technique that requires a training period is that any existing malicious activity (e.g. unauthorized services) may become part of the baseline. In our particular case, a HEM can be verified against an existing network security policy to detect any unauthorized service offerings by the host. The required length of the training period will vary with each network en-vironment depending on a number of factors including num-ber of active hosts, network security policy, permitted user applications, and frequency of service usage; see Section 6 for further discussion.
3
Applications of Exposure Maps and
Dark-ports
Exposure maps provide network-centric knowledge to en-able a variety of security applications including scanning de-tection and automated response which are discussed in the subsections below.2
3.1
Scanning Detection Using Exposure
Maps
MOTIVATION. Panjwani et al. estimate that 50% of at-tacks against systems are preceeded by some form of
net-2A third application for exposure maps, not presented in this paper due to
page limitations, is network discovery/asset classification and is discussed in [30].
work scanning activity [18]. Current scanning detection al-gorithms are generally designed to identify and classify sus-picious network activity as scanning activity using attribution to a particular source or sources. These algorithms are ef-fective at detecting wide-range reconnaissance activities that can be defined as the rapid scanning of large blocks of Inter-net addresses in the search for a specific service or vulner-ability. This is characteristic of autorooters [26] and worm propagation. Autorooters are composite tools that augment basic port scanning functionality by launching an attack as soon as an open port is located on a target system [1]; they are often used for the rapid enrollment of vulnerable systems into botnets of tens or hundreds of thousands of compro-mised systems [2]. Simple scanning worms propagate by indiscriminately probing the Internet as rapidly as possible to locate and infect vulnerable systems. Scans from auto-rooters and scanning worms can usually be attributed to the
truesource as the scans themselves are the first stage of the actual exploit attempt (e.g. a response, from the target, to a TCP SYN connection request will start the exploit in the same session).
In contrast to such indiscriminate scanning, skilled adver-saries will go to considerable lengths to mask their activities. Numerous sophisticated scanning techniques allow stealthy, focused scanning of a predetermined target (host and/or net-work); some of these make attribution to the scanning source impractical, rendering most current scanning detection tech-niques ineffective. The following techtech-niques belong to this category.
Slow scanningactivity against a network or host can be spread out over days or weeks. Over time, these scans will simply be lost in the networknoise, never exceeding scan-ning detection thresholds (i.e. being outside of the allocated detection system state).
Indirect scanningoccurs when an attacker uses one sys-tem (or syssys-tems) to scan a target and another syssys-tem to at-tack the target. This separation defeats attribution attempts. If the scanning activity from the scanning system is detected (e.g. blocked at a network router, or by system administrator intervention), the attacker simply uses another scanning sys-tem. A slightly more sophisticated variation usesthrow-away
scanning systems, i.e. previously compromised systems that have little value to an attacker other than being able to pro-vide a disposable platform. Any scanning activity traced back to the source, will be attributed to the owner of the com-promised system.
Distributed scanningoccurs when multiple systems act in unison using a divide and conquer strategy to scan a network or host of interest. Typically, one system will act as a central node and collect the scanning results from all participating systems. Distributing the scanning activity reduces the scan-ning footprint from any single system and thus reduces the likelihood of detection. An extreme version of distributed scanning involves an attacker using a botnet to scan a target in a coordinated manner resulting in very stealthy scans. A
relatively small botnet of a few thousand systems can be used to scan thousands of ports or hosts with only a single packet sent from each bot.
USE OF EXPOSURE MAPS FOR SCANNING DETEC
-TION. A vetted NEM is constructed as previously described. A connection attempt to any port-IP combination not present in the vetted NEM (i.e. a darkport or darkspace) is defined as anatomic scanevent. The 5-tuple (source IP, destination IP, destination port, protocol,3 timestamp) of any atomic scan
events is recorded for further analysis to secondary storage (hard disk) in the scanning activity log file. This approach requires only that the NEM information be maintained in sys-tem detection state (not the darkports or external connection requests), thus allowing detection of even very slow or dis-tributed scans, using only a small amount of main memory (see Section 6). In contrast to most scanning detection tech-niques that rely on the identification and correlation of exter-nal connection events to detect scans, we thus do not require strategies like reducing the detection time window in which connection events are tracked or timeouts, to accommodate network traffic fluctuations. Each atomic scan event can re-sult in one of three possible outcomes: (1) a probe directed against a darkspace address, (2) a probe against a darkport (note: such a host has a HEM), or (3) a probe sent to a host on an active port (an entry in the NEM).
Unlike most attribution-based scanning detection tech-niques, the scanning detection approach does not rely on identification of the scanning source to detect scans against a network. Thus, it can detect certain classes of sophisticated scanning techniques that make determining the root cause of the scanning activity impractical. However, this approach does not preclude us from the use of some form of attribu-tion post scan detection. Scanning worm propagation and autorooters are two prevalent examples of scanning activities where immediately denying the scanning source access to the network is both relevant and important. In these cases, a suc-cessful scan (i.e. one triggering a response from a host) typi-cally leads to an immediate attack from the scanning systems (see Section 5.2). Other post scan detection activities may in-clude the use of heuristics to classify atomic scan events into their respective scanning campaigns. An example of such a heuristic is given in Section 5.1.2 to identify and correlate the atomic scan events that comprise a distributed scan.
3.2
Automated Response using Exposure
Maps
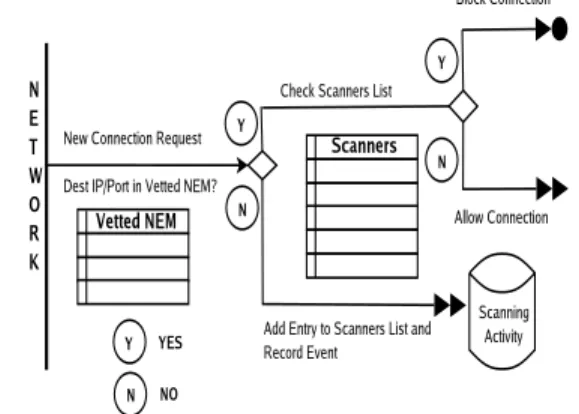
Exposure maps can be used in an automated response ap-plication as follows. When a new connection request is ob-served, the destination IP address and port are compared with the vetted NEM to determine if there is a match (see Figure 1). If there is no match to an entry in the NEM, the connec-tion is considered a scan and the source IP address is added as an element in ascannerslist (implemented e.g., using a
3Here, the protocol is TCP.
hash table). The 5-tuple (as in Section 3.1) that characterizes the connection attempt is then recorded as an atomic scan event in the scanning activity log file.
On the other hand if there is a match, the source IP is checked against the scanners list. If the source IP address matches an entry in the list, the 5-tuple that characterizes this connection attempt is recorded and connection should be dropped as this entity has previously undertaken reconnais-sance activity against the network. Our implementation is passive and only produces alerts that could enable some form of containment (e.g. ACL change), but does not actually do the latter; one option would be to integrate this application on a network device capable of performing containment such as a firewall. If the source IP address does not match an entry in the scanners list, the connection is permitted; the entity has no previous history of scanning activity and is connecting to a valid offered service.
Figure 1. Exposure Map Automated Response Logic.
The vetted NEM provides context to determine if an in-coming connection request is part of a scanning campaign and whether it will likely elicit a response. This information provides us with the precision to limit containment to (e.g. automatically block) only those scanning systems targeting services offered by the network (see Section 5.2). Contain-ment could alternately be performed using a number of net-work devices including firewalls, routers, or intrusion pre-vention systems using current scanning detection techniques. However, given the prevalence of scanning activity, frequent dynamic updates to these core network devices would be required in order to stop attacks in real-time, and would pose a number of challenges. For instance, Bobyshev et al. [4] have shown that the size of access control lists (ACLs) and the frequency of dynamic updates can significantly im-pact router CPU utilization and forwarding capabilities. Fur-thermore, the addition of multiple blocking rules may make ACLs and configuration files cumbersome and hard to vet by network personnel. In fact, frequent configuration changes to these network devices may actually decrease the overall se-curity posture of the network over time [32]. Our technique
allows a precise active response option to be taken exclu-sively against the most critical known threats to the network namely, those scanning systems targeting services offered by the network. Scanning systems trying to access services not offered by the network are noted (i.e. in the scanning activity log and the scanners list) but no action is needed or taken to block the connection.
Our analysis on a four-week network data set reveals a majority of scanning attempts directed against services not offered by the network. In the instances when the scanning was directed against a service offered by the network, an at-tack usually followed (see Table 4 and discussion in Section 5.2). Thus, our approach can significantly reduce the fre-quency and number of updates to the ACLs of network secu-rity devices while providing a measured and robust secusecu-rity response to real-time threats.
4
Evaluation: Dataset and Methodology
To evaluate how darkport observation can be applied, we developed and tested a software implementation. The soft-ware is installed on a commodity PC connected to the net-work by a 10/100 netnet-work interface card.CCSL DATASET. The CCSL network is a small univer-sity research network of 62 Internet reachable addresses con-nected to a university Internet accessible Class B network. All systems access the Internet through a firewall not per-mitting inbound connections unless initiated by an internal system. The CCSL dataset consists of four weeks (Septem-ber 2006) of network traffic collected in pcap files in front of the network firewall.
EVALUATION METHODOLOGY. We tested scanning de-tection and selected automated response capabilities on the CCSL network dataset; its network boundaries are known, allowing the NEM to be validated against a known network security policy. Additionally, having access to the full net-work traces, post scan detection analysis was possible to con-firm our experimental results when comparing actual scan-ning detection capability with Snort.
5
Evaluation Results
We tested the ability of exposure maps to perform scan-ning detection by performing a side-by-side comparison with Snort [22]. We then show how exposure maps can be used to detect sophisticated scanning activity and analyze the ef-fectiveness of using the exposure map scanning detection ca-pabilities to perform a real-time fine-grained automatic re-sponse to attacks.
5.1
Results: Scanning Detection
As discussed, the CCSL network dataset has a NEM com-prised of three HEMs (see Table 1). Two of these have three active ports; the third has one active port. The NEM thus has in total seven port/IP entries.
5.1.1 Scanning Detection Comparison with Snort We compared scanning detection results with Snort on the CCSL network dataset. We used a one-day training period to construct the NEM; it stabilized within the first 20 hours of network traffic. Snort’s preprocessor, sfPortscan [21], performs port scanning detection and allows operations on decoded packets before they are sent on to the Snort de-tection engine. sfPortscan provides the capability to detect TCP, UDP, and ICMP scanning; its sensitivity is set using the sense levelparameter (low, medium, or high). We fo-cused on TCP scans at sense level high. Three types of scans were detected by Snort in the CCSL dataset: 1)portscans
(single host scans multiple ports on a single host); 2) dis-tributed portscans (multiple hosts scan multiple ports on a single host); and 3)portsweeps (single host scans a single port on multiple hosts).
Table 1. Details about NEM for CCSL network.
Host TCP Ports Description 10.0.0.1 25, 631, 993 SMTP/IPP/IMAP 10.0.0.2 22, 80, 443 SSH/HTTP/SSL
10.0.0.3 22 SSH
The implementation detected 740 885 atomic TCP con-nection events (scans). The upper bound on the possible TCP scanning footprint isE = 62∗216. The actual scanning footprint we detected was A = 2 342 unique TCP port/IP combinations (including all seven entries in the NEM). With 26livesystems in the network, the number of darkports is
DP = 26∗216−7(the seven entries in the NEM are ex-cluded). To compare exposure maps with Snort, we applied Snort’s scan definitions to group the scans4we detected.
Snort detects scans by counting RST packets from each perceived target during a predetermined timeout interval [13]. Before declaring a scan, 5 events (i.e. RST packets) are required from a given target within a window. The sliding timeout window varies from 60 to 600 seconds by sensitivity level; at the highest level, an alert will be generated if the 5 events are observed within 600 seconds. Exposure maps do not employ a timeout window; the 5-tuple of atomic scan events are simply recorded and stored, whereafter a number of heuristics can be used to classify the scans detected (see Section 5.1.2). On the other hand, Snort does not require a training period.
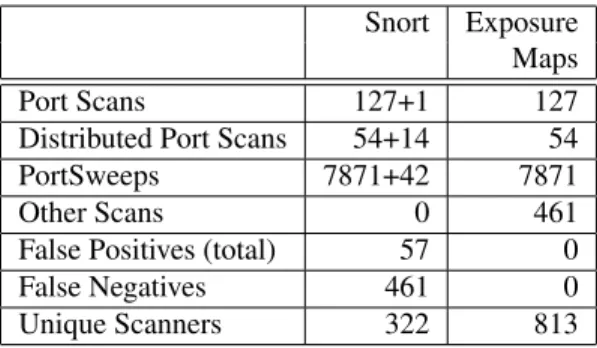
Table 2 summarizes the results. Snort detected a total of 8 052 scans initiated by 322 unique scanning systems, while the NEM detected 8 513 scans initiated by 813 unique scan-ning systems – all of the 8 052 scans detected by Snort, and an additional 461 scans initiated by 461 unique systems not identified by Snort. These are denoted other scans in Ta-ble 2; they encompass a variety of scanning techniques not
4Recall that a scan is defined by the NEM as an atomic TCP connection
Table 2. Scanning Detection Comparison. “+n” are scans that are false positives.
Snort Exposure Maps
Port Scans 127+1 127
Distributed Port Scans 54+14 54
PortSweeps 7871+42 7871
Other Scans 0 461
False Positives (total) 57 0
False Negatives 461 0
Unique Scanners 322 813
included in the sfPortscan scanning definitions, e.g., scans from a single host to a single port on a single host, slow scans with scan intervals of greater than 15 minutes, and a single host scanning multiple ports on multiple hosts. In the next section, we discuss in detail some heuristics used to de-tect distributed scans. 57 of the scans Snort dede-tected were false positives, the majority caused by legitimate RST pack-ets traversing the network. At the high sense level, a moder-ate amount of false positives are expected by normal network activity.
FALSENEGATIVES. We relied on the output of Snort to provide a baseline of the scanning activity within the dataset. As mentioned, we detected all scans identified by Snort, plus another 461 scans which Snort missed. Thus relative to Snort, for this dataset, our analysis for exposure maps (Ta-ble 2) revealed no false negatives.
Exposure maps (once vetted against the security policy) define the authorized access to the network from external sources. Connections attempts or scans outside these maps are considered a possible scans. Scans directed against a port/IP combination contained in the NEM are not consid-ered a scan but rather a connection attempt to a valid service; this might potentially then be a source of false negatives, and to claim otherwise (i.e. zero false negatives in general) would imply unknowable knowledge of the intent of the party re-questing the connection. For instance, a scan to port 443 of host 10.0.0.2 (see Table 1) in the CCSL network would not be recorded as a scan. In practice, although this specific event in a scanning campaign would not be detected, the overall scanning campaign would likely be detected using exposure maps for scan detection, as in most cases we would expect with high probability scans to occur against other hosts in the network not offering SSL (i.e. port 443 darkports). Scanning activity directed solely at the HTTP server would remain un-detected and be a source of false negatives. However, we expect that would be an actual attack rather than scanning activity; we do not claim that exposure maps can detect at-tacks (that are not preceded by scans).
FALSEPOSITIVES. Through user error or
misconfigura-tion, a connection attempt might be made to a host or ser-vice not offered by the network. In this instance, the intent of the connection attempt was not to scan some portion of the network, but rather it is simply a failed attempt to ac-cess a legitimate service. Regardless, this activity would be classified as a scan as an attempt was made to connect to a host/port pair not listed in the NEM. Again, given that there is no way to measure theintentof a connection attempt, we must classify these events as scans. While no false positives occurred in our CCSL dataset test (vs. 57 by Snort), we do not claim this in general. False positives will be generated whenever new legitimate services are introduced on the net-work or services are utilized which were not accessed during the training period (with identification as a trans-darkport un-til the service has been added to the vetted NEM). We expect trans-darkports to occur infrequently in tightly controlled en-terprise environments (e.g. in most government departments, financial, and health care).
5.1.2 Exposure Map Advanced Scanning Detection The scanning detection application identifies connection at-tempts to darkports within a network, with a 5-tuple ex-tracted from each atomic scan event and recorded in a log file, from which a number of heuristics can be developed to help classify and correlate these events into respective scan-ning campaigns. Here, we give a few examples of such heuristics to detect distributed scanning attempts.
Table 3. Three Detected Distributed Scans.
# of Scanned # of Hosts Follow-on Scanners Ports Scanned Attack
3 80 62 No
11 22 62 Yes
9 25, 53 62 Yes
Attackers may disperse the scanning activity among sev-eral sources to reduce the ovsev-erall scanning footprint in an effort to evade detection. To detect distributed scanning we propose classifying the scan events using the following cri-teria. 1)Scanning events and target destination ports. The number of scanning events per unique source IP address is determined, through analysis of the scanning log, over a con-figurable time interval (e.g. seconds, days). Similar amounts of scanning events from individual sources are grouped into clusters, which are then grouped by target destination ports. This final comparison reveals scanning systems that share the same scanning frequency (i.e. number of scan packets per unit time) and target service. We consider clusters of three or more scanning sources that target the same destination ports as a distributed scan; the number of systems in a cluster is configurable. 2)Source IP proximity and target destination ports. Scanning events are first sorted by unique source IP address. Scanning sources in the same one-quarter class C
subnet address range (e.g. /26) are grouped into a cluster. These clusters are then grouped by target destination ports. This reveals scanning systems sharing a similar contiguous address space (which could indicate a single entity0wnsthe scanning systems) and target (i.e. service). Again, we con-sider clusters of three or more scanning sources that target the same destination ports as a distributed scan.
Using these distributed scan heuristics, we detected three distributed scans in the CCSL network dataset (see Table 3). The first consisted of three source IPs targeting port 80 (HTTP). The scanning campaign was directed against the en-tire IP address range of the CCSL network (i.e. 62 systems). Once the scanning activity completed, no attacks were de-tected from these scanning sources. In fact, the only net-work activity exhibited by the systems participating in the distributed scanning campaign in the network trace was this specific distributed scan. The second distributed scan con-sisted of 11 systems targeting port 22 (SSH). The scan was also directed at the entire IP address range. Two of the hosts in the CCSL network offer services on port 22. In contrast to the first distributed scan, two of the scanning systems at-tacked both systems in the CCSL network that offered the service (c.f. Table 1). The third distributed scan detected con-sisted of 9 scanning systems targeting ports 53 (DNS) and 25 (SMTP). Two of the hosts in the network offer services on ports 25 and 53 respectively. Again, all hosts in the CCSL network were scanned with an attack immediately following on the system that offered port 25.
The distributed scanning detection heuristics described above illustrates how atomic scan events detected and recorded through exposure maps can be processed to detect sophisticated scanning activity. Other heuristics may be de-veloped that use the raw output from exposure maps to iden-tify other types of simple or sophisticated scanning activity (e.g. slow scanning).
5.2
Results: Active Response
Of the 813 scanners detected by the NEM in the CCSL dataset, 66 launched a total of 15 301 scans intermingled with attacks (unsuccessful) against the network, e.g., repeated at-tempts to relay mail through the mail server, and attempted logins to an SSH service. Mail relaying is prohibited by our mail server and the responses from the mail server to the at-tacking system indicate that no relaying occurred; analysis of the network traces also showed that the repeated SSH lo-gin attempts were all unsuccessful. Some of these systems scanned and attacked multiple services; this explains why the number of scan/attack entities in Table 4 is 121, while the actual number of unique IPs addresses was 66. With the exception of a single distributed scan (see Table 3), two char-acteristics of this activity occurred: (1) scanning was always the precursor to the actual attack, and (2) whenever a scan was directed against a service offered by the network (i.e. entry in the NEM), an attack followed once a response to the
scan was sent. This “scan then attack” activity fits the profile of autorooter or worm activity as previously described. The attacks were directed against four services offered by the net-work: SMTP, HTTP, SSL, and SSH.
Table 4. Scan Activity as Prelude to Attack.
NEM Entry Scan/Attack Scans or Entities Attacks 10.0.0.1:25 5 5 10.0.0.1:80 12 18 10.0.0.1:443 3 3 10.0.0.2:22 40 4 545 10.0.0.2:80 17 120 10.0.0.2:443 4 9 10.0.0.3:22 40 10 601
Without the knowledge of what services are offered and in active use by the network, in a standard perimeter defense all 813 scanning system source IPs over the four week period might need to be blocked at the router or firewall. The NEM provides up-to-date knowledge of the external interface of the network, indicating which minimal set of scanning sys-tems should be blocked. The NEM, coupled with the tech-nique of Section 3.2, would require that only 66 source IP addresses be denied access. This represents a 92% reduction in the number of dynamic updates to the network security ACLs.
6
Scalability and Stability of Exposure Maps
The size of exposure maps will be determined by numer-ous factors, the two most important being the number of dis-tinct hosts using the monitored link (or network), and the va-riety of applications those hosts use. The smaller the NEM, the less detection system state that needs to be maintained and the greater the scalability.The resource consumption of exposure maps includes sys-tem detection state and disk storage. The former refers to storage for the features extracted from network events that must be maintained at all times in main memory, provid-ing the wireline speed context to build and maintain the ex-posure maps as well as perform its various applications.5
A number of techniques are used by other network-based scanning detection approaches to limit their use of allocated system resources (CPU cycles, main memory, disk stor-age), e.g., connection timeouts, reduction of monitoring win-dows, fixed sized memory buffers and analyzing only certain events/protocols. The disk storage usage by exposure maps will depend on the detected scanning activity, increasing with the number of atomic scan events recorded. We now dis-cuss the system detection state and disk storage requirements
5Depletion of this finite resource, due to traffic volume or an intentional
DoS attack, can overload and defeat a detection system. Resilience to attack is discussed separately; see end of Section 6.
for the various applications of exposure maps, and computa-tional overhead.
SCANNINGDETECTION. For scanning detection with ex-posure maps, (1) the NEM must be constructed and main-tained, and (2) atomic scan events must be written to disk in the scanning activity log file. To understand the amount of detection system state for (1), consider the scenario of a net-work that has a NEM consisting of 10 000 entries (e.g. 500 active systems with an average of two open services per sys-tem). Each NEM entry contains six bytes: four for IP address and 2 for port. The total memory footprint for this NEM is 6∗10 000≈60Kbytes plus additional overhead for storage in a data structure (e.g. hash table, Bloom filter). Thus with an allocation of 100K or 200K in system detection state, we could perform scanning detection for this enterprise network. As new connection requests are received, a single lookup is performed on the NEM with the destination IP and port fields from the incoming request to determine if there is a match. The small amount of detection system state coupled with the minimal computational overhead required to determine if an incoming connection request matches a port/IP pair in the NEM (i.e. a single lookup) make this technique suitable for use at wire speed even in large enterprise environments.
To estimate the disk storage required for atomic scan events in the scanning event log file, we examined the results from the CCSL dataset. The unoptimized 5-tuple that repre-sents each atomic scan event, in character delimited ASCII, requires 44 bytes of storage. In contrast, to store the 780 885 atomic scan events detected in the CCSL dataset (4 week pe-riod) in the scanning activity log file would take 33Mbytes. Assuming the dataset represents an average level of scanning activity, an entire year of scanning activity for the CCSL net-work (≈391Mbytes) could be stored on a single CD or USB key.
AUTOMATEDRESPONSE. The automated response appli-cation is more expensive on system detection state than the scanning detection application due to the scanners list (recall Section 3.2). Each entry in the scanners list requires an ad-ditional 4 bytes (plus adad-ditional overhead for the hash table data structure). As connection requests are received, an addi-tional lookup is required (i.e. a check against both the NEM and the scanners list) to determine if the source IP address matches an entry in the scanners list. We detected 831 scan-ners in the CCSL dataset. With an additional allocation of less than 4K in system detection state, we could enable the automated response application. Over time, the scanners list will grow and would have to be managed (reduced) so that some predetermined limit of system detection state was not exceeded.
STABILITY. The stability of a NEM will vary greatly de-pending on the environment in which it is used. In an enter-prise network with a tight network security policy (e.g. gov-ernment, finance, health care), we would expect the NEM to stabilize quickly and thus be suitable for use in a scanning detection technique. As noted in Section 5.1.1, in our
uni-versity lab network the NEM stabilized in 20 hours. In other environments, service usage may vary by day of the week. In a network environment with an open network security pol-icy, the NEM may scale but perhaps stabilize more slowly as new hosts continually enter and leave the network (e.g. mobile users) or if new applications and services are con-tinually being added to client systems (e.g. P2P file sharing, open proxies).
DOS ATTACKS. A potentially serious attack on many scanning detection mechanisms is one that specifically tar-gets the detection system. In this context, we review the gen-eral construction and maintenance of basic exposure maps, plus the two main applications considered (scanning detec-tion, and automated response).
The construction and maintenance of basic exposure maps appears resilient to DoS attack. Incoming scans (bursts or sustained activity) do not increase an exposure map’s size (i.e. the number of HEM entries), which reflects only the number of services offered by the corresponding host. In-coming scans do need to be passively monitored, and con-nection requests are checked for matches against the NEM; however, the processing required for this is minimal, and we would expect any problems caused by volume of requests to cause other elements of a network to fail, e.g., having adverse affect on core network devices such as routers, or firewalls.
In the scanning detection application, secondary storage may be adversely affected by a large botnet DoS effort, be-cause detected scanning activity is recorded. For example, for a 100,000 system botnet executing a scanning campaign on a target network, three simultaneous scans by each bot would consume 13.2Mbytes in the scanning activity log. A sustained scanning effort by such a botnet would exhaust disk storage in most networks. However, such an attack would also likely cause core network devices to fail as noted above. The automated response application would experience the same impact on disk storage as the scanning detection appli-cation, plus system detection state would be consumed for source IP addresses added to the scanners list (as incom-ing connection requests to port/IP combinations outside the NEM result in new scanners list entries). A botnet of size 100,000 would consume 400Kbytes of (scanner list) system detection state; this state consumption does not increase af-ter the first scan from each source IP address. The most suc-cessful attack would likely be an attacker intentionally trying to exhaust scanner list state by spoofing source IP addresses during a large scanning campaign; this could adversely affect the platform executing the automated response application.
7
Limitations
NON-STANDARD PORTS. One of the strengths of the ex-posure map approach (and all discussed applications herein) is that it need only maintain very little state when operational. It need not inspect or decode the content of a TCP connec-tion, but only to observe external connection attempts (i.e. SYN packets) and record the IP address and source port if
there is a response (SYN-ACK). Thus, exposure maps use port numbers to identify the offered service. Although port numbers are a good indication of the type of service offered, users may choose to install services that use non-standard ports, e.g., an HTTP server using port 8080 or 8000 instead of port 80. Of course, use of non-standard ports may limit ac-cess as client systems must know the listening port number before accessing the service. In the case of creating a NEM for scanning detection, this issue is less of a concern; non-standard port usage should be detected after training when the NEM is vetted.
8
Related Work
The basic idea of exposure maps was introduced in a position paper [29], and developed as an example of an attribution-free scanning detection technique. Preliminary analysis revealed that it could detect both sophisticated and simple forms of network scanning activity. Although not tested, exposure maps were also proposed to detect changes in the services offered in a network which a network operator could verify as either authorized activity or an indication of a successful attack.
Activescanning6software, both open source and commer-cial, allows a security audit on a host or network [9, 27, 20]. Active scanning can be an integral part of a security audit to confirm that a host or network is in compliance with the net-work security policy. This activity however, can be costly in terms of human resources as it requires personnel to perform the required scanning activity (i.e. configure and operate the software) and interpret the results. Furthermore, active scan-ning provides only asnapshotin time of the active hosts and services in a network. Any new hosts or services offered by the network will only be detected at the next scheduled active scanning session.
Passive scanning techniques continuously monitor the hosts and services available in a network. Extrusion de-tection [3] refers to identification of unauthorized internal network activity by inspecting outbound network traffic; its ultimate goal is the identification of outgoing attack at-tempts from compromised internal systems in order to stop them from reaching their target. The passive asset detec-tion system (PADS) is signature-based passive detecdetec-tion soft-ware with a rules engine to identify hosts and services run-ning on a network by inspecting outbound network traffic [24]. It was created to provide supplementary information when performing active scanning of a network. Snort is an open source IDS that has scanning detection capability [22] through the use of the Snort preprocessor sfPortscan [21], by observing the RST packets within the network for a pretermined timeout window [13]. If five RST packets are de-tected from a suspected target within a configurable timeout window, an alert is generated.
6Active scanning involves injecting packets into the network in order to
elicit some observable response.
Both Leckie et al. [12] and SPICE [25] use probabilistic models to detect scanning activity. These approaches attempt to assign connection probabilities to internal hosts based on the observation within normal network traffic conditions as a benchmark. Scanning systems are detected as they are as-signed probabilities based on their current connection behav-ior which is measured and compared against the a prbehav-iori con-nection probabilities assigned to the internal hosts. Jung et al. [11] use their Threshold Random Walk algorithm to iden-tify scanning hosts, based on the observation that scanning systems will contact hosts and ports that are not available more often than benign systems.
Networkdarkspace is the unused IP addresses in a net-work and thus it should have no legitimate netnet-work activ-ity directed to it; connection attempts to IP addresses that have no hosts assigned to them is considered anomalous. A number of commercial products (e.g. [14, 7]) make use of network darkspace to detect malicious network activity. A
darknetis typically a large unused block of Internet-routable darkspace monitored for inbound packet activity. The larger the darknet, the better the darknet’s ability to detect scans and attacks during an observation period [16, 15]. A related but subtly different approach by Harrop et al. [10] usesgreynets, defined as regions of darknet address space that contain some active systems (i.e. some of the IP addresses in the darknet are assigned to active hosts). One of the motivations is that it is not possible for most enterprise network operators to have large regions of contiguous unused address space as-signed to them. However, it would be useful to have some means to detect anomalous events if dark space was avail-able on the network. Interspersing valid light (i.e. used) and dark (i.e. unused) addresses throughout a network will make it difficult for malware to avoid targeting greynet addresses and thus avoiding detection.
9
Concluding Remarks
We are the first to exploit the use of exposure maps and introduce the concept of darkports. In contrast to darknets and greynets [10, 7, 14], even densely populated enterprise networks can make use of exposure maps as they exist on live hosts. The overall exposure map technique is based on a simple premise that is efficient to implement – it requires the passive observation, recording, and maintenance of a list of the services offered by the hosts in a network. This simplicity translates into a very efficient use of system detection state and computational resources that easily scales for use in large enterprise and backbone networks.
Exposure maps can be used to perform scanning detection and enable fine-grained automated responses to deny access only to those scanning systems that directly threaten hosts in the network. During our evaluation, our implementation of the exposure map scanning detection application had fewer false positives and negatives in a direct side-by-side compar-ison with Snort. The exposure map scanning detection ap-proach, through the passive recording of all the services
of-fered by the network, provides anawarenessof active hosts, network darkspace, and darkports allowing network-centric context that increases the fidelity of scanning detection.
In an open network environment, the diversity of user population and permitted activity may make the enforcement of a single comprehensive network security policy impracti-cal. Furthermore, mobile or transient users may make deter-mining a stable baseline of all the services offered by hosts in the network infeasible. In such environments, exposure maps remain flexible enough to be configured to monitor a subset of the network to protect core network assets. A NEM could be composed of a single HEM (e.g. for host-based intrusion detection) or several HEMs (e.g. web server farm), allowing a network operator to focus on these mission critical servers. We have developed a full implementation of this approach in software that will be made available to the public.
References
[1] G. Bakos and V. Berk. Early detection of Internet worm ac-tivity by metering ICMP destination unreachable acac-tivity. In
SPIE Conference on Sensors, and Command, Control, Com-munications and Intelligence, April 2002.
[2] P. Barford and V. Yegneswaran. An Inside Look at Botnets.
Special Workshop on Malware Detection, Advances in Infor-mation Security, Springer Verlag, 2006.
[3] R. Bejtlich.Extrusion Detection, Security Monitoring for In-ternal Intrusions. Addison Wesley, first edition, 2006. [4] A. Bobyshev, P. DeMar, and D. Lamore. Effect of Dynamic
ACL (Access Control List) Loading on Performance of Cisco Routers. InComputing in High Energy Physics, Feb. 2006. [5] D. Dagon, C. Zou, and W. Lee. Modeling botnet propagation
using time zones. InProceedings of the 13th Annual Net-work and Distributed System Security Symposium (NDSS’06), February 2006.
[6] D. Ellis, J. Aiken, K. Attwood, and S. Tenaglia. A behavioral approach to worm detection. InProceedings of The Workshop on Rapid Malcode, 2003.
[7] Forescout Technologies Inc, Forescout product. http://www. forescout.com/wormscout.html.
[8] F. C. Freiling, T. Holz, and G. Wicherski. Botnet tracking: Exploring a root-cause methodology to prevent distributed denial-of-service attacks. InESORICS, pages 319–335, 2005. [9] Fyodor. Remote OS detection via TCP/IP stack
fingerprint-ing.Phrack, 54, December 1998.
[10] W. Harrop and G. Armitage. Greynets: a definition and eval-uation of sparsely populated darknets. InProceedings of the 2005 ACM SIGCOMM Workshop on Mining Network Data, pages 171–172, 2005.
[11] J. Jung, V. Paxson, A. Berger, and H. Balakrishman. Fast portscan detection using sequential hypothesis testing. In
IEEE Symposium on Security and Privacy, pages 211–225, 2004.
[12] C. Leckie and R. Kotagiri. A probabilistic approach to de-tecting network scans. InEighth IEEE Network Operations and Management Symposium (NOMS 2002), pages 359–372, 2002.
[13] B. Malmedal. Using netflows for slow portscan detection. Master’s thesis, Department of Computer Science and Media Technology, Gjovik University College, 2005.
[14] Mirage Networks. Mirage NAC. http://www.mirage net-works.com.
[15] D. Moore. Network telescopes: Tracking denial-of-service attacks and Internet worms around the globe. InLISA, 2003. [16] D. Moore, G. Voelker, and S. Savage. Inferring Internet
de-nial of service activity. In10th USENIX Security Symposium, 2001.
[17] R. Pang, V. Yegneswaran, P. Barford, V. Paxson, and L. Pe-terson. Characteristics of Internet background radiation. In
The Internet Measurement Conference IMC, 2004.
[18] S. Panjwani, S. Tan, K. Jarrin, and M. Cukier. An Experimen-tal Evaluation to Determine if Port Scans are Precursors to an Attack. InInternational Conference on Dependable Systems and Networks, July 2005.
[19] M. A. Rajab, J. Zarfoss, F. Monrose, and A. Terzis. A multi-faceted approach to understanding the botnet phenomenon. In
Internet Measurement Conference 2006 (IMC’06), Proceed-ings of, October 2006.
[20] RemoteScan Corporation, RemoteScan. http://www.remote-scan.com.
[21] D. Roelker, M. Norton, and J. Hewlett. sfPortscan. 2004. http:// cvs.snort.org/viewcvs.cgi/snort/doc/ README. sfportscan?rev=1.6.
[22] M. Roesch. Snort - lightweight intrusion detection for net-works. InLISA, 1999.
[23] S. Schechter, J. Jung, and A. Berger. Fast detection of scan-ning worm infections. In7th International Symposium on Re-cent Advances in Intrusion Detection (RAID 2004), Septem-ber 2004.
[24] M. Shelton. Passive Asset Detection System. (PADS). http://passive.sourceforge.net.
[25] S. Staniford, J. Hoagland, and J. McAlerney. Practical auto-mated detection of stealthy portscans. In7th ACM Conference on Computer and Communications Security, 2000.
[26] M. Tanase. Introduction to Autorooters: Crackers Working Smarter, not Harder. SecurityFocus. http://www. securityfo-cus.com/infocus/1619.
[27] Tenable Network Security, Inc., Nessus Vulnerability Scan-ner. http://www.nessus.org.
[28] D. Whyte, E. Kranakis, and P. van Oorschot. DNS-based de-tection of scanning worms in an enterprise network. InProc. of the 12th Annual Network and Distributed System Security Symposium, Feb. 2005.
[29] D. Whyte, P. van Oorschot, and E. Kranakis. Exposure Maps: Removing Reliance on Attribution during Scanning Detec-tion. Position paper (5 pages). InUSENIX HotSec 2006, Aug. 2006.
[30] D. Whyte, P. C. van Oorschot, and E. Kranakis. Tracking darkports for network defence. Technical report, School of Computer Science, Carleton University, TR-07-04, February 2007.
[31] M. Williamson. Throttling viruses: Restricting propagation to defeat malicious mobile code. In18th Annual Computer Security Applications Conference (ACSAC), 2002.
[32] A. Wool. A Quantitative Study of Firewall Configuration Er-rors. IEEE Computer, 37(6):62–67, 2004.
[33] V. Yegneswaran, P. Barford, and J. Ullrich. Intrusions: Global characteristics and prevalence. InSIGMETRICS, 2003.