Introductory Lecture
Monday 15 October 2001, 09.10–09.50
Significance of results in cancer imaging
Rodney H Reznek
Professor of Diagnostic Imaging, St Bartholomew’s Hospital, London, UK
Introduction
The effective management of patients with cancer
requires a multidisciplinary team approach with the diagnostic radiologist playing an extremely important role in that team. Increasingly it is realized that it is often the responsibility of the radiologist to understand and elucidate the significance of the findings of a test. Its significance lies not only in the clinical context but also in appreciating the impact that the test will have on the patient’s outcome. The latter requires a knowledge
of the cost-effectiveness of the use of any imaging
technique.
Evaluation of the effect of imaging
The issue of cost-effective imaging is complex and
beyond the scope of this text to discuss these issues in detail. However, recognition of the importance of proper evaluation of imaging techniques and of their use in clinical practice should improve both cost-effectiveness and efficacy of cancer imaging. These issues are discussed in an excellent review on measuring the effects of imaging by MacKenzie and Dickson[1]. These
authors point out that for diagnostic technologies it is not clear how a technology itself may directly affect the physical health of the patient, a factor which is particu-larly important in the case of diagnostic imaging devel-opment. A strategy has been devised, therefore, for evaluating the chain of events in which a trained observer makes an imaging report and the clinician combines the information in the report with clinical findings and other tests to make a diagnosis and choose appropriate therapy[2]. Fineberget al.[3]introduced four
levels to determine efficacy for diagnostic imaging which have subsequently been expanded to five levels:
Technical performance Diagnostic performance Diagnostic impact Therapeutic impact Impact on health
The positive effect of one level is determined by the level above and in turn determines the possibility of a positive result at the level below.
Technical performance relates to the ability to obtain high image quality in a reasonable time frame and whether these images permit correct interpretation.
Diagnostic performance is concerned with the ability of the technique to identify disease correctly. Thus, diagnostic performance is a measure of sensitivity, specificity, positive predictive value, negative predictive value and accuracy of the technique in a given clinical situation. This is a familiar method of evaluating
imag-ing in cancer and the major method by which different
imaging techniques are compared. Thus, the decision to use one imaging technique for staging cancer in prefer-ence to another is frequently based on information provided on diagnostic performance. While it is not possible to discuss the use of statistics in detail, it is important to recognize that studies should be designed to answer an hypothesis and that the help of a statisti-cian to design a study is likely to yield enormous benefits by reducing inappropriate methodology and bias[1].
Diagnostic impact is determined by the influence of the result of imaging on the clinician’s diagnostic confidence and by the ability of the new technology to replace older established methods. Displacement of older techniques by new imaging modalities is easy to demonstrate. For example, lymphangiography has now become obsolete in the staging of several cancers and myelography has also been superseded by magnetic resonance imaging (MRI) in the investigation of spinal cord compression[4,5].
Therapeutic impact reflects the alteration in manage-ment of a patient based on results of imaging. Dixon
et al.[6]recorded changes in the proposed treatment in
182 of 200 patients referred for MRI of the head and spine and, in the same group of patients, surgery was considered to be appropriate in 50 patients before MRI, but in only 28 patients following the results of the examination.
Impact on health is much more difficult, if not imposs-ible, to evaluate, particularly in oncology when diagnos-tic information may be in advance of the ability to treat the disease. However, progress in research in both diagnosis and treatment of cancer can only be made by furthering our understanding of the natural processes of therapeutic response and tumour regrowth. In this con-text, therefore, imaging has an important role in cancer
even if there is no demonstrable impact on health. Furthermore, it must be emphasized that although imaging itself cannot make an impact on outcome, the results of imaging may directly influence management allowing the clinician to make the optimum therapeutic decision. In this way diagnostic imaging through therapy does make an important contribution to final outcome.
Diagnostic performance
The diagnostic impact of imaging is most frequently made on the basis of studies designed to evaluate the ability of a technique to detect cancer accurately. In a review entitled ‘A guide to clinical epidemiology for
radiologists’, Goldin and Sayre[7] commented that the
poor understanding by physicians of the principles of statistical analysis weakens many investigations.
Their review discusses the different methods of
statistical analysis and basic concepts used to select the appropriate technique and to interpret the results, and is recommended as an excellent overview of the subject.
In the text of the chapters that follow, many refer-ences are made to sensitivity, specificity, positive predic-tive value, negapredic-tive predicpredic-tive value and accuracy. Advising on the judicious use of imaging studies in the staging and evaluation of malignancy requires a
thorough understanding of these basic tests of efficacy
and of the receiver–operator characteristics curve. These terms are defined below:
Sensitivity of an investigation is its ability to identify correctly those patients who have the disease or is the proportion of patients with the disease who have posi-tive test results. Sensitivity is also referred to as the true-positive rate of the investigation.
Sensitivity= true positives
true positives+false negatives
Specificity of an investigation is its ability to identify correctly those patients who do not have the disease or is the proportion of patients without disease who have negative test results.
Sensitivity= true positives
false positives+true negatives
The specificity is also called the false-positive rate of the test.
Accuracy of a test equals:
true positives+true negatives
true positives+true negatives+false positives+ false negatives
The accuracy of a test is of less value than the sensitivity and specificity because it lumps together positive and negative results.
The positive predictive value (PPV) of a test indicates the probability of whether the disease is actually present if the test is positive.
PPV= true positives
true positives+false negatives
Negative predictive value (NPV) indicates whether the disease is likely to be absent if the result is negative.
NPV= true negatives
true negatives+false positives
Thus NPV=1PPV.
The sensitivity and specificity of a test are generally independent of disease prevalence and are therefore often called the intrinsic operating characteristics of the test. On the other hand the PPV (and NPV) and accuracy are highly dependent on the prevalence of the disease and cannot be generalized over settings where the prevalence varies. For this reason, reports of sensi-tivity and specificity are more reliable than tests of PPV and accuracy, which are greatly influenced by regional variation of disease prevalence.
ROC
Other statistical methods such as receiver–operating characteristics (ROC) and Kappa statistics are com-monly used. Receiver–operating characteristics analysis is a plot of sensitivity vs. specificity for different cut-off
points of a particular test. By grading test results accord-ing to five categories (strongly positive, 5; weakly positive, 4; intermediate, 3; weakly negative, 2; strongly negative, 1) and plotting sensitivity against 1 specificity, the ROC curve is generated (Fig. 1).
Thus, as the criteria for calling a test result positive are made more stringent, specificity improves at the
0 0.2 0.4 0.6 0.8 1
0 0.2 0.4 0.6 0.8
1-Specificity (false-positive rate) Sensitivity 5
4 3
2
1
expense of sensitivity. Conversely, as the criteria are relaxed, sensitivity improves while specificity diminishes. The fundamental principle illustrated by the ROC curve is that there is an inherent limit to the diagnostic efficacy of a test. Once this limit has been reached, the interpreter can only improve sensitivity at the expense of specificity and vice versa. The ROC curve can be used to select the ‘best’ cut-offcriteria for positivity taking the positive predictive value and the relative costs (in terms of patient outcome) of false-positive and false-negative rest results into account. This has particular relevance in
the use of imaging in staging cancer where cut-off
criteria for positive results are constantly being decided. An example of this is on deciding on the upper limit of normal size for lymph nodes on cross-sectional imaging. An understanding of the ROC curve is therefore essential for all radiologists and oncologists interpreting the results of imaging in staging cancer. First, the curve displays explicitly the trade-offbetween sensitivity and specificity which results from varying the criterion for interpretation. Second, it provides a graphical summary of how well a test performs for each method of interpret-ation, allowing one to compare two or more tests without the necessity of having to stipulate the positive criterion for each test.
Kappa statistics are used to demonstrate the agreement between observers or different tests[7].
Interobserver agreement (Kappa)
Altman[8] describes well how to measure interobserver
agreement, using as data the assessments of 85 xero-mammograms by two radiologists (A and B) where the xeromammogram reports are given as one of four results: normal, benign disease, suspected cancer, cancer. A measure of agreement is required between radiolo-gist A and radioloradiolo-gist B rather than a test of association such as might be undertaken using the2test (Table 1).
As Altman points out, the simplest approach is to count how many exact agreements were observed be-tween A and B, which from Table 1 is 54/85=0.64. However, the disadvantages with this method of merely quoting a 64% measure of agreement is that it does not take into account where the agreements occurred and also the fact that one would expect a cetain amount of agreement between radiologist A and radiologist B
purely by chance, even if they were guessing their assessments.
The complete theory underpinning the kappa () test,
including the calculation of confidence intervals and including a weighted kappa test where all disagreements are not treated equally, has been given by Altman[8].
The expected frequencies along the diagonal of this table are given in Table 2 from which it is seen for these data that the number of agreements expected by chance is 26.2, which is 31% of the total, i.e. 26.2/85. What the kappa test gives is the answer to the question of how much better the radiologists were than 0.31.
The maximum agreement is 1.00 and the kappa statistic gives the radiologists’ agreement as a proportion of the possible scope for performing better than chance, which is 1.00–0.31.
=(0.640.31)/(1.000.31)=0.47
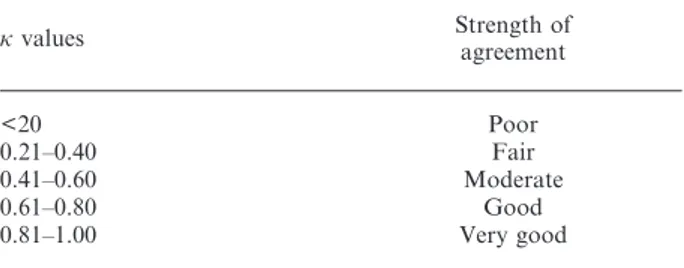
There are no absolute definitions for interpreting
but it has been suggested[8,10]that the guidelines in Table
3 can be followed, which in the example considered here means that there was moderate agreement between radiologist A and radiologist B.
Imaging strategies
The radiologist should undoubtedly be at the forefront of deciding which test should be used in evaluating patients with malignant disease and the appropriate and judicious use of radiological technology is a formidable challenge.
Based on the discussion above, it is clear that the proper use of imaging in cancer is a complex issue and at
Table 1 Interobserver agreement[8,9]
Radiologist A Radiologist B
Normal Benign Suspected cancer Cancer Total
Normal 21 12 0 0 33
Benign 4 17 1 0 22
Suspected cancer 3 9 15 2 29
Cancer 0 0 0 1 1
Total 28 38 16 2 85
Table 2 Calculation of the expected frequencies for the kappa test, after Altman[8]
Assessment Expected frequency
Normal 33(28/85)=10.87 Benign 22(38/85)=9.84 Suspected cancer 29(16/85)=5.46 Cancer 1(3/85)=0.04
best only guidelines on the appropriate use of imaging techniques can be provided in the chapters which follow. Nevertheless, there are certain important issues that need to be addressed in the choice of a particular imaging technique which relate not only to technical and diagnostic performance but also to the purpose of imaging in an individual patient.
Imaging may be requested to answer a specific clinical question in an individual patient on cancer therapy or it may be requested as a routine investigation at the time of presentation for diagnostic and staging purposes. In those tumours where established therapy is available imaging is required to measure therapeutic response. Imaging also has a major role in supporting clinical trials of new therapeutic agents and in this situation is used more frequently during the course of cancer than when used as a tool for management decisions. Imaging to support clinical trials is an increasingly important role for the radiologist with an interest in oncology. The very high accuracy of and reproducibility of cross-sectional imaging (particularly computed tomography (CT) and MRI) makes it extremely well suited to Phase II trials in which the oncologist is assessing the biological activity of new treatments. In Phase III trials, comparing the results of different treatments, survival is usually the final arbiter. If the size of the patient group is large enough, sophisticated staging is unnecessary as the stage will be randomized out. In practice, however, the groups tend to be small and one of the prognostic variables, namely the varying stage of the disease, can be removed from the study by achieving more accurate staging through imaging. Furthermore, in patients with ad-vanced disease, where there is no obvious difference in survival and the end-point of the study becomes the response rate rather than survival, accurate imaging becomes an extremely valuable research tool.
An important impact of the use of sophisticated techniques to stage patients with cancer is the apparent continuous improvement in cancer survival rates reported over the last 25 years. Although this is quickly and easily attributable to earlier diagnosis and new and more effective treatments, the effect of more accurate staging may to some extent explain these improved results[11–13]. Feinsteinet al.[11]found that a 1977 cohort
of patients who had undergone lung cancer treatment survived significantly longer in each of three TNM
subcategories than a cohort managed in the 1950s and 1960s; a finding which is not surprising. When, however, he staged the recent cohort on clinical grounds only, without the benefit of ultrasonography, CT and nuclear medicine, these survival differences disappeared. It was apparent that the improved survival rates were mainly an artefact of better staging; patients in the lower stages with clinically occult (usually nodal) disease were being identified with better imaging and were being placed in a more advanced stage (‘stage migration’). Better staging led to benefit to all; in the lower stages, patients with occult metastases would be removed with benefit to those stages; in the higher stages, those patients with a lower tumour burden would be added to those with a higher one, with improvement in survival rates. Thus while individual prognosis did not change overall, sur-vival in each stage improved. The stage migration phenomenon occurs when comparisons are made between groups of patients who have undergone less or more thorough staging techniques and as such is likely to occur when the comparisons are made over a time period which spans the introduction of new tech-nology. It has been noted with numerous tumours including metastatic germ cell tumours[6,12] and gastric
cancers[13].
Imaging may be used for surveillance of patients with no clinical evidence or imaging evidence of disease in order to identify relapse as early as possible. In patients with clinical suspicion of relapse, again imaging is required to detect recurrence in the previously treated patient. The choice of an imaging technique in this clinical setting depends on the ability of the different imaging methods, not only to identify an abnormality, but also to characterize a lesion and distinguish benign from malignant pathology in the presence of previously treated normal tissues which may have been damaged by therapy.
In all the situations outlined above, the imaging modality chosen will depend upon local factors which include the availability of equipment, the expertise of medical and ancillary personnel and the demands made on imaging by the workload of the department.
Best practice dictates that the imaging technique which provides the best diagnostic performance will be used in all circumstances, but this is not always possible. It is, however, incumbent on the radiologist to adhere to good practice using his knowledge of diagnostic imaging and of cancer to provide the optimum service within the local environment. Good practice requires close collaboration between radiologists and clinicians to define protocols. The issues to be addressed include:
The choice of a technique for different tumour types
For a given imaging technique examination protocols should be agreed for every tumour
The timing of imaging in relation to treatment should be agreed
Follow-up studies should also be performed to an agreed protocol
Finally, the impact of diagnostic imaging in cancer is enormously improved by working in a multidisciplinary
Table 3 Guidelines for the interpreting the stat-istic[8,10]
values Strength ofagreement
<20 Poor
0.21–0.40 Fair
0.41–0.60 Moderate
0.61–0.80 Good
team with regular clinicoradiological review of imaging studies in relation to management decisions.
References
[1] MacKenzie R, Dixon AK. Review: measuring the effects of imaging: an evaluation framework. Clin Radiol 1995; 50: 513–8.
[2] Donabedian A. Evaluating the quality of medical care. Millbank Memorial Fund Quarterly 1966; 44: 166–206. [3] Fineberg HV, Wittenberg J, Ferrucci JT. The clinical value of
body computed tomography over time and technologic change. Am J Roentgenol 1983; 141: 1067–72.
[4] Libson E, Polliack A, Bloom RA. Value of lymphangiography in the staging of Hodgkin lymphoma. Radiology 1994; 193: 757–9.
[5] Williams MP, Cherryman GR, Husband JES. Magnetic resonance imaging in suspected metastatic spinal cord compression. Clin Radiol 1989; 40: 286–90.
[6] Dixon AK, Southern JP, Teale Aet al. Magnetic resonance imaging for the head and spine: effective for the clinician or the patient? Br Med J 1991; 302: 78–82.
[7] Goldin J, Sayre JW. Review: a guide to clinical epidemiology for radiologists: part II statistical analysis. Clin Radiol 1996; 51: 317–24.
[8] Altman DG. Practical Statistics for Medical Research. London: Chapman & Hall, 1991: 404–9.
[9] Boyd NF, Wolfson C, Moskowitz M. Observer variation in the interpretation of xeromammograms. J Natl Cancer Inst 1982; 68: 357–63.
[10] Landis JR, Koch GG. The measurement of observer agreement for categorical data. Biometrics 1977; 33: 159–74. [11] Feinstein AR, Sosin DM, Wells CK. The Will Rogers
phenomenon. Stage migration and new diagnostic techniques as a source of misleading statistics for survival in cancer. New Engl J Med 1985; 312: 1604–8.
[12] Bosi GJ, Geller NL, Chan EY. Stage migration and the increasing proportion of complete responders in patients with advanced germ cell tumours. Cancer Res 1988; 48: 3524–7. [13] Bunt AMG, Hermans J, Smit VTHBM, van de Velde CJH,
Fleuren GJ, Bruijn JA. Surgical/pathologic stage migration confounds comparisons of gastric cancer survival rates between Japan and Western Countries. J Clin Oncol 1955; 13: 19–25.

![Table 1 Interobserver agreement [8,9]](https://thumb-us.123doks.com/thumbv2/123dok_us/7880415.2100474/3.892.73.575.195.340/table-interobserver-agreement.webp)