R E S E A R C H
Open Access
Cardio-metabolic and immunological
impacts of extra virgin olive oil
consumption in overweight and obese
older adults: a randomized controlled trial
Mitra Rozati
1,2, Junaidah Barnett
1, Dayong Wu
1, Garry Handelman
2, Edward Saltzman
1, Thomas Wilson
2, Lijun Li
1,
Junpeng Wang
1, Ascensión Marcos
3, José M. Ordovás
1, Yu-Chi Lee
1, Mohsen Meydani
1and
Simin Nikbin Meydani
1*Abstract
Background:Both aging and obesity are related to dysregulated immune function, which may be responsible for increased risk of infection and also chronic non-infectious diseases. Dietary lipids have been shown to impact immune and inflammatory responses and cardio-metabolic risk factors. No information on the impact of olive oil on immune responses of overweight and obese older adults is available.
Objective:We aimed to determine the effect of replacing oils used in a typical American diet with extra virgin olive oil for 3 months on immune responses and cardio-metabolic risk factors in overweight and obese older adults.
Methods:This was a randomized, single-blinded and placebo-controlled trial in 41 overweight or obese participants (aged≥65) who consumed a typical American diet. Participants in the control (CON,n= 21) group were provided with a mixture of corn, soybean oil and butter, and those in the olive oil (OO,n= 20) group, with extra virgin olive oil, to replace substitutable oils in their diet. At baseline and 3 months, we measured blood pressure, biochemical and immunological parameters using fasting blood, and delayed-type hypersensitivity (DTH) skin response.
Results:Compared to the CON group, the OO group showed decreased systolic blood pressure (P< 0.05), a strong trend toward increased plasma HDL-C concentrations (P= 0.06), and increased anti-CD3/anti-CD28 -stimulated T cell proliferation (P< 0.05). No differences were found in T cell phenotype, cytokine production, and DTH response between the two groups.
Conclusions:Our results indicate that substitution of oils used in a typical American diet with extra virgin olive oil in overweight and obese older adults may have cardio-metabolic and immunological health benefits. This trial was registered at clinicaltrials.gov as NCT01903304.
Keywords:Olive oil, Immune response, Cardio-metabolic, Aging, Obesity
* Correspondence:[email protected]
1
Jean Mayer USDA Human Nutrition Research Center on Aging at Tufts University, 711 Washington Street, Boston, MA 02111, USA
Full list of author information is available at the end of the article
Introduction
Olive oil, which is part of the Mediterranean diet (Med-diet), has been shown to have several health benefits including a capacity to lower the risk of cardiovascular disease (CVD), stroke, and certain forms of cancer. The health benefits of olive oil have been linked mostly to its high content of oleic acid and phenolic compounds [1–4].
It is well known that aging is associated with dysregu-lated immune function and increased susceptibility to infectious diseases as well as higher incidence of non-infectious diseases such as CVD, dementia, arthritis, diabetes, cancer, and autoimmune disorders [5, 6]. Changes in both cell-mediated immunity and inflam-matory responses have been reported with aging. While age-associated changes are observed in almost all as-pects of the immune system, a decline in T cell function is believed to be the central defect in immunosenes-cence [7–10]. Age-related decline in ex vivo antigen and mitogen-stimulated T cell proliferation [11, 12] as well as in vivo T cell responses to immunization [13], and delayed-type hypersensitivity (DTH) skin response [14] have been reported across all species. The decline in T cell-mediated function is attributed somewhat to phenotypic changes in lymphocytes [15–17], decline in IL-2 production [18] and increase in production of T cell suppressive eicosanoids [19, 20].
On the other hand, aging is associated with chronic in-flammation as indicated by higher levels of inflammatory markers such as IL-6 and tumor necrosis factor-alpha (TNF-α), both of which may cause substantial tissue damage and dysfunction [5, 21, 22] and are believed to be key players in the pathogenesis of several diseases in-cluding CVD, rheumatoid arthritis (RA), neurodegenera-tive diseases, and cancer [23, 24].
Similar to aging, obesity is associated with low-grade, chronic inflammation, which is thought to contribute to the development of several inflammatory diseases [25, 26]. Obesity is also shown to impair T cell function and resistance to infection [26, 27]. Evidence in both humans and mice has shown that metabolic tissues in the obese (including adipose, liver, muscle, pancreas and brain) compared to those in lean controls secrete more inflammatory mediators/markers such as TNF-α, IL-6 and C reactive protein [28–32]. Studies have shown that increased adherence to the Med-diet enriched by extra virgin olive oil (EVOO) is associated with lower incidence of obesity [33, 34], hypertension [35] and hyperlipidemia [36].
The limited studies conducted on the immuno-modulatory effect of olive oil have shown inconsistent results [37, 38]. Additionally, the majority of these stud-ies have reported the anti-inflammatory and antioxidant effects of olive oil [39–42] with little information avail-able on the impact of olive oil on T cell-mediated
immune response in humans. Moreover, few studies have evaluated olive oil’s effect on both T cell-mediated function and inflammatory responses, and none of them have been conducted in overweight or obese older adults. Given that both obesity and aging are associated with increased inflammation and impaired T cell function, it is critical to determine the health benefits of olive oil in this particular population. Further, all previous studies fo-cusing on immune function have used refined olive oil ra-ther than EVOO, which contains phenolic compounds that have antioxidant properties not found in refined olive oil. These components have been suggested to be key fac-tors contributing to EVOO’s beneficial effects [1–3].
There is growing evidence that olive oil has some beneficial effects on CVD through different mechanisms including effects on lipid profile, blood pressure, inflam-mation, and arterial wall function [35, 36, 43–45]; but to our knowledge, none of those studies have been con-ducted in overweight or obese older adults. Thus, the current study was conducted to evaluate whether substi-tuting oils in a typical American diet with EVOO would improve T cell-mediated immune function and inflam-matory responses as well as factors related to cardio-metabolic status in overweight or obese older adults such as lipid profile and blood pressure.
Subjects and methods Participants
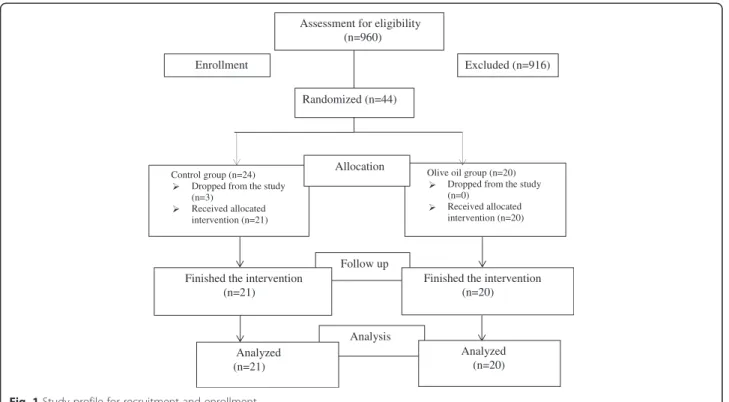
Participants for this study were recruited by the Recruit-ment and Volunteer Services DepartRecruit-ment at the Jean Mayer USDA Human Nutrition Research Center on Aging (HNRCA) at Tufts University by inviting individ-uals within the specified age and body mass index (BMI) ranges in the HNRCA recruitment database, advertising in various local newspapers, in media sources, at the Tufts University Boston campus, Tufts Medical Center clinics, and on public bulletin boards in the downtown Boston area and neighboring towns. A total of 960 re-sponses were received. After telephone pre-screening, 799 individuals were considered ineligible because they either were no longer interested or did not meet study criteria. Following laboratory screenings, an assessment of medical history and a physical examination per-formed by a study nurse practitioner in the Metabolic Research Unit (MRU) at the HNRCA, an additional 117 of the remaining 161 individuals were found ineligible to participate.
CVD, liver disease, renal disease, diabetes, hyperten-sion, asthma, a history of splenectomy, were on dialysis or had any conditions associated with maldigestion or malabsorption including pancreatitis, celiac disease, gastric bypass or surgery for weight loss. Additionally, they were excluded if they were diagnosed with or were in treatment for psychosis and had obtained a BDI-II (Beck Depression Inventory-II) score≥20 or MMSE (Mini Mental State Examination) score≤25. Finally, they were excluded if they consumed more than 2 glasses of alcoholic drinks/day or had a history of smok-ing; further, they were excluded if any of the following oc-curred prior to study blood draws and skin tests: they had used nicotine within 6 months, were on antibiotics or had infections within 2 weeks, received flu vaccination within 3 weeks and tetanus immunization within 6 weeks.
Subjects of both genders were included if they were 65 y or older, had a BMI between 25–35 kg/m2, were will-ing to stop uswill-ing dietary supplements (except vitamin D and calcium) including multivitamin and minerals, fish oil, olive oil, and canola oil, 30 days before and during the study. Additionally, they were consuming and were required to continue consuming a typical American diet. The diet composition of the typical American diet has been determined by National Health and Nutrition Examination Survey (NHANES) as follows: carbohy-drates make up 50 % of daily energy requirements and include refined and processed grain products, fruits and vegetables and dairy products. Protein constitutes 15 % of daily energy requirements provided from sources such as meats and dairy products. Fat makes up 35 % of daily energy requirements, which represents 86 g of fat/day in a 2200 calorie diet. The fatty acid composition includes polyunsaturated fatty acids (PUFA), saturated fatty acid (SFA), and monounsaturated fatty acids (MUFA) at the ratio of 1:2:2. Dietary fiber and cholesterol intake are 12–14 g/day and≥400 mg/day, respectively [46, 47].
The forty-four subjects who were eligible to participate in the study signed the informed consent form, and 41 participants completed the study. Three (3) participants dropped out of the study: one was prescribed an iron supplement, one refused to have DTH skin test implant, and one had an accident unrelated to the study (Fig. 1).
Study design
We conducted a randomized, single-blinded, and placebo-controlled trial in overweight and obese older adults between 2011 and 2013 to determine the impact of replacing substitutable oils in a typical American diet with extra virgin olive oil. The study protocol and con-sent form were approved by the Tufts University/Tufts Medical Center Institutional Review Board. Eligible par-ticipants were randomized into either the CON or OO group in a 1:1 ratio.
The coding for the CON and treatment groups was assigned by the study statistician, who had no contact with subjects and had no role in data collection. The study oils (CON or OO) were labeled with the subjects’ names by the study dietitian, who also held the randomization code; all other investigators and the study nurses were blinded to this information. Participants, however, could not be blinded since they might recognize the smell and taste of EVOO.
The oils were provided in a bottle or as a spread. To minimize bias, both study oils were provided to partici-pants in the same type of bottle (oil) and the spread in the same type of container (spread). The CON oil was a blend of 10 % corn oil and 90 % soybean oil, and the CON spread was butter; these were defined as the oils con-sumed in a typical American diet [48]. The EVOO used for the study was provided by the Deoleo Company in Cordoba, Spain. Prior to screening, participants were asked to taste the oil/spread and to confirm they were willing to consume these oils while on the study (Table 1 shows the composition of fatty acids in both the CON and OO groups).
Participants consumed the assigned oils for 3 months. During the study, both groups continued their typical American diet with only one change: they replaced sub-stitutable oils in their diet (cooking oil, spread, and oils in dressings) with the study oil/spread provided to them. The study oils were distributed to the participants by the dietitians at the MRU of the HNRCA.
Baseline and month 3 study visits
Subjects were asked to come to the center for 4 consecu-tive days at the beginning (baseline) of the study and 3 months after enrollment. On day 1, vital signs (temperature, blood pressure, pulse, and respiratory rate), weight, height, and waist and hip circumferences were measured. Subjects were asked to discontinue anti-inflammatory medicines including aspirin or anti-histamines 72-h before each blood collection until 48-h after DTH implantation. On day one, blood was collected after a 12-h fast for blood chemistry, lipid profile, complete blood count (CBC) differential, fatty acids, and immunological tests described below. On day 2, a second blood sample was drawn for repeated ex vivo immune tests. Then, three (3) recall antigens (detailed below) and saline were implanted in the forearm of each subject for the DTH skin test, as anin vivotest of cell-mediated im-mune function [49]. On day 3 and 4, participants visited the MRU for an evaluation of their DTH skin response at 24-h and 48-h post-administration, respectively.
Diet intervention visits and assessment of dietary intake
with study oils and spreads. Dietary counseling was pro-vided every two weeks or more often as needed to en-sure that all subjects were following the instructions, were using the right oil and adhering to the appropriate diet. Compliance with consuming study oils was evalu-ated by the dietitians using a“checklist of study oils con-sumed per week” as indicated by participants when they returned used containers for a new supply of study oils
and spreads as well as by plasma fatty acid analysis (see below). To assess dietary intake, participants completed a 3-day dietary record (3DDR) at both baseline and month 3, which were reviewed and analyzed by a dietitian using the Minnesota Nutrient Data System (Nutrition Coordin-ating Center, University of Minnesota, Minneapolis, MN), version 2010.
CBC differential, blood chemistry, and blood lipid profile
Fasting blood was used for evaluation of CBC-differential [50], blood glucose [51], and blood lipid profile [triglycer-ides [52], total cholesterol [53], low density lipoprotein cholesterol (LDL-C), and high density lipoprotein choles-terol (HDL-C) [54] at baseline and month 3 by the Nutri-tional Evaluation Laboratory (NEL) at the HNRCA.
Fatty acid analysis
Compliance of study oil intake was determined by meas-uring fatty acid composition in the plasma of partici-pants by gas chromatography (GC) method [55].
Immunological assessment
Lymphocyte phenotype To determine lymphocyte phenotype, whole blood surface staining of different white blood cell markers was done using fluorescent antibodies (all from eBioscience, San Diego, CA) for total T cells (CD3+), helper T cells (CD4+), cytotoxic T cells (CD8+), naïve and memory subpopulations within CD4 and CD8 T cells (determined by their combined Table 1Composition of fatty acids in control and olive oils/
spreads
Fatty acids Olive oil Control oil Butter (control spread)
%
C14:0 0.4 0.1 11.5
C16:0 13.5 10.9 36.2
C16:1 1.3 0 0
C18:0 2.4 4.4 15.1
C18:1n9 68.3 22.7 30.7
C18:1n7 3.2 1.4 1.9
C18:2n6 10 54.2 4.1
C18:3n6 0 0 0
C18:3n3 0.7 6.3 0.5
C20:1n9 0.3 0 0
C20:4n6 0 0 0
C20:5n3 0 0 0
C22:5n6 0 0 0
Fatty acids (%) in control and olive oil samples analyzed by gas chromatography as described in method section
Excluded (n=916) Assessment for eligibility
(n=960)
Randomized (n=44) Enrollment
Control group (n=24) Dropped from the study (n=3)
Received allocated intervention (n=21)
Olive oil group (n=20) Dropped from the study (n=0)
Received allocated intervention (n=20) Allocation
Follow up Finished the intervention
(n=21)
Finished the intervention (n=20)
Analysis Analyzed
(n=21)
Analyzed (n=20)
expression of CD45RA, CD45RO, and CD62L), B cells (CD19+), and natural killer T cells (CD3 + NK+). Isotype staining was also done as the negative control. Flow cy-tometric measurement was conducted using an Accuri C6 flow cytometer (BD Biosciences, San Jose, CA). Data were analyzed using Flowjo 7.6 software (TreeStar Inc., Ashland, OR).
Lymphocyte proliferation T cell proliferation was mea-sured by [3H]-thymidine incorporation after stimulation of whole blood culture with different stimuli described below. To account for the day-to-day variability in ex
vivo immunological measurements, blood was collected two times (day 1 and day 2), and the average of the two measurements was used in statistical analysis. Heparin-ized blood was diluted 1:10 (final v: v) with RPMI 1640 supplemented with 100 kU/L penicillin, 100 mg/L streptomycin, 2 mmol/L L-glutamine, and 25 mmol/L HEPES (Gibco Laboratories, Grand Island, NY). Diluted blood was stimulated with T cell mitogen concanavalin A (Con A, Sigma, St. Louis, MO) at 5, 25, and 50 mg/L, or immobilized anti-CD3 (eBioscience) at 1, 5, and 10 mg/L and soluble anti-CD28 (1 mg/L), and incubated in 96-well round-bottom cell culture plates for 72-h. Cultures were pulsed with 0.5 μCi [3H]-thymidine dur-ing the last 4-h of incubation. Cells were harvested onto glass fiber mats using a Perkin Elmer cell harvester (model No. C961961, Waltham, MA). Cell proliferation was quantified as the amount of [3H]-thymidine incorp-oration into DNA, which is determined by liquid scintil-lation counting in a Perkin Elmer counter (model No. 2450–0060). T cell proliferation is expressed as count per minute (cpm).
Cytokine and PGE2 production Heparinized whole blood was diluted 1:4 (final v: v) with RPMI 1640. To de-termine T cell cytokine IL-2 and IFN-γ production, di-luted whole blood was stimulated with Con A (25 mg/L) or immobilized CD3 (5 mg/L) and soluble anti-CD28 (1 mg/L) in 24-well plate for 48-h. In addition, we also assessed the impact of olive oil on inflammatory re-sponse. Diluted whole blood was stimulated with lipo-polysaccharide (LPS) (1 mg/L) in 24-well plates for 24-h to measure the production of pro-inflammatory cyto-kines IL-6 and TNF-αas well as lipid inflammatory me-diator PGE2using ELISA.
For all cytokines including IL-2, IFN-γ, IL-6, and TNF-α, reagents were from BD Bioscience. For PGE2, high sensitivity enzyme immune assay (EIA) kit (ENZO Life Science Inc, PA, USA) was used. Plates were read in a micro-plate reader (BioTek, model No. EL808) and an-alyzed by Gene5 software.
Delayed-type hypersensitivity (DTH) skin test Three recall skin test antigens, Candida Albicans (Candin, Allermed Laboratories Inc, San Diego, CA), Tetanus Toxoid (Toxoid Adsorbed, Sanofi Pasture, CA), and Tri-chophyton Mentagrophytes (TriTri-chophyton, Allermed Laboratories Inc, San Diego, CA) were injected intrader-mally at separate sites on the volar surface of the fore-arm. Saline (0.9 %) was used as the negative control. Candida, Trichophyton and saline were injected in a standard volume of 0.1 ml, and tetanus toxoid was injected in a volume of 0.025 ml. Skin tests were read 24 and 48-h after antigens were applied; a test was consid-ered positive if the skin induration was≥5 mm.
Statistical analysis
The demographic characteristics and other variables of interest of the participants in the CON versus OO group were compared at baseline by using Student’s t-test or Chi-square test. Paired t-test or nonparametric test was performed to compare the measures at baseline and month 3 within each group. Differences in outcome measures of interest between the groups were deter-mined using Analysis of Covariance (ANCOVA) control-ling for their corresponding baseline levels, sex and age or using non-parametric test. We used log transform-ation for the data that were not normally distributed. Two-sided significance at P< 0.05 was considered to be significant. Analyses were performed using IBM SPSS Statistics version 21.
Results
Assessment of dietary and macronutrients intake
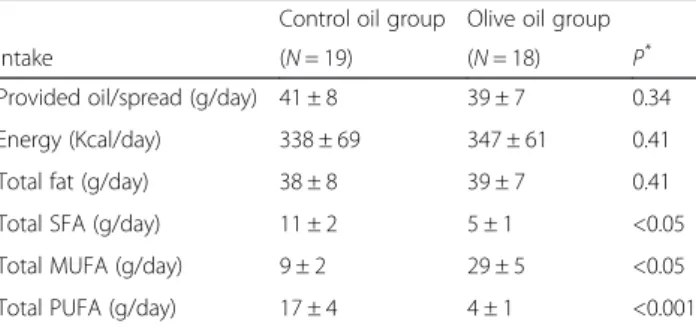
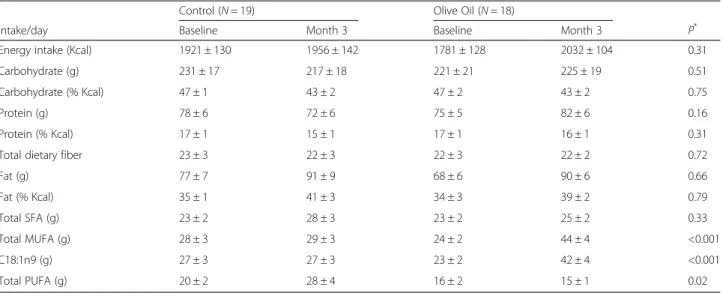
The average amount of study oil and spread consumption was similar in the CON and the OO group (Table 2). We assessed compliance by conducting both dietary assess-ment (Table 3) and plasma fatty acid analysis (Table 4). No difference was found in macronutrient intake at base-line between groups. The OO group showed an increase of total monounsaturated fatty acids (MUFA) (P< 0.001) and oleic acid (P< 0.001) consumption compared to the
Table 2Study oil intake of the study subjectsa
Control oil group Olive oil group
Intake (N= 19) (N= 18) P*
Provided oil/spread (g/day) 41 ± 8 39 ± 7 0.34
Energy (Kcal/day) 338 ± 69 347 ± 61 0.41
Total fat (g/day) 38 ± 8 39 ± 7 0.41
Total SFA (g/day) 11 ± 2 5 ± 1 <0.05
Total MUFA (g/day) 9 ± 2 29 ± 5 <0.05
Total PUFA (g/day) 17 ± 4 4 ± 1 <0.001
Abbreviations:SFAsaturated fatty acids,MUFAMonounsaturated fatty acids, PUFAPolyunsaturated fatty acids
*
P-value was obtained by unpairedt-test a
CON group, and the CON group had increased polyunsat-urated fatty acids (PUFA) intake (P< 0.05) compared to the OO group after 3 months. No difference in intake of other macronutrients including total fat, carbohydrates, protein, fiber, and energy was observed between the groups after 3 months.
Plasma fatty acid analysis (Table 4) indicated that par-ticipants in the OO group had increased plasma oleic acid (P< 0.05), total MUFA (P< 0.05), and oleic acid/ PUFA ratio (P< 0.05) compared to the CON group after 3 months. In addition, there was a reduction in total
plasma PUFA in the OO group compared to the CON group after 3 months (P< 0.05).
Demographic, anthropometrics, blood pressure, blood chemistry, and lipid profile
There was no significant difference in age, gender and race between the two groups at baseline (Table 5). We observed a reduction in systolic blood pressure in the OO group compared to the CON group (P< 0.05) after 3 months (Table 5). There was no difference in other an-thropometric measures between the two groups at base-line or after 3 months of intervention. In addition, participants in the OO group showed a trend (P= 0.06) toward an increase in plasma HDL-C levels compared to the CON group after 3 months (Table 5). No difference was found in other parameters of lipid profiles tested in-cluding total cholesterol, LDL-C, and triglycerides as well as in blood glucose concentration between the two groups at month 3.
Immunological assessments
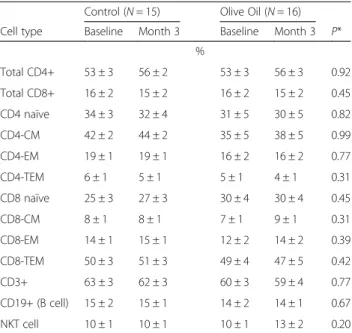
CBC-differential and lymphocyte phenotypes No dif-ference was found in total number of white blood cells, percent or total number of lymphocytes, monocytes, neu-trophils, eosinophils, and basophils at baseline or after 3 months of intervention between the two groups (data are not shown). There was no difference in the changes between the two groups in any of the blood lymphocyte phenotypes measured over 3 months (Table 6).
Lymphocyte proliferation We found significant in-crease in T cell proliferation in response to anti-CD3/ Table 3Dietary intake of overweight and obese older adults in control and olive oil groups at baseline and month 3a
Control (N= 19) Olive Oil (N= 18)
Intake/day Baseline Month 3 Baseline Month 3 P*
Energy intake (Kcal) 1921 ± 130 1956 ± 142 1781 ± 128 2032 ± 104 0.31
Carbohydrate (g) 231 ± 17 217 ± 18 221 ± 21 225 ± 19 0.51
Carbohydrate (% Kcal) 47 ± 1 43 ± 2 47 ± 2 43 ± 2 0.75
Protein (g) 78 ± 6 72 ± 6 75 ± 5 82 ± 6 0.16
Protein (% Kcal) 17 ± 1 15 ± 1 17 ± 1 16 ± 1 0.31
Total dietary fiber 23 ± 3 22 ± 3 22 ± 3 22 ± 2 0.72
Fat (g) 77 ± 7 91 ± 9 68 ± 6 90 ± 6 0.66
Fat (% Kcal) 35 ± 1 41 ± 3 34 ± 3 39 ± 2 0.79
Total SFA (g) 23 ± 2 28 ± 3 23 ± 2 25 ± 2 0.33
Total MUFA (g) 28 ± 3 29 ± 3 24 ± 2 44 ± 4 <0.001
C18:1n9 (g) 27 ± 3 27 ± 3 23 ± 2 42 ± 4 <0.001
Total PUFA (g) 20 ± 2 28 ± 4 16 ± 2 15 ± 1 0.02
Abbreviations:MUFAmonounsaturated fatty acids,PUFApolyunsaturated fatty acids,SFAsaturated fatty acid *P
-value for difference between two groups was obtained by ANCOVA adjusting for age, sex and baseline value a
Values are mean ± SEM
Table 4Plasma fatty acids of overweight and obese older adults in control and olive oil groups at baseline and month 3a
Control (N= 20) Olive Oil (N= 20)
Fatty Acids Baseline Month 3 Baseline Month 3 P* %
C18:1n9 (OA) 19 ± 1 18 ± 1 19 ± 1 20 ± 1 0.04
Total n-3 5 ± 1 5 ± 1 4 ± 0.3 4 ± 0.3 0.38
Total n-6 43 ± 1 42 ± 1 43 ± 1 41 ± 0.3 0.31
Total PUFA 47 ± 1 47 ± 1 47 ± 1 45 ± 1 0.04
Total MUFA 22 ± 1 22 ± 1 22 ± 1 24 ± 1 0.04
Total SFA 31 ± 0.4 31 ± 1 31 ± 1 32 ± 1 0.47
OA/PUFA (ratio) 0.4 ± 0.02 0.4 ± 0.02 0.4 ± 0.02 0.5 ± 0.02 0.03
n-6/n-3 (ratio) 13 ± 1 12 ± 1 12 ± 1 12 ± 1 0.58
ALA 0.6 ± 0.03 0.6 ± 0.04 0.6 ± 0.04 0.6 ± 0.1 0.45
Abbreviations:ALAalpha linolenic acid,MUFAmonounsaturated fatty acids,OA oleic acid,PUFApolyunsaturated fatty acids,SFAsaturated fatty acids *
P-value for difference between two groups was obtained by ANCOVA adjusting for age, sex and baseline value
a
anti-CD28 (1 mg/L) after 3 months in the OO group compared to the CON group (P< 0.05). There was no difference in T cell proliferation in response to Con A between the two groups (Table 7).
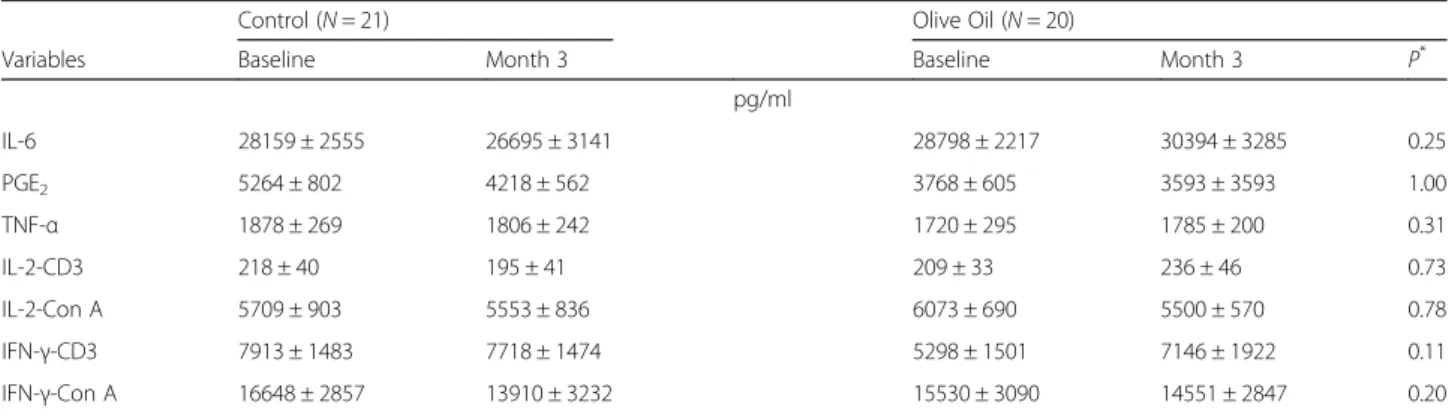
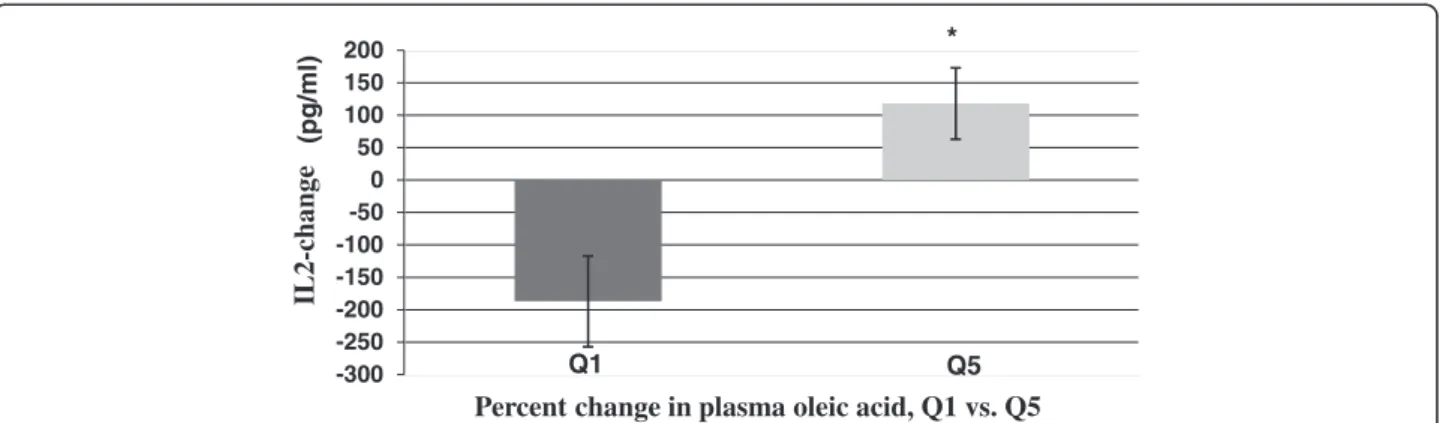
Cytokine production No difference was found in T cell cytokine and pro-inflammatory cytokine production be-tween the two groups after 3 months of intervention (Table 8). There was heterogeneity in the change of plasma oleic acid concentrations following intervention in both groups. For the CON group, the range of change in plasma oleic acid was between −5.14 and 3.15 %; in the OO group, the range of change was between −3.84 and 7.32 %. This may be partly due to inter-individual variability in endogenous oleic acid production and dif-ference in compliance. As such, we ranked the change in blood oleic acid levels between baseline and month 3 in all participants in quintiles and evaluated the change in cytokine levels between baseline and month 3 in relation to the quintiles 1 and 5 of plasma oleic acid changes. We found that participants who had the highest quintile of oleic acid changes had a higher increase in IL-2 pro-duction compared to the participants in the lowest quin-tile (P< 0.01) (Fig. 2). No such association with other cytokines was noted.
Delayed-type hypersensitivity skin test (DTH) Both the CON and OO groups showed an increase in the diameter of skin induration after 24 and 48-h of DTH implant at month 3 compared to baseline, but the in-crease was similar between the two groups (Table 9).
Discussion
To our knowledge, our study is the first comprehensive one to determine the impact of substituting extra virgin olive oil for the cooking oils used in a typical American diet on cardio-metabolic and immunological outcomes in overweight and obese older adults, a population at higher risk for infectious and non-infectious chronic dis-eases. We showed that consumption of extra virgin olive oil for 3 months reduced blood pressure, tended to in-crease plasma HDL-C levels, and improved T cell prolif-eration. Further, participants in both groups with the highest change in plasma oleic acid showed higher in-crease in IL-2 production. There was no effect on other blood lipids, glucose, and inflammatory mediators.
In agreement with the previous studies [35, 56–59], we observed a blood pressure-lowering effect of EVOO consumption. However, our observation is particularly important because the participants, obese and older adults, are at higher risk compared to lean younger adults for developing cardiovascular disease. Furthermore, since lower blood pressure is a predictor of survival and freedom from physical and cognitive impairment [60], Table 5Demographic, anthropometric and cardio-metabolic
measures of overweight and obese older adults in control and olive oil groups at baseline and month 3a
Control (N= 21) Olive Oil (N= 20)
Measures Baseline Month 3 Baseline Month 3 P*
Age (y) 72 ± 1 72 ± 1 0.77
Female, [n (%)] 15 (71) 12 (60) 0.52
Caucasian, [n (%)] 15 (71) 13 (65) 0.57
Weight (Kg) 80 ± 2 80 ± 2 80 ± 3 80 ± 3 0.39
Height (m) 1.7 ± 0.02 1.7 ± 0.02 1.7 ± 0.02 1.7 ± 0.02 N/A
BMI (Kg/m2) 29 ± 1 29 ± 1 29 ± 1 29 ± 1 0.31
Waist (cm) 97 ± 2 97 ± 2 97 ± 3 97 ± 3 0.96
Hip (cm) 106 ± 2 107 ± 2 106 ± 2 106 ± 2 0.10
DBP (mmHg) 76 ± 2 73 ± 2 76 ± 2 73 ± 1 0.99
SBP (mmHg) 126 ± 2 126 ± 3 128 ± 3 122 ± 2 0.04
Glucose (mg/dl) 102 ± 2 105 ± 2 101 ± 2 104 ± 2 0.86
HDL-C (mg/dl) 53 ± 2 52 ± 2 52 ± 3 54 ± 3 0.06
LDL-C (mg/dl) 144 ± 7 145 ± 7 130 ± 7 132 ± 6 0.39
TG (mg/dl) 104 ± 10 110 ± 11 103 ± 9 113 ± 13 0.69
Abbreviations:BMIbody mass index,DBPdiastolic blood pressure,HDL-Chigh density lipoprotein-cholesterol,LDL-Clow density lipoprotein cholesterol,SBP systolic blood pressure,TGtriglycerides,N/Anot applicable
*
P-value between groups was obtained by student (un-paired)t-test or chi-square (demographic measures) or ANCOVA adjusting for age, sex and baseline value (anthropometric and cardio-metabolic measures) a
Values are mean ± SEM or n (%)
Table 6Lymphocyte phenotypes of overweight and obese older adults in control and olive oil groups at baseline and month 3a
Control (N= 15) Olive Oil (N= 16)
Cell type Baseline Month 3 Baseline Month 3 P*
%
Total CD4+ 53 ± 3 56 ± 2 53 ± 3 56 ± 3 0.92
Total CD8+ 16 ± 2 15 ± 2 16 ± 2 15 ± 2 0.45
CD4 naïve 34 ± 3 32 ± 4 31 ± 5 30 ± 5 0.82
CD4-CM 42 ± 2 44 ± 2 35 ± 5 38 ± 5 0.99
CD4-EM 19 ± 1 19 ± 1 16 ± 2 16 ± 2 0.77
CD4-TEM 6 ± 1 5 ± 1 5 ± 1 4 ± 1 0.31
CD8 naïve 25 ± 3 27 ± 3 30 ± 4 30 ± 4 0.45
CD8-CM 8 ± 1 8 ± 1 7 ± 1 9 ± 1 0.31
CD8-EM 14 ± 1 15 ± 1 12 ± 2 14 ± 2 0.39
CD8-TEM 50 ± 3 51 ± 3 49 ± 4 47 ± 5 0.42
CD3+ 63 ± 3 62 ± 3 60 ± 3 59 ± 4 0.77
CD19+ (B cell) 15 ± 2 15 ± 1 14 ± 2 14 ± 1 0.67
NKT cell 10 ± 1 10 ± 1 10 ± 1 13 ± 2 0.20
Abbreviations:CMcentral memory,EMeffector memory,TEMterminal effector memory,NKTnatural killer T cell
*P-value for difference between groups was obtained by ANCOVA adjusting for age, sex and baseline value
a
both of which increase with age, our results support the notion that consumption of EVOO may have the potential to extend health span and curb development of age-related diseases.
We observed a trend toward increased blood concen-trations of HDL-C after olive oil consumption, which supports the earlier reports of a beneficial effect of olive oil on blood lipid profiles by Marrugat et al. [61]. The less pronounced effect observed in our study compared to theirs might be related to the difference in adminis-tering olive oil between the two studies. Throughout their study, subjects were provided with a daily dose of 25 mL of raw virgin olive oil and were directed to re-place all other cooking fats with refined olive oil. In our study, EVOO was provided to the subjects to use as they wished (reflecting their actual lifestyle); therefore, they might have consumed less uncooked olive oil. Given that heating EVOO might destroy some of its active phenolic compounds [62, 63], it is possible that subjects in Mar-rugat’s study consumed more uncooked virgin olive oil, and thus, higher levels of phenolic compounds, which might have resulted in a more profound effect on their plasma HDL-C levels.
Limited information is available about the impact of olive oil on immune and inflammatory responses, and no studies have used outcome variables as specific and comprehensive as those in our current study or in any study of overweight and obese older adults. For example, a study by Yaqoob et al. showed no effect on T cell pro-liferation in healthy middle-aged men (45–64 y, BMI 21.9–30.7) after they consumed only refined olive oil for 8 weeks [37]. This is in contrast to our observation that extra virgin olive oil consumption resulted in a modest improvement in T cell proliferation as well as an associ-ation between an increased production of T cell cytokine IL-2 and the magnitude of increase in plasma oleic acid. The difference between our findings and those of Yaqoob et al. [37] might be related to the fact that the participants in our study were 65 y or older, while the age range in their study was 45–64 y. It is reasonable to assume that T cell function in the participants of our study might have been less vigorous due to our subjects’ more advanced ages compared to those in the study by Yaqoob et al. [37], possibly explaining the discrepancy between the results of the two studies. This speculation is also supported by the observation that a study Table 7Proliferative response of T cells to Con A and anti-CD3/anti-CD28 of overweight and obese older adults in control and olive oil groups at baseline and month 3
Control (N= 21) Olive Oil (N= 20)
Stimulation condition Baseline Month 3 Baseline Month 3 P*
cpm x 103
Con A-5 mg/L 21 ± 5 24 ± 3 18 ± 3 21 ± 4 0.93
Con A-25 mg/L 31 ± 7 41 ± 5 31 ± 4 39 ± 5 0.61
Con A-50 mg/L 23 ± 5 28 ± 3 21 ± 3 31 ± 4 0.48
Anti-CD3/anti-CD28-1 mg/L 23 ± 5 22 ± 5 19 ± 4 29 ± 4 0.02
Anti-CD3/anti-CD28-5 mg/L 33 ± 7 35 ± 5 32 ± 5 40 ± 5 0.17
Anti-CD3/anti-CD28-10 mg/L 33 ± 7 36 ± 5 31 ± 5 41 ± 5 0.19
Abbreviations:Con Aconcanavalin A,cpmcounts per minute *
P-value for difference between groups was obtained by ANCOVA adjusting for age, sex, and baseline value
Table 8Cytokine concentrations of overweight and obese older adults in control and olive oil groups at baseline and month 3a
Control (N= 21) Olive Oil (N= 20)
Variables Baseline Month 3 Baseline Month 3 P*
pg/ml
IL-6 28159 ± 2555 26695 ± 3141 28798 ± 2217 30394 ± 3285 0.25
PGE2 5264 ± 802 4218 ± 562 3768 ± 605 3593 ± 3593 1.00
TNF-α 1878 ± 269 1806 ± 242 1720 ± 295 1785 ± 200 0.31
IL-2-CD3 218 ± 40 195 ± 41 209 ± 33 236 ± 46 0.73
IL-2-Con A 5709 ± 903 5553 ± 836 6073 ± 690 5500 ± 570 0.78
IFN-γ-CD3 7913 ± 1483 7718 ± 1474 5298 ± 1501 7146 ± 1922 0.11
IFN-γ-Con A 16648 ± 2857 13910 ± 3232 15530 ± 3090 14551 ± 2847 0.20
Abbreviations:Con Acancanavalin A,IFN-γinterferon gamma,IL-6interleukin-6,IL-2interleukin-2,PGE2prostaglandin E2,TNF-αtumor necrosis factor-alpha *P
-value for difference between groups was obtained by ANCOVA adjusting for age, sex, and baseline value a
conducted in patients with rheumatoid arthritis, who are known to have reduced T cell-mediated function [64, 65], showed that olive oil increased T- lymphocyte prolifera-tion in peripheral blood mononuclear cells (PBMC) [38]. Additionally, in our study, we used EVOO, which has a higher content of phenolic compounds and might have caused a different effect compared to the refined olive oil used in the study by Yaqoob et al. [37]. Furthermore, the duration of the two studies differed–our study was 12-weeks, their study was 8-weeks. This variation may have also contributed to the difference in findings between the two studies.
To determine the mechanism of olive oil-induced en-hancement in anti-CD3/anti-CD28-induced T cell pro-liferation, we evaluated the production of IL-2, the key cytokine involved in the activation of T cells. When assessing the entire group, we found no difference in IL-2 production between the two study groups; how-ever, since the range of change in plasma oleic acid in the subjects who consumed olive oil (−3.84 % to
7.32 %) and control oil (−5.14 % to 3.15 %) was large, we explored the relationship between quintiles of change in IL-2 production and those in plasma oleic acid in all subjects. Participants with the largest change in plasma oleic acid levels, i.e., those in quintile 5, showed a highly significant increase in IL-2 production compared to those with the lowest change in plasma oleic acid levels, i.e., those in quintile 1. These data sug-gest that the increase in T cell proliferation might be partly due to an oleic acid-induced increase in IL-2 production. However, further investigation is needed to confirm this finding. Furthermore, our data indicate that the olive oil-induced enhancement in T cell prolifera-tion is not due to changes in blood composiprolifera-tion of lym-phocytes or T cell profiles as we did not find any difference in the percent of lymphocytes or T cell pheno-type profiles between the two groups after 3 months.
It is noteworthy that the effect of olive oil on T cell proliferation in our study may be stimulation-specific because enhanced T cell proliferation was found when -300
-250 -200 -150 -100 -50 0 50 100 150 200
IL2-change
Percent change in plasma oleic acid, Q1 vs. Q5
(pg/ml)
Q1 Q5
*
Fig. 2Association between changes in plasma oleic acid content (%) and IL-2 production (all participants). The percent changes in plasma oleic acid were ranked in 5 quintiles, Q1 (−5.14 to-2.68); Q2, (−2.69 to−0.35); Q3, (−0.18 to 0.5); Q4, (0.89 to 2.66), and Q5, (2.78 to 7.32);N= 8 partici-pants in each quintile. The change in IL-2 production in response to anti-CD3/anti-CD28 after 3 months is shown in Q1 and Q5. * Significantly dif-ferent from Q1 by ANCOVA adjusting for age, sex and the baseline values of oleic acid and IL-2 atP< 0.01
Table 9Delayed-type hypersensitivity skin test of overweight and obese older adults in control and olive oil groups at baseline and month 3a
Control (n= 21) Olive Oil (N= 20)
Measurement Baseline Month 3 P* Baseline Month 3 P* P**
mm
Induration to candida 9.4 ± 2.1 13.5 ± 2.4 0.04 9.9 ± 1.9 11.8 ± 2.7 0.13 0.48
Induration to TT 14.6 ± 1.7 16.0 ± 2.5 0.57 10.2 ± 1.9 11.5 ± 1.9 0.73 0.32
Induration to TM 2.6 ± 1.2 4.0 ± 2.5 0.15 4.3 ± 1.6 6.7 ± 2.3 0.07 0.81
Total induration 26.6 ± 2.7 33.5 ± 3.9 0.03 24.4 ± 3.3 30.0 ± 4.4 0.04 0.37
No. of positive responses 1.66 1.86 0.16a 1.79 1.74 0.74b 0.08b Abbreviations:TTtetanus toxoid,TMtrichophyton mentagrophytes
*
P-value within group was obtained by pairedt-test or nonparametric test as indicated byb underP*
column **P
-value for difference between groups was obtained by ANCOVA or nonparametric test as indicated byb underP**
column a
anti-CD3/anti-CD28 Abs (TCR activation together with co-stimulation), but not when T cell mitogen Con A, was used to activate T cells. Although mechanisms of signaling pathways were not the subject of our current study, this finding implies that specific signaling path-ways or lipid/protein microenvironment involved in T cell receptor activation and co-stimulation-induced T cell activation might be influenced by olive oil.
In contrast to a moderate effect on T cell proliferation, olive oil consumption showed no effect on DTH skin test, an in vivo marker for recall antigen-specific cell-mediated immunity. Given that both groups showed an increase in total diameter of induration, it is possible that the boosting effect of repeated administration of the skin test might have masked any additional effect of olive oil.
There are some limitations to this study. First, since participants were given oil/spread for ad libitum use in their cooking at home, which allowed them to share with their families, it was difficult to determine the exact amount they themselves actually consumed even though their average use was measured using a 3DDR. Second, for those who used the oil for frying, only some of the oil absorbed by the food was expected to be ingested. The plasma fatty acid analysis reflected this situation since it showed a moderate 2 % increase with a wide range (−3.84 % to 7.32 %) in plasma oleic acid levels after 3 months in the olive oil group compared to the control group.
Nevertheless, based on significant changes in plasma oleic acid as well as the information recorded by 3DDR, both groups (OO and CON) were compliant to the treatments. We are aware that measuring blood levels of phenolic compounds present in olive oil could have en-hanced compliance validation and data interpretation. However, in the current study, the participants used the oils at home at different times, thus a pre-determined time between olive oil consumption and blood collection could not be tightly controlled. Given that these phen-olic compounds are metabolized over time after absorp-tion, it would be unreliable to use random blood sample to assess phenolic compounds following olive oil con-sumption [66].
In conclusion, our findings suggest that substituting EVOO for oils used in a typical American diet may have both cardio-metabolic and immunologic health benefits as indicated by reduced systolic blood pressure, a strong trend toward increased plasma HDL-C, and a moderate enhancing effect on T cell-mediated function. However, our results do not support an anti-inflammatory effect of EVOO in obese older adults. Given the increased risk of high blood pressure and a decline in T cell-mediated function in older adults, particularly those who are over-weight and obese, our results suggest that overover-weight
and obese older adults might benefit from substituting the oils used in their typical American diet with extra virgin olive oil.
Abbreviations
CON:Control; OO: Olive oil; EVOO: Extra virgin olive oil; Med-diet: Mediterranean diet; CVD: Cardiovascular disease; HNRCA: Human Nutrition Research Center on Aging; MRU: Metabolic Research Unit; BMI: Body mass index; NHANES: National Health and Nutrition Examination Survey; DTH: Delayed-type hypersensitivity; CBC: Complete blood count; 3DDR: 3-day dietary record; LDL-C: Low density lipoprotein cholesterol; HDL-C: High density lipoprotein cholesterol; GC: Gas chromatography; ConA: Concanavalin A; IL-2: Interleukin-2; IL-6: Interleukin-6; IFN-γ: Interferon-gamma; TNF-α: Tumor necrosis factor-alpha;
PGE2: Prostaglandin E2; LPS: Lipopolysaccharide; ELISA: Enzyme-linked
immunosorbent assay; EIA: Enzyme immune assay; MUFA: Monounsaturated fatty acids; PUFA: Polyunsaturated fatty acids..
Competing interests
The authors declare that they have no competing interests.
Authors’contributions
The authors’responsibilities were as follows: SNM, JB, and DW designed the research; MR performed immune laboratory work, data collection and data analysis; LL assisted with immune laboratory work; MM oversaw plasma fatty acid analysis; ES acted as the study physician; MR drafted the manuscript; SNM, JB, DW, GH, TW, AM, MM, JW, JMO, and Y-CL reviewed the draft manuscript and provided feedback. All authors read and approved the final manuscript.
Acknowledgements
This work was supported by Deoleo Company in Cordoba, Spain and the U.S. Department of Agriculture, Agriculture Research Service under agreement #58-1950-0-014.
The authors would like to thank the staff of the Recruitment and Volunteer Service Department, Metabolic Research Unit, Nutritional Evaluation Lab, Vascular Biology Lab and Nutritional Immunology Lab at HNRCA as well as the study participants for their crucial contributions and also Stephanie Marco for her editorial assistance.
Author details
1Jean Mayer USDA Human Nutrition Research Center on Aging at Tufts University, 711 Washington Street, Boston, MA 02111, USA.2Department of Health and Clinical Sciences, University of Massachusetts, Lowell 3 Solomont Way, Suite 4, Lowell, MA 01854, USA.3Institute of Food Science and Technology and Nutrition (ICTAN), Scientific National Research Council (CSIC), Madrid, Spain.
Received: 3 June 2015 Accepted: 21 July 2015
References
1. Corona G, Spencer JP, Dessi MA. Extra virgin olive oil phenolics: absorption, metabolism, and biological activities in the GI tract. Toxicol Ind Health. 2009;25(4–5):285–93.
2. Visioli F, Galli C. Biological properties of olive oil phytochemicals. Crit Rev Food Sci Nutr. 2002;42(3):209–21.
3. Ghanbari R, Anwar F, Alkharfy KM, Gilani AH, Saari N. Valuable Nutrients and Functional Bioactives in Different Parts of Olive (Olea europaea L.)-A Review. Int J Mol Sci. 2012;13(3):3291–340.
4. Waterman E, Lockwood B. Active components and clinical applications of olive oil. Altern Med Rev. 2007;12(4):331–42.
5. Pal Yu B, Young Chung H. The inflammatory process in aging. Reviews in Clinical Gerontology. 2006;16(03):179–87.
6. Ginaldi L, Loreto MF, Corsi MP, Modesti M, De Martinis M. Immunosenescence and infectious diseases. Microbes Infect. 2001;3(10):851–7.
7. Fulop T, Larbi A, Wikby A, Mocchegiani E, Hirokawa K, Pawelec G. Dysregulation of T-cell function in the elderly: scientific basis and clinical implications. Drugs Aging. 2005;22(7):589–603.
effector memory cells in CD4(+) versus effector memory and terminally differentiated memory cells in CD8(+) compartment. Mech Ageing Dev. 2006;127(3):274–81.
9. Wikby A, Johansson B, Olsson J, Lofgren S, Nilsson BO, Ferguson F. Expansions of peripheral blood CD8 T-lymphocyte subpopulations and an association with cytomegalovirus seropositivity in the elderly: the Swedish NONA immune study. Exp Gerontol. 2002;37(2–3):445–53.
10. Globerson A, Effros RB. Ageing of lymphocytes and lymphocytes in the aged. Immunol Today. 2000;21(10):515–21.
11. Pahlavani MA, Harris MD, Richardson A. Activation of p21ras/MAPK signal transduction molecules decreases with age in mitogen-stimulated T cells from rats. Cell Immunol. 1998;185(1):39–48.
12. Kirk CJ, Miller RA. Analysis of Raf-1 activation in response to TCR activation and costimulation in murine T-lymphocytes: effect of age. Cell Immunol. 1998;190(1):33–42.
13. Assaad U, El-Masri I, Porhomayon J, El-Solh AA. Pneumonia immunization in older adults: review of vaccine effectiveness and strategies. Clin Interv Aging. 2012;7:453–61.
14. Agius E, Lacy KE, Vukmanovic-Stejic M, Jagger AL, Papageorgiou AP, Hall S, et al. Decreased TNF-alpha synthesis by macrophages restricts cutaneous immunosurveillance by memory CD4+ T cells during aging. J Exp Med. 2009;206(9):1929–40.
15. Ferguson FG, Wikby A, Maxson P, Olsson J, Johansson B. Immune parameters in a longitudinal study of a very old population of Swedish people: a comparison between survivors and nonsurvivors. J Gerontol A Biol Sci Med Sci. 1995;50(6):B378–382.
16. Wikby A, Maxson P, Olsson J, Johansson B, Ferguson FG. Changes in CD8 and CD4 lymphocyte subsets, T cell proliferation responses and non-survival in the very old: the Swedish longitudinal OCTO-immune study. Mech Ageing Dev. 1998;102(2–3):187–98.
17. Olsson J, Wikby A, Johansson B, Lofgren S, Nilsson BO, Ferguson FG. Age-related change in peripheral blood T-lymphocyte subpopulations and cytomegalovirus infection in the very old: the Swedish longitudinal OCTO immune study. Mech Ageing Dev. 2000;121(1–3):187–201.
18. Thoman ML, Weigle WO. Lymphokines and aging: interleukin-2 production and activity in aged animals. J Immunol. 1981;127(5):2102–6.
19. Hayek MG, Meydani SN, Meydani M, Blumberg JB. Age differences in eicosanoid production of mouse splenocytes: effects on mitogen-induced T-cell proliferation. J Gerontol. 1994;49(5):B197–207.
20. Meydani SN, Meydani M, Verdon CP, Shapiro AA, Blumberg JB, Hayes KC. Vitamin E supplementation suppresses prostaglandin E1(2) synthesis and enhances the immune response of aged mice. Mech Ageing Dev. 1986;34(2):191–201.
21. Swain SL, Nikolich-Zugich J. Key research opportunities in immune system aging. J Gerontol A Biol Sci Med Sci. 2009;64(2):183–6.
22. De Martinis M, Franceschi C, Monti D, Ginaldi L. Inflammation markers predicting frailty and mortality in the elderly. Exp Mol Pathol. 2006;80(3):219–27. 23. Chung HY, Sung B, Jung KJ, Zou Y, Yu BP. The molecular inflammatory
process in aging. Antioxid Redox Signal. 2006;8(3–4):572–81.
24. Germolec DR, Frawley RP, Evans E. Markers of inflammation. Methods Mol Biol. 2010;598:53–73.
25. Schroder H, Marrugat J, Vila J, Covas MI, Elosua R. Adherence to the traditional mediterranean diet is inversely associated with body mass index and obesity in a spanish population. J Nutr. 2004;134(12):3355–61. 26. Nieman DC, Henson DA, Nehlsen-Cannarella SL, Ekkens M, Utter AC,
Butterworth DE, et al. Influence of Obesity on Immune Function. J Am Diet Assoc. 1999;99(3):294–9.
27. Karlsson EA, Sheridan PA, Beck MA. Diet-induced obesity impairs the T cell memory response to influenza virus infection. J Immunol.
2010;184(6):3127–33.
28. Dandona P, Aljada A, Bandyopadhyay A. Inflammation: the link between insulin resistance, obesity and diabetes. Trends Immunol. 2004;25(1):4–7. 29. Kern PA, Ranganathan S, Li C, Wood L, Ranganathan G. Adipose tissue
tumor necrosis factor and interleukin-6 expression in human obesity and insulin resistance. Am J Physiol Endocrinol Metab. 2001;280(5):E745–751. 30. Shoelson SE, Herrero L, Naaz A. Obesity, inflammation, and insulin
resistance. Gastroenterology. 2007;132(6):2169–80.
31. Weisberg SP, McCann D, Desai M, Rosenbaum M, Leibel RL, Ferrante Jr AW. Obesity is associated with macrophage accumulation in adipose tissue. J Clin Invest. 2003;112(12):1796–808.
32. Gregor MF, Hotamisligil GS. Inflammatory mechanisms in obesity. Annu Rev Immunol. 2011;29:415–45.
33. Razquin C, Martinez JA, Martinez-Gonzalez MA, Mitjavila MT, Estruch R, Marti A. A 3 years follow-up of a Mediterranean diet rich in virgin olive oil is associated with high plasma antioxidant capacity and reduced body weight gain. Eur J Clin Nutr. 2009;63(12):1387–93.
34. Soriguer F, Almaraz MC, Ruiz-de-Adana MS, Esteva I, Linares F, Garcia-Almeida JM, et al. Incidence of obesity is lower in persons who consume olive oil. Eur J Clin Nutr. 2009;63(11):1371–4.
35. Moreno-Luna R, Munoz-Hernandez R, Miranda ML, Costa AF, Jimenez-Jimenez L, Vallejo-Vaz AJ, et al. Olive oil polyphenols decrease blood pressure and improve endothelial function in young women with mild hypertension. Am J Hypertens. 2012;25(12):1299–304.
36. Marrugat J, Covas MI, Fito M, Schroder H, Miro-Casas E, Gimeno E, et al. Effects of differing phenolic content in dietary olive oils on lipids and LDL oxidation–a randomized controlled trial. Eur J Nutr. 2004;43(3):140–7. 37. Yaqoob P, Knapper JA, Webb DH, Williams CM, Newsholme EA, Calder PC.
Effect of olive oil on immune function in middle-aged men. Am J Clin Nutr. 1998;67(1):129–35.
38. Kremer JM, Lawrence DA, Jubiz W, DiGiacomo R, Rynes R, Bartholomew LE, et al. Dietary fish oil and olive oil supplementation in patients with rheumatoid arthritis. Clinical and immunologic effects. Arthritis Rheum. 1990;33(6):810–20.
39. Tsimikas S, Philis-Tsimikas A, Alexopoulos S, Sigari F, Lee C, Reaven PD. LDL isolated from Greek subjects on a typical diet or from American subjects on an oleate-supplemented diet induces less monocyte chemotaxis and adhesion when exposed to oxidative stress. Arterioscler Thromb Vasc Biol. 1999;19(1):122–30.
40. Perez-Martinez P, Lopez-Miranda J, Blanco-Colio L, Bellido C, Jimenez Y, Moreno JA, et al. The chronic intake of a Mediterranean diet enriched in virgin olive oil, decreases nuclear transcription factor kappaB activation in peripheral blood mononuclear cells from healthy men. Atherosclerosis. 2007;194(2):3.
41. Fito M, Cladellas M, de la Torre R, Marti J, Alcantara M, Pujadas-Bastardes M, et al. Antioxidant effect of virgin olive oil in patients with stable coronary heart disease: a randomized, crossover, controlled, clinical trial. Atherosclerosis. 2005;181(1):149–58.
42. Mena M-P, Sacanella E, Vazquez-Agell M, Morales M, Fitó M, Escoda R, et al. Inhibition of circulating immune cell activation: a molecular
antiinflammatory effect of the Mediterranean diet. Am J Clin Nutr. 2009;89(1):248–56.
43. Esposito K, Marfella R, Ciotola M, Di Palo C, Giugliano F, Giugliano G, et al. Effect of a mediterranean-style diet on endothelial dysfunction and markers of vascular inflammation in the metabolic syndrome: a randomized trial. Jama. 2004;292(12):1440–6.
44. Fito M, de la Torre R, Covas MI. Olive oil and oxidative stress. Mol Nutr Food Res. 2007;51(10):1215–24.
45. Psaltopoulou T, Naska A, Orfanos P, Trichopoulos D, Mountokalakis T, Trichopoulou A. Olive oil, the Mediterranean diet, and arterial blood pressure: the Greek European Prospective Investigation into Cancer and Nutrition (EPIC) study. Am J Clin Nutr. 2004;80(4):1012–8.
46. Austin GL, Ogden LG, Hill JO. Trends in carbohydrate, fat, and protein intakes and association with energy intake in normal-weight, overweight, and obese individuals: 1971–2006. Am J Clin Nutr. 2011;93(4):836–43. 47. Cotton PA, Subar AF, Friday JE, Cook A. Dietary sources of nutrients among
US adults, 1994 to 1996. J Am Diet Assoc. 2004;104(6):921–30. 48. Oilseed Crushings and Production, Consumption, and Stocks, U.S. Census
Bureau and Peanut Stocks and Processors, National Agricultural Statistics Service, USDA. Oil Crops Yearbook (Update 03/10) Stock #89002 Economic Research Service, United States Department of Agriculture. Appendix Table 31-Edible fats and oils: U.S supply and disappearance, 1997-2010. 49. Raszka WV, Moriarty RA, Ottolini MG, Waecker NJ, Ascher DP, Cieslak TJ, et
al. Delayed-type hypersensitivity skin testing in human immunodeficiency virus-infected pediatric patients. J Pediatr. 1996;129(2):245–50.
50. Collier HB. Some problems in the use of coulter counter erythrocyte total counts and volume distribution. J Clin Path. 1968;21:179.
51. Trinder P. Determination of blood glucose using an oxidase-peroxidase system with a non-carcinogenic chromogen. J Clin Pathol.
1969;22(2):158–61.
53. Allain CC, Poon LS, Chan CS, Richmond W, Fu PC. Clin Chem. 1974;20:470. 54. Protocol as specified in Beckman Coulter AU400 standard operating
procedure insert for HDL (Beckman Coulter America Inc. CCD, Melville, NY, 11747–3157)
55. Caruso U, Fowler B, Erceg M, Romano C. Determination of very-long-chain fatty acids in plasma by a simplified gas chromatographic-mass spectrometric procedure. J Chromatogr. 1991;562(1–2):147–52. 56. Ferrara LA, Raimondi AS, d’Episcopo L, Guida L, Dello Russo A, Marotta T.
Olive oil and reduced need for antihypertensive medications. Arch Intern Med. 2000;160(6):837–42.
57. Villarejo AB, Ramirez-Sanchez M, Segarra AB, Martinez-Canamero M, Prieto I. Influence of extra virgin olive oil on blood pressure and kidney
angiotensinase activities in spontaneously hypertensive rats. Planta Med. 2015;81(8):664–9.
58. Akesson A. Go nuts and go extra virgin olive oil! Mediterranean diets reduce blood pressure. Hypertension. 2014;64(1):26–7.
59. Toledo E, Hu FB, Estruch R, Buil-Cosiales P, Corella D, Salas-Salvado J, et al. Effect of the Mediterranean diet on blood pressure in the PREDIMED trial: results from a randomized controlled trial. BMC Med.
2013;11(207):1741–7015.
60. Reed DM, Foley DJ, White LR, Heimovitz H, Burchfiel CM, Masaki K. Predictors of healthy aging in men with high life expectancies. Am J Public Health. 1998;88(10):1463–8.
61. Marrugat J, Covas M-I, Fitó M, Schröder H, Miró-Casas E, Gimeno E, et al. Effects of differing phenolic content in dietary olive oils on lipids and LDL oxidation. Eur J Nutr. 2004;43(3):140–7.
62. Attya M, Benabdelkamel H, Perri E, Russo A, Sindona G. Effects of conventional heating on the stability of major olive oil phenolic compounds by tandem mass spectrometry and isotope dilution assay. Molecules. 2010;15(12):8734–46.
63. Gomez-Alonso S, Fregapane G, Salvador MD, Gordon MH. Changes in phenolic composition and antioxidant activity of virgin olive oil during frying. J Agric Food Chem. 2003;51(3):667–72.
64. Slavin S, Strober S. In-vitro T cell mediated function in patients with active rheumatoid arthritis. Ann Rheum Dis. 1981;40(1):60–3.
65. Gizinski AM, Fox DA. T cell subsets and their role in the pathogenesis of rheumatic disease. Curr Opin Rheumatol. 2014;26(2):204–10.
66. Miro-Casas E, Covas MI, Farre M, Fito M, Ortuno J, Weinbrenner T, et al. Hydroxytyrosol disposition in humans. Clin Chem. 2003;49(6 Pt 1):945–52.
Submit your next manuscript to BioMed Central and take full advantage of:
• Convenient online submission
• Thorough peer review
• No space constraints or color figure charges
• Immediate publication on acceptance
• Inclusion in PubMed, CAS, Scopus and Google Scholar
• Research which is freely available for redistribution