Deep Infrared Studies of
Massive High Redshift
Galaxies
Proefschrift
ter verkrijging van
de graad van Doctor aan de Universiteit Leiden, op gezag van de Rector Magnificus Dr. D.D. Breimer,
hoogleraar in de faculteit der Wiskunde en Natuurwetenschappen en die der Geneeskunde, volgens besluit van het College voor Promoties te verdedigen op woensdag 13 oktober 2004
klokke 14.15 uur
door
Ivo Ferdinand Louis Labb´e geboren te Alphen a/d Rijn
Promotor: Prof. dr. M. Franx
Referent: Prof. dr. P.D. Barthel (Universiteit Groningen)
Overige leden: Prof. dr. P.G. van Dokkum (Yale, New Haven, USA) Prof. dr. K.H. Kuijken
Table of contents
Page
Chapter 1. Introduction and Summary 1
1 Introduction . . . 1
1.1 Observational Cosmology . . . 1
1.2 Galaxy Formation . . . 2
1.3 Massive High Redshift Galaxies . . . 4
1.4 The Faint InfraRed Extragalactic Survey . . . 6
2 Outline and Summary . . . 8
3 Conclusions and Outlook . . . 11
Chapter 2. Ultradeep NIR ISAAC observations of the HDF-South: observations, reduction, multicolor catalog, and photometric redshifts 15 1 Introduction . . . 16
2 Observations . . . 17
2.1 Field Selection and Observing Strategy . . . 17
2.2 Observations . . . 19
3 Data Reduction . . . 20
3.1 Flatfields and Photometric Calibration . . . 21
3.2 Sky Subtraction and Cosmic Ray Removal . . . 22
3.3 First Version and Quality Verification . . . 23
3.4 Additional Processing and Improvements . . . 23
3.5 Final Version and Post Processing . . . 24
4 Final Images . . . 25
4.1 Properties . . . 25
4.2 Image Quality . . . 27
4.3 Astrometry . . . 28
4.4 Backgrounds and Limiting Depths . . . 28
5 Source Detection and Photometry . . . 30
5.1 Detection . . . 31
5.2 Optical and NIR Photometry . . . 32
6 Photometric Redshifts . . . 35
6.1 Photometric Templates . . . 36
6.2 Zphot Uncertainties . . . 36
6.3 Stars . . . 37
7 Catalog Parameters . . . 38
8 Analysis . . . 39
8.1 Completeness and Number Counts . . . 39
Table of contents v
9 Summary and Conclusions . . . 48
Chapter 3. Large disk-like galaxies at high redshift 53 1 Introduction . . . 54
2 Observations . . . 55
3 Rest-frame Optical versus UV Morphology . . . 55
4 Profile fits and sizes . . . 57
5 Spectral Energy Distribution . . . 58
6 Discussion . . . 59
Chapter 4. The rest-frame optical luminosity density, color, and stellar mass density of the universe from z=0 to z=3 63 1 Introduction . . . 64
2 Data . . . 66
3 Measuring Photometric Redshifts and Rest-Frame Luminosities . . 67
3.1 Photometric Redshift Technique . . . 67
3.1.1 Star Identification . . . 68
3.2 Rest-Frame Luminosities . . . 68
3.2.1 Emission Lines . . . 70
4 The Properties of the Massive Galaxy Population . . . 73
4.1 The Luminosity Density . . . 73
4.1.1 The Evolution ofjrest λ . . . 76
4.2 The Cosmic Color . . . 78
4.3 Estimating M/L∗ V and The Stellar Mass Density . . . 81
5 Discussion . . . 88
5.1 Comparison with other Work . . . 88
5.2 Comparison with SFR(z) . . . 90
5.3 The Build-up of the Stellar Mass . . . 91
6 Summary & Conclusions . . . 92
A Derivation of zphotUncertainty . . . 97
B Rest-Frame Photometric System . . . 99
C Estimating Rest-Frame Luminosities . . . 99
Chapter 5. The color magnitude distribution of field galaxies at 1< z <3: the evolution and modeling of the blue sequence 103 1 Introduction . . . 104
2 The Data . . . 106
2.1 The Observations and Sample Selection . . . 106
2.2 Photometric Redshifts and Rest-Frame Colors . . . 107
3 The rest-frame Color-Magnitude Distribution of Galaxies fromz∼1 to z∼3 . . . 108
4 The Color-Magnitude Relation of Blue Field Galaxies . . . 109
4.1 The Slope and its Evolution . . . 109
4.2 The Zeropoint and its Evolution . . . 112
4.4 Comparison toz∼3 Galaxies . . . 117
4.4.1 The Models . . . 117
4.4.2 Results . . . 118
4.4.3 The Blue CMR in Various Rest-Frame Colors . . . . 119
5 Constraints of the Color-Magnitude Relation on the Star Formation Histories of Blue Galaxies atz∼3 . . . 120
5.1 A library of Star Formation Histories . . . 120
5.2 Fitting Method . . . 121
5.2.1 Creating Mock Observations . . . 121
5.2.2 The Fitting . . . 122
5.3 Results . . . 123
5.3.1 Constant Star Formation . . . 123
5.3.2 Exponentially Declining Star Formation . . . 125
5.3.3 Repeated Bursts . . . 126
5.3.4 Episodic Star Formation: The Duty Cycle . . . 128
5.4 Discussion . . . 130
6 The Onset of the Red galaxies . . . 132
7 Summary and Conclusions . . . 134
Chapter 6. IRAC Mid-infrared imaging of red galaxies at z > 2: new constraints on age, dust, and mass 139 1 Introduction . . . 140
2 The Observations, Photometry, and Sample Selection . . . 141
3 Mid-Infrared Properties of Red Galaxies atz >2 . . . 143
4 Comparison to Lyman Break Galaxies . . . 147
5 The rest-frame K-band mass-to-light ratio . . . 149
6 Discussion and Conclusions . . . 150
Nederlandse samenvatting (Dutch summary) 155
Curriculum Vitae 161
CHAPTER
ONE
Introduction and Summary
1
Introduction
1.1 Observational Cosmology
C
osmologicalstudies have resulted in a “standard” model: a flat,homoge-neous, isotropic universe on large scales, composed of ordinary matter, non-baryonic cold dark matter, and dark energy (Spergel et al. 2003). In this model, the dozen or so of parameters that characterize the universe, most importantly the density of baryons, dark matter, and the expansion of the universe, success-fully describe astronomical observations on scales from a few Mpc to several 1000 Mpc (Freedman et al. 2001; Efstathiou et al. 2002; Spergel et al. 2003). Large scale structure and galaxies grew gravitationally, from tiny, nearly scale-invariant adiabatic Gaussian fluctuations.
I remember vividly the first cosmology conference I attended at the start of this thesis work. I confess the discussions about cosmic microwave background fluctuations seemed endless, as were the discussions on the large scale structure seen in galaxy surveys. I realize now that I did not fully appreciate how much easier my life was going to be knowing that the universe was spatially flat and 13.7 Gyr old. I could focus for many years on questions that would have been much harder to address until these major issues were solved. Given the enormity of the subject in both distance and time, what cosmologists have learned in the last century, leading up to the arrival of this “standard model”, is nothing short of an extraordinary success.
Leaving the mother of all questions “What is the the origin of the universe?” to the realm of literature and natural philosophy, there exist two major, widely recognized, unresolved issues in contemporary cosmology.
galaxies in the Coma cluster and used the virial theorem (Eddington 1916), which relates the total internal kinetic energy of the cluster to its gravitational potential, to argue that there was much more mass in the cluster than could be attributed to the stars in galaxies. In solar units, the ratio of mass to optical luminosity of a galaxy such as the Milky Way is ∼3M¯/L¯, whereas for the Coma cluster the ratio was about 400. This implies that there must be about 100 times more hidden or “dark” matter as compared with matter in stars. The realization grew that all visible matter is only a minor constituent of the universe.
Dark matter has proved remarkably elusive and despite more than 70 years of observational astronomy and experimental physics – and a host of respectable and less-respectable candidates – there has been no confirmation of its nature, except that it is gravitating, does not emit or absorb light, is non-baryonic, and non-leptonic. Worse, since the rise of the standard cosmological model it has been joined by its even more elusive cousin, Vacuum or Dark Energy: the mysterious substance that apparently dominates the energy budget of the Universe, and is believed to fuel its accelerated expansion. Yet in contrast to the fundamentally impenetrable mist of the Big Bang, Dark Matter and Dark Energy are not so far removed that their effects cannot be measured with the present-day methods and technology. If anything, its presence challenges us towards new physics and promises to keep cosmology vibrant for quite some time.
The second great question in cosmology is the main inspiration of this thesis. How did galaxies, harboring most of the visible matter in the universe, form out of an almost perfectly smooth distribution of matter, 379.000 years after the Big Bang? In the standard model, the growth of structure with time on a range of scales, from the largest scale structure, to galaxies, and to perhaps even the first stars, is driven by the gradual hierarchical merging of Cold Dark Matter (CDM) Halos (White & Rees 1978). Cold intergalactic gas cooled onto these halos and was subsequently converted into the stars which shine as galaxies. Observation of galaxies can thus be used to trace the evolution of both normal and dark matter.
Given the theoretical foundation of structure formation and the general prin-ciples thought to govern the formation of galaxies, the formidable task is to un-derstand the physics of star formation on galactic scales, the resultant feedback of energy and material into the interstellar and intergalactic medium, and the role of feedback from supermassive black holes that lurk in the center of galaxies. How-ever formidable, the problem is likely one of complexity, but not in any sense a fundamental problem requiring new physics to be discovered.
1.2 Galaxy Formation
1.1 Introduction 3
(iv) all remaining galaxies, considered ‘irregular’. Elucidating the origin of the “Hubble Sequence” is a crucial and necessary constraint on all models of galaxy formation.”
One of the strongest constraints comes from E+S0s galaxies, collectively called “early-type” galaxies, which are the most massive galaxies in the local universe. The standard CDM scenario prescribes that early-type galaxies formed by mergers of spiral galaxies at relatively recent times (Toomre & Toomre 1972; Toomre 1977; White & Rees 1978). In this scenario, the appearance of galaxies should reflect the growing and merging pattern of their dark matter halos, and as such galaxies should be growing through merging and/or star formation to the present day (e.g., White & Frenk 1991; Kauffmann & White 1993).
Strangely enough, extensive study of nearby early-type galaxies in clusters contradicts this picture. The massive early-type galaxies form an extremely ho-mogeneous class, obeying tight relations in their properties, such as colors and luminosities (Sandage & Visvanathan 1978). Since the colors of stellar popula-tions change with age, the small scatter in the color-magnitude relation constrains the scatter in age at a given magnitude. For ellipticals in the Coma Cluster, the estimated intrinsic scatter of 0.04 inU−V colors implied a spread in age of less than 15% (Bower, Lucey, & Ellis 1992). The usual interpretation is that the stars in these galaxies formed at high redshiftz >2. Detailed modelling of the spectra showed a similar picture (Trager et al. 2000).
The formation scenario of nearby early-type galaxies in clusters is closer to the classical picture of the monolithic collapse, the antipole of the hierarchichal galaxy formation. In the monolithic scenario, E+S0s assembled their mass and formed their stars in a rapid event, of much shorter duration than their average age (Eggen, Lynden-Bell, & Sandage 1962; Larson 1975; van Albada 1982). The formation process happened at high redshifts predicting that and the progenitors of todays massive early-type galaxies would be vigorously star-forming with star formation rates of much more than 100M¯yr−1
Here, it is more robust to restrict our science to simple inferences from direct observations.
Clearly, observing galaxies while they are forming provides a powerful and complementary approach. Nature’s gift to cosmologists, the finite speed of light, allows us to look back in time as we observe galaxies at increasing distance, as measured by their redshifts. This has been the corner-stone of the “look-back” approach to studying galaxy evolution. Observations of extremely distant and extremely faint galaxies atz= 2 and higher allow us a direct look into the process of their formation.
1.3 Massive High Redshift Galaxies
Answers to many of the questions are now becoming available from large statistical surveys of galaxies, using new instruments on the largest ground-based and space-based telescopes. Multicolor imaging is our most powerful tool for understanding galaxy evolution, as broadband filter measurements can go very deep and cover large areas. However, even the most ambitious apparent magnitude-selected sur-veys showed that simply observing fainter galaxies is a relatively inefficient means of assembling significant samples of galaxies at high redshift (e.g., Lilly et al. 1996; Ellis et al. 1996 Songaila et al. 1994; Cohen et al. 1996; Cowie et al. 1996). Most faint galaxies on the sky are in fact nearby.
The study of distant galaxies was revolutionized in the past decade, when the increased surveying power was coupled with advances in photometric pre-selection techniques. Of particularly importance was the identification of a large sample of high redshift galaxies from a specific color signature – red in U −B colors, blue in B−V colors. This color signature is produced when neutral hydrogen, from the intergalactic medium and within the galaxies, absorbs the flux of young hot stars (t.107yr) shortward of Lyman 1216 ˚A and the 912 ˚A Lyman limit, which
corresponds to the U-band at z ∼ 3 (e.g., Guhathakurta, Tyson, & Majewski 1990; Songalia, Cowie, & Lilly 1990, Steidel & Hamilton (1992, Steidel, Pettini, & Hamilton 1995).
At the time this thesis work commenced, Lyman Break Galaxies (LBGs), as they are commonly called, were among the best studied classes of distant galaxies. Close to a 1000 had been spectroscopically confirmed (Steidel et al. 1996a,b, 2003) atz&2, and they were found to be a major constituent of the early universe, with space densities similar to local luminous galaxies. Could LBGs be the forerunners of todays massive ellipticals?
1.1 Introduction 5
compact sizes of a few kiloparsecs (Giavalisco, Steidel, & Macchetto 1996) sug-gested virial masses of only 1010M
¯, less than 1/10th of todays most massive galaxies. Their spectra were consistent with on-going star forming activity, re-sembling that of local star bursting galaxies, with only moderate extinction by dust (Adelberger & Steidel 2000). The estimated star formation rates were only 10−15 M¯yr−1, much lower than expected for the progenitors of local early-types in the monolithic scenario. Studies of the stellar composition, using optical and near-infrared broadband photometry, reinforced this picture of relatively low-mass, moderately star forming objects (Sawicki & Yee 1998; Shapley et al. 2001; Papovich, Dickinson, & Ferguson 2001). These properties are expected in the standard hierarchical scenario of galaxy formation, where LBGs are the low-mass building blocks that merge to become present-day massive galaxies in groups and clusters (e.g., Mo & Fukugita 1996; Baugh et al. 1998).
It was quickly realized that LBGs were selected in a very peculiar way. Galaxies that were dust-reddened by more thanE(B−V)&0.4 were not selected(Adelberger & Steidel 2000). Could there still be a population of vigorously star forming galaxies that escaped detection because it was enshrouded in dust? We know that complementary samples of heavily obscured high-redshift galaxies are found in sub-mm, radio (Smail et al. 2000), and X-ray surveys (Cowie et al. 2001; Barger et al. 2001). Their number densities are much lower than LBGs, although their contribution to the total star formation rate can be significant (cf., Adelberger & Steidel 2000; Barger, Cowie, & Sanders 1999).
Even more important, have we overlooked a major population at z > 2 of evolved galaxies that resemble the present-day elliptical and spiral galaxies? None of the techniques described above would select those normal galaxies, whose light is dominated by evolved stars. Specifically, even the massive Milky Way would have never been selected with the Lyman Break technique if placed atz∼3, as it does not have the required high far-UV surface brightness.
It is much easier to detect evolved galaxies atz >2 in the near-infrared (NIR), where one can access their rest-frame optical light, and where evolved stars emit the bulk of their light. The rest-frame optical light is also much less sensitive to the effects of dust obscuration and on-going star formation than the UV, and expected to be a better (yet imperfect) tracer of stellar mass.
Researchers had already begun using NIR data to look for evolved galaxies at
z >1. The techique relied on photometric pre-selection on the stellar Balmer and 4000 ˚A break. The Balmer discontinuity at 3650 ˚A is generally strong in stellar populations of age 108 to 109 yr, and is most pronounced in the photosphere of
A-stars, while even older stellar populations show a charactaristic 4000 ˚A break due to the sudden onset below 4000 ˚A of metallic and molecular absorption in cool stars.
out of the optical filters. Recent surveys yielded large samples of these so-called Extremely Red Objects at redshifts 0.8 < z < 1.8 (EROs; e.g., Elston, Rieke, & Rieke 1988; Hu & Ridgway 1994; Thompson et al. 1999; Yan et al. 2000; Scodeggio & Silva 2000; Daddi et al. 2000; McCarthy et al. 2001; Smith et al. 2002, Moustakas et al. 2004), but their relation to the well-formed massive early-type galaxies atz <1 has not been firmly established. Apparently, a minor fraction of 30% are strongly clustered and evolved galaxies (e.g., Cimatti et al 2002, Daddi et al. 2002), while the rest are believed to be dust reddened star-forming objects (e.g., Yan & Thompson 2003; Moustakas et al. 2004).
To observe evolved galaxies at even higher redshiftsz >2 one has to develop criteria to select the galaxies and at the same time go deep enough to overcome the cosmological effect of the (1 +z)4surface brightness dimming. Normal evolved
galaxies at z ∼ 3 would be incredibly faint. In addition as the Balmer/4000˚A break is less strong than the Lyman break, it requires a combination of extremely deep optical and NIR imaging to select them.
There were very few datasets that reached the required depths, most of them taken with the WFPC2 and NICMOS instruments on the Hubble Space Tele-scope (Thompson et al 2000; Dickinson et al 2000; Williams et al 2000). The largest survey to date is that of Dickinson et al. (2000), who imaged the Hubble Deep Field North (HDFN) WFPC2 field in J110 and H160 with NICMOS,
find-ing that most high redshift galaxies would have been picked up by the Ly-break technique. Nevertheless, the total area studied is still very small, and the depth of theK−band data, which is important in constraining the constribution of evolved stars atz∼3, is not well matched to that of the rest of the NICMOS or WFPC2 imaging data.
To remedy this situation, we started the Faint InfraRed Extragalactic Survey: an ultradeep optical-to-infrared multicolor survey of high redshift galaxies.
1.4 The Faint InfraRed Extragalactic Survey
This dissertation is based on the Faint InfraRed Extragalactic Survey (FIRES; Franx et al. 2000) and its aims are intimately connected with the goals of this survey. FIRES is a large public program at the Very Large Telescope (VLT) consisting of very deep NIR imaging of two fields. The fields are the WPFC2-field of Hubble Deep Field South (HDFS), and the field around the z = 0.83 cluster MS1054-03, both selected for their exquisite, deep optical WFPC2 imaging with the HST.
The central question in this thesis is:
How did massive galaxies assemble over time?
1.1 Introduction 7
1. Have we overlooked a major population at high redshift perhaps resembling the present-day normal elliptical and spiral galaxies?
2. When did the Hubble Sequence of galaxies start manifesting?
3. How and when did galaxies assemble the bulk of their stellar mass?
4. Can we use the distribution of galaxy properties to constrain for-mation scenarios?
5. What is the detailed stellar composition ofz >2galaxies: are there passively evolving galaxies atz∼3, and what is the role of dust?
The body of this work deals with the properties of faint distant galaxies as observed in the HDFS, a small, otherwise undistinguished high-galactic latitude patch of sky. The HDFS and its counterpart in the north, the HDFN, constitute milestones in optical imaging, as the WFPC2 camera on the HST was pushed to its limits. The ultradeep imaging in four optical bands (U300, B450, V606, I814) of
these “empty” fields, named after the absence of any large foreground galaxies, allowed an unprecedented deep look of the distant universe, and opened the door to the study of normal galaxies atz >2.
It is often wondered whether such a small field presents us a fair view of the universe. Luckily, the universe seems not to be fractal or hierarchically structured beyond a few hundred Mpc, and voids and superclusters like the ones near us simply repeat. Therefore at large distances, even a pinhole survey such as the HDFS may sample enough volume as to obtain a representative picture. We should always remember, however, that the field size and volume of the HDFS is small.
Capitalizing on the advances in NIR detector capabilities, we took to the In-frared Spectrometer and Array Camera (ISAAC, Moorwood 1997) on the VLT, and observed this tiny field in the NIR Js, H, and Ks filters for more than 100 hours total, and only under the best seeing conditions. The second field, centered on thez= 0.83 cluster MS1054-03, was observed for 80 hours (F¨orster Schreiber et al. 2004a). While not as spectacularly deep, the area surveyed in MS1054-03 is nearly five times larger, and turned out to be a crucial element for its ability to reinforce our findings in the HDFS.
A special asset in the deep imaging set was the Ks−band, the reddest band from the ground where achievable sensitivity and resolution were still somewhat comparable to the space-based optical data. At z∼3 it probes rest-frame wave-lengthsλ∼5400˚A, comfortably redward of the Balmer/4000 ˚A break and therefore crucial to assess the build-up of evolved stars.
color-selection criteria, analogous to those applied to EROs at lower redshift 1< z <2. We selected high-redshift galaxies with the simple color criterion Js−Ks >2.3, specifically designed to target the Balmer/4000 ˚A breaks at redshifts between 2< z <4. While candidate high-redshift galaxies with even redderJ−K colours have been reported by other authors as well (e.g. Scodeggio & Silva 2000; Hall et al. 2001; Totani et al. 2001; Saracco et al. 2001, 2003), the focus was usually on the objects with the most extreme colors. The Js−Ks>2.3 criterion, in fact, is not extreme at all as it corresponds to a U −V color of 0.1 atz = 2.7. Such a selection would include all but the bluest present-day Hubble Sequence galaxies.
2
Outline and Summary
We present in Chapter 2 the FIRES observations of the HDFS, the data re-duction, the assembly of the photometric source catalogs, and the photometric redshifts. These data constitute the deepest groundbased NIR images to date, and the deepest Ks−band in any field, even from space (Labb´e et al. 2003). We released the reduced data, catalog of sources, and photometric redshifts to the community, and they are now in use by many researchers worldwide.
One immediate scientific breakthrough was the identification of a significant population of galaxies with redJs−Ks>2.3 colors atz >2. We find these Distant Red Galaxies, or DRGs as we shall now call them, in substantial numbers, with space densities about half of that of LBGs selected from ground-based imaging (Franx et al. 2003). Our follow-up studies suggested that DRGs, at a given rest-frame optical luminosity, have higher ages, contain more dust, and are more massive than LBGs (Franx et al. 2003; van Dokkum et al. 2004; F¨orster Schreiber et al. 2004),
These galaxies had been previously missed because they are extremely faint in the optical frame UV) and emit most of their light in the NIR (rest-frame optical). Surprisingly, galaxies with comparable colors at 2< z <3.5 were almost absent in HDFN (cf., Labb´e et al. 2003, Papovich, Dickinson, & Ferguson 2001) even though it was surveyed over a similar area and depth (Dickinson 2000). Clearly, cosmic variance due to large scale structure in the universe plays a role here, and the possibility existed that neither of the two fields was representative. Later, our findings in the HDFS were confirmed by the discovery of DRGs at similar densities in the much larger MS1054-03 field (see, e.g., van Dokkum et al. 2003; F¨orster Schreiber et al. 2004).
1.2 Outline and Summary 9
InChapter 3we report the discovery of 6 galaxies in the HDF-S at 1.5.z.3 with colors, morphologies and sizes comparable to local spiral galaxies (Labb´e et al. 2003b). The irregular optical WFPC2 (rest-frame far-UV) morphologies galaxies had previously been misinterpreted, because they traced the sites of unobscured star-formation rather than the underlying evolved population. Here, the combina-tion of bandpass shifting and surface brightness dimming had given an exaggerated impression of evolution towards high redshift. In the NIR, however (rest-frame op-tical), the morphologies were much more regular than in the rest-frame far-UV, withwell resolvedexponential profiles as expected for rotating stellar disks. Mod-els of disk formation in the standard CDM scenario (Mo, Mao, & White 1999) currently underpredict the number of large disks at high redshift by a factor of two. Only larger samples and kinematical studies, to establish the presence of rotating disks, can tell how serious this discrepancy is, and when classical Hubble sequence spiral galaxies came into existence.
InChapter 4we analyze the cosmological growth of the stellar mass density from redshiftz∼3 toz= 0, as traced by optically luminous galaxies in the HDFS. Measuring accurate stellar masses from broadband photometry is quite hard. We resorted to interpreting the mean cosmic colors (U−B)restand (B−V)restusing stellar population synthesis models. We assumed an appropriate star formation history for the universe as a whole, and used the models to derive the global mass-to-light ratioM/LV in theV−band.
We found that the universe at z ∼ 3 had a ∼ 10 times lower stellar mass density than it does today, and half of the stellar mass of the universe was formed byz= 1−1.5, broadly consistent with independent results obtained in the HDFN (Dickinson et al. 2003). Interestingly, the distant red galaxies discovered earlier in the survey may have contributed as much as∼50% to the cosmic stellar mass density atz∼3.
InChapter 5we studied the rest-frame optical color-magnitude distribution of galaxies in the FIRES fields. We focused in particular on the redshift range
z ∼3, where observations in the HDFN showed that blue star-forming galaxies followed a clear trend, such that galaxies more luminous in the rest-frameV−band had slighly redderU−V colors (Papovich, Dickinson, & Ferguson 2001; Papovich et al. 2004). The origin of this color-magnitude relation (CMR) for blue galaxies, or blue sequence, was not clearly understood, even at low redshift (cf., Peletier & de Grijs 1998; Tully et al. 1998; Zaritsky, Kennicutt, & Huchra 1994; Bell & De Jong 2001).
Similarly to studies of the red sequence cluster ellipticals (Bower, Lucey, & Ellis 1992; van Dokkum et al. 1998), we interpreted the scatter around the relation as the result of a spread in ages of the stellar populations. The blue-sequence scatter is fairly narrow, has a conspicuous blue envelope, and skew to red colors. After exploring a range of formation models for the galaxies, we concluded that models with episodic star formation explain most aspects of the z = 3 color-magnitude distribution. The episodic models cycle through periods of star formation and quiescence, rejuvenating the stellar population during each active episode. The result is that the luminosity weighted ages of the stars are smaller than the age of the galaxy, i.e., the time since the galaxy first started forming stars. They may provide a solution of the enigmatic observation thatz= 3 galaxies are much bluer than expected if they were as old as the universe (e.g., Papovich, Dickinson, & Ferguson 2001).
Chapter 6presents a study of the stellar composition of distant red galaxies and Lyman Break galaxies, using mid-IR imaging from IRAC on the Spitzer Space Telescope. Our previous studies indicated that DRGs have higher ages, contain more dust, and are more massive than LBGs at a given rest-frame optical luminos-ity (Franx et al. 2003; van Dokkum et al. 2004; F¨orster Schreiber et al. 2004), and may contribute comparably to the cosmic stellar mass density (Franx et al. 2003; Rudnick et al. 2003). Nevertheless, the nature of their red colors is still poorly understood, and the masses are somewhat uncertain. Are they all truly old, or are some also very young and very dusty? What is the fraction of passively, evolving “dead” systems? How much do the DRGs contribute to the stellar mass density in a mass-selected sample? And how do they relate to the blue Lyman break galaxies. Finally, what is their role in the formation and evolution of massive galaxies?
In this chapter, we present deep IRAC 3.6−8 micron imaging of the HDFS field. The new IRAC data reached rest-frame NIR wavelengths, which were crucial in determining the nature of DRGs in comparison to LBGs. We uniquely identified 3 out of 11 DRGs as old passively evolving systems atz∼2.5. Others were heavily reddened star-forming galaxies, for which we are now better able to distinguish between the effects of age and dust. Furthermore, the rest-frame NIR data allowed more robust estimates of the stellar mass and stellar mass-to-light ratios (M/LK). We found that in a mass-selected sample DRGs contribute 1.5−2 times as much as the LBGs to the cosmic stellar mass density at 2 < z <3.5. Also, at a given rest-frameK luminosity the red galaxies are twice as massive with average stellar masses ∼1011 M
1.3 Conclusions and Outlook 11
3
Conclusions and Outlook
We have presented evidence in this thesis that previous imaging surveys gave a biased view of the early universe. The immediate conclusions of the Faint InfraRed Extragalactic Survey are that large numbers of evolved and dust-obscured galaxies at z = 2−3 have been overlooked, that up to half of the stellar mass in the universe at z= 2−3 was unaccounted for, and that the morphologies of galaxies were misinterpreted.
With the newest optical-to-MIR multiwavelength surveys, we are for the first time obtaining a better census of the massive galaxies in the early universe. We are one step closer to tracing the assembly of massive galaxies directly, and it seems warranted now to interpolate between the properties of galaxies populations at different epochs. Ultimately, that approach will help us to understand how galaxies evolved from the cradle to the present-day.
Even so, for a full comparison with local samples, our data sets are still much too small. If we would dissect the galaxy population by redshift, luminosity, color, morphology, or environment, to analyze galaxy formation in all its complexity, we would be left with few galaxies in every subsample. A straightforward extension of the current work is thus to obtain much larger samples.
Apart from the obvious enlargement of the samples, it is now crucial to follow-up the current samples with high-resolution NIR imaging, and optical and NIR spectroscopy. High resolution NIR imaging allows to unambiguously determine the rest-frame optical morphologies of galaxies to high redshift. Unfortunately, given the limited availability of the Hubble Space Telecope, and the slow survey speed of the NICMOS camera in particular, we must await the arrival of next-generations of space telescopes (e.g., JWST or JDEM) or the maturing of ground-based solutions, such as active optics with laser guide stars. A dearth of high-resolution imaging of distant galaxies will continue to exist for some time to come.
References
Adelberger, K. L., Steidel, C. C., Giavalisco, M., Dickinson, M., Pettini, M., & Kellogg, M. 1998, ApJ, 505, 18
Baugh,C. M., Cole, S., Frenk, C. S., & Lacey, C. G. 1998, ApJ, 498, 504 Bower, R. G., Lucey, J. R., & Ellis, R. S. 1992, MNRAS, 254, 601 Casertano, S. et al., AJ, 120, pp. 2747–2824, 2000
Cimatti, A., et al. 2002, A&A, 391, L1
Cohen, J. G., Cowie,L. L., Hogg, D. W., Songaila, A., Blandford, R., Hu, E. M., & Shopbell,P. 1996, ApJ, 471, L5
Cowie,L. L., Songaila, A., Hu, E. M., & Cohen, J. G. 1996, AJ, 112, 839
Daddi, E., Cimatti, A.,Pozzetti, L., Hoekstra, H., R¨ottgering, H. J. A., Renzini, A.,Zamorani, G., & Mannucci, F. 2000, A&A, 361, 535
Daddi, E., et al. 2003, ApJ, 588, 50
Dickinson, M.,Philos. Trans. R. Soc. LondonA 358, p. 2001, 2000
Dickinson, M., Papovich, C., Ferguson,H. C., & Budav´ari, T. 2003, ApJ, 587, 25 Eddington, A. S. 1916, MNRAS, 76, 525
Efstathiou, G., et al. 2002, MNRAS, 330, L29 Eggen, Lynden-Bell, & Sandage 1962
Ellis, R. S., Colless,M., Broadhurst, T., Heyl, J., & Glazebrook, K. 1996, MNRAS, 280, 235
Elston, R.,Rieke, G. H., & Rieke, M. J. 1988, ApJ, 331, L77
Erb, D. K., Shapley, A. E., Steidel, C. C., Pettini, M., Adelberger, K. L., Hunt, M. P., Moorwood, A. F. M., & Cuby, J. 2003, ApJ, 591, 101
Fontana, A., Poli, F.,Menci, N., Nonino, M., Giallongo, E., Cristiani, S., & D’Odorico, S. 2003, ApJ, 587, 544
Fontana, A., et al. 2003, ApJ, 594, L9 Forster Schreiber et al. 2004,ApJ, accepted Forster Schreiber et al. 2004, in preparation
Franx, M. et al.,The Messenger99, pp. 20–22, 2000
Franx, M. et al. 2003, ApJ, 587, L79 Freedman, W. L., et al. 2001, ApJ, 553, 47
Giavalisco, M. & Dickinson, M. 2001, ApJ, 550, 177
Giavalisco, M., Steidel, C. C., Adelberger, K. L., Dickinson, M. E., Pettini, M., & Kellogg, M. 1998, ApJ, 503, 543
Guhathakurta, P., Tyson, J. A., & Majewski, S. R. 1990, ApJ, 357, L9 Hall, P. B., et al. 2001,AJ, 121, 1840
Hu, E. M. & Ridgway,S. E. 1994, AJ, 107, 1303 Hubble, E. P. 1930, ApJ, 71, 231
Ivison, R. J., Smail, I., Barger, A. J., Kneib, J.-P., Blain, A. W., Owen, F. N., Kerr, T. H., & Cowie, L. L. 2000, MNRAS, 315, 209
Katz, N. & Gunn, J. E. 1991, ApJ, 377, 365
Kauffmann, G., Charlot, S., & White, S. D. M. 1996, MNRAS, 283, Kauffmann, G. & White, S. D. M. 1993, MNRAS, 261, 921
Kauffmann, G., White, S. D. M., & Guiderdoni, B. 1993, MNRAS, 264, 201 Labb´e, I., et al. 2003, AJ, 125, 1107
Labb´e et al 2004, in preparation Larson, R. B. 1975, MNRAS, 173, 671
1.3 Conclusions and Outlook 13
Lowenthal, J. D. et al. 1997, ApJ, 481, 673
Madau, P., Ferguson, H. C., Dickinson, M. E., Giavalisco, M., Steidel, C. C., & Fruchter, A., MNRAS283, pp. 1388–1404, 1996
McCarthy, P. J., etal. 2001, ApJ, 560, L131 Mo, H. J. & Fukugita,M. 1996, ApJ, 467, L9 Moorwood, A. F. 1997, Proc. SPIE, 2871, 1146
Moorwood, A. F. M., van der Werf, P. P., Cuby, J. G., & Oliva, E. 2000,A&A, 362, 9 Papovich, C., Dickinson, M., & Ferguson, H. C. 2001, ApJ, 559, 620
Pettini, M., Kellogg, M., Steidel, C. C., Dickinson, M., Adelberger, K. L., & Giavalisco, M. 1998, ApJ, 508, 539
Pettini, M., Shapley, A. E., Steidel, C. C., Cuby, J., Dickinson, M., Moorwood, A. F. M., Adelberger, K. L., & Giavalisco, M. 2001, ApJ, 554, 981
Pettini, M., Shapley, A. E., Steidel, C. C., Cuby, J., Dickinson, M., Moorwood, A. F. M., Adelberger, K. L., & Giavalisco, M. 2001, ApJ, 554, 981
Rudnick, G. et al. 2001, AJ, 122, 2205 Rudnick, G., et al. 2003, ApJ, 599, 847
Sandage, A. & Visvanathan, N. 1978, ApJ, 223, 707
Saracco, P., D’Odorico, S., Moorwood, A., & Cuby, J. G. 2001, Ap&SS, 276,991 Saracco, P., et al. 2003, A&A, 398, 127
Sawicki, M. & Yee, H. K. C. 1998, AJ, 115, 1329 Scodeggio, M. &Silva, D. R. 2000, A&A, 359, 953
Shapley, A. E., Steidel, C. C., Adelberger, K. L., Dickinson, M., Giavalisco, M., & Pettini, M. 2001, ApJ, 562, 95
Smail, I., Ivison, R. J., Owen, F. N., Blain, A. W., & Kneib, J.-P. 2000, ApJ, 528, 612 Smith, N. 2002, MNRAS, 337,1252
Smith, V. V., et al. 2002, AJ, 124, 3241
Somerville, R. S. & Primack, J. R. 1999, MNRAS, 310, 1087
Songaila, A., Cowie, L. L., Hu, E. M., & Gardner, J. P. 1994, ApJS, 94,461 Songaila,A., Cowie, L. L., & Lilly, S. J. 1990, ApJ, 348, 371
Spergel, D. N., et al. 2003, ApJS, 148, 175
Steidel, C. C., Giavalisco, M., Dickinson, M., & Adelberger, K. L. 1996, AJ, 112, 352 Steidel, C. C., Giavalisco, M., Pettini, M., Dickinson, M., & Adelberger, K. L. 1996, ApJ,
462, L17
Steidel, C. C., Adelberger, K. L., Giavalisco, M., Dickinson, M., & Pettini, M. 1999, ApJ, 519, 1
Steidel, C. C., Adelberger, K. L., Shapley, A. E., Pettini, M., Dickinson, M., & Giavalisco, M. 2003, ApJ, 592, 72
Steidel, C. C. & Hamilton, D. 1992, AJ, 104, 941
Steidel, C. C., Pettini, M., & Hamilton, D. 1995, AJ, 110, 2519 Steinmetz, M. & Navarro, J. F. 2002, New Astronomy, 7, 155
Thompson, R. I.,Storrie-Lombardi, L. J., Weymann, R. J., Rieke, M. J., Schneider, G., Stobie, E., & Lytle, D. 1999, AJ, 117, 17
Totani, T., Yoshii, Y.,Maihara, T., Iwamuro, F., & Motohara, K. 2001, ApJ, 559, 592 Trager, S. C., Faber, S. M., Worthey, G., & Gonz´alez, J. J. 2000, AJ, 120, 165 van Albada, T. S. 1982, MNRAS, 201, 939
van Dokkum, P. G., Franx, M., Kelson, D. D., Illingworth, G. D., Fisher, D., & Fabricant, D. 1998, ApJ, 500, 714
van Dokkum, P. G. et al. 2003, ApJ, 587, L83 van Dokkum, P. G., et al. 2004, ApJ, 611, 703 White, S. D. M. & Frenk, C. S. 1991, ApJ, 379, 52 White, S. D. M. & Rees, M. J. 1978, MNRAS, 183, 341 Williams, R. E. et al. 1996, AJ, 112, 1335
Williams, R. E. et al. 2000, AJ, 120, 2735
Yan, L., McCarthy, P. J.,Weymann, R. J., Malkan, M. A., Teplitz, H. I., Storrie-Lombardi, L. J.,Smith, M., & Dressler, A. 2000, AJ, 120, 575
CHAPTER
TWO
Ultradeep Near-Infrared ISAAC Observations of
the Hubble Deep Field South
observations, reduction, multicolor catalog
and photometric redshifts
ABSTRACT
We present deep near-infrared (NIR)Js, H, andKs-band ISAAC imaging of the WFPC2 field of the Hubble Deep Field South (HDF-S). The 2.50× 2.50
high Galactic latitude field was observed with the VLT under the best seeing conditions with integration times amounting to 33.6 hours inJs, 32.3 hours inH, and 35.6 hours inKs. We reach total AB magnitudes for point sources of 26.8, 26.2, and 26.2 respectively (3σ), which make it the deepest ground-based NIR observations to date, and the deepestKs-band data in any field. The effective seeing of the coadded images is ≈ 0.0045 in J
s, ≈ 000.48 in H, and ≈ 000.46 in K
s. Using published WFPC2 optical data, we constructed a Ks-limited multicolor catalog containing 833 sources down toKtot
s,AB .26, of which 624 have seven-band optical-to-NIR photometry. These data allow us to select normal galaxies from their rest-frame optical properties to high redshift (z .4). The observations, data reduction and properties of the final images are discussed, and we address the detection and photometry procedures that were used in making the catalog. In addition, we present deep number counts, color distributions and photometric redshifts of the HDF-S galaxies. We find that our faintKs-band number counts are flatter than published counts in other deep fields, which might reflect cosmic variations or different analysis techniques. Compared to the HDF-N, we find many galaxies with very red V −H colors at photometric redshifts
1.95 < zphot < 3.5. These galaxies are bright inKs with infrared colors redder than Js−Ks > 2.3 (in Johnson magnitudes). Because they are extremely faint in the observed optical, they would be missed by ultraviolet-optical selection techniques, such as the U-dropout method.
Ivo Labb´e, Marijn Franx, Gregory Rudnick, Natascha M. F¨orster Schreiber, Hans-Walter Rix, Alan Moorwood, Pieter G. van Dokkum, Paul van der Werf, Huub R¨ottgering, Lottie van Starkenburg, Arjen van de Wel, Konrad Kuijken, &
Emanuele Daddi
1
Introduction
I
n the past decade, our ability to routinely identify and systematically studydistant galaxies has dramatically advanced our knowledge of the high-redshift universe. In particular, the efficient U-dropout technique (Steidel et al. 1996a,b) has enabled the selection of distant galaxies from optical imaging surveys using simple photometric criteria. Now more than 1000 of these Lyman break galaxies (LBGs) are spectroscopically confirmed at z &2, and have been subject to tar-geted studies on spatial clustering (Giavalisco & Dickinson 2001), internal kine-matics (Pettini et al. 1998, 2001), dust properties (Adelberger & Steidel 2000), and stellar composition (Shapley et al. 2001; Papovich, Dickinson, & Ferguson 2001). Although LBGs are among the best studied classes of distant galaxies to date, many of their properties like their prior star formation history, stellar population ages, and masses are not well known.
More importantly, it is unclear if the ultraviolet-optical selection technique alone will give us a fair census of the galaxy population at z ∼3 as it requires galaxies to have high far-ultraviolet surface brightnesses due to on-going spatially compact and relatively unobscured massive star formation. We know that there exist highly obscured galaxies, detected in sub-mm and radio surveys (Smail et al. 2000), and optically faint hard X-ray sources (Cowie et al. 2001; Barger et al. 2001) at high redshift that would not be selected as LBGs, but their number densities are low compared to LBGs and they might represent rare populations or transient evolutionary phases. In addition, the majority of present-day elliptical and spiral galaxies, when placed at z ∼ 3, would not satisfy any of the current selection techniques for high-redshift galaxies. Specifically, they would not be selected as U-dropout galaxies because they are too faint in the rest-frame UV. It is much easier to detect such galaxies in the near-infrared (NIR), where one can access their rest-frame optical light.
Furthermore, observations in the near-infrared allow the comparison of galaxies of different epochs at fixed rest-frame wavelengths where long-lived stars may dominate the integrated light. Compared to the rest-frame far-UV, the rest-frame optical light is less sensitive to the effects of dust extinction and on-going star formation, and provides a better tracer of stellar mass. By selecting galaxies in the near-infrared Ks-band, we expect to obtain a more complete census of the galaxies that dominate the stellar mass density in the high-redshift universe, thus tracing the build-up of stellar mass directly.
In this context we initiated the Faint InfraRed Extragalactic Survey (FIRES; Franx et al. 2000), a large public program carried out at theVery Large Telescope
2.2 Observations 17
determine the redshifts of faint galaxies from their broadband photometry alone. While it may be possible to go to even redder wavelengths from the ground, the gain in terms of effective wavelength leverage is less dramatic compared to the threefold increase going from the I to K-band. This is because the Ks-band is currently the reddest band where achievable sensitivity and resolution are reason-ably comparable to deep space-based optical data. Preliminary results from this program were presented by Rudnick et al. (2001, hereafter R01).
Here we present the full NIR data set of the HDF-S, together with aKs-selected multicolor catalog of sources in the HDF-S with seven-band optical-to-infrared photometry (covering 0.3−2.2µm), unique in its image quality and depth. This paper focusses on the observations, data reduction and characteristic properties of the final images. We also describe the source detection and photometric mea-surement procedures and lay out the contents of the catalog, concluding with the NIR number counts, color distributions of sources, and their photometric redshifts. The results of the MS1054-03 field will be presented by F¨orster Schreiber et al. (2002) and a more detailed explanation of the photometric redshift technique can be found in Rudnick et al. (2001, 2002b). Throughout this paper, all magnitudes are expressed in the AB photometric system (Oke 1971) unless explicitly stated otherwise.
2
Observations
2.1 Field Selection and Observing Strategy
The high Galactic latitude field of the HDF-S is a natural choice for follow-up in the near-infrared given the existing ultradeep WFPC2 data in four optical filters (Williams et al. 1996, 2000; Casertano et al. 2000). The Hubble Deep Fields (North and South) are specifically aimed at constraining cosmology and galaxy evolution models, and in these studies it is crucial to access rest-frame optical wavelengths at high redshift through deep infrared observations. Available ground-based NIR data from SOFI on the NTT (da Costa et al. 1998) are not deep enough to match the space-based data. To fully take advantage of the deep optical data requires extremely deep wide-field imaging in the infrared at the best possible image quality; a combination that in the southern hemisphere can only be delivered by the Infrared Spectrometer And Array Camera (ISAAC; Moorwood 1997), mounted on the Nasmyth-B focus of the 8.2 meter VLT Antu telescope. The infrared camera has a 2.50×2.50 field of view similar to that of the WFPC2 (2.70 ×2.70). ISAAC is equipped with a Rockwell Hawaii 1024×1024 HgCdTe array, offering imaging with a pixel scale of 000.147 pix−1 in various broad and
narrow band filters.
Our NIR imaging consists of a single ISAAC pointing centered on the WFPC2 main-field of the HDF-S (α = 22h32m55.464, δ =−60◦33005.0100, J2000) in the
Figure 1 — Shown are the raw data in the filtersJs(dotted lineorcircles), H (dashed line
or squares), andKs (solid lineor triangles). (a)Histogram of the median seeing in the raw
ISAAC images weighted by the weight function of Eq. 2 used to combine the images. (b) Relative instrumental counts in a≈300radius aperture of four bright non-saturated stars in individual
sky-subtracted exposures, plotted against Julian Date. The relative increase in counts, slightly dependent on wavelength, after cleaning and re-aluminization of the mirror directly reflects the increase in efficiency of the telescope, because the sky background levels(c)remained the same. Presumably, the photons were scattered by dirt rather than absorbed before cleaning. (d)Nightly sky variations are largest and most rapid in theH-band and mean sky levels are highest at the beginning and ending of the night. Js-band varies less and peaks at the start of the night,
whereasK-band levels are most stable.
over the redshift range 1 < z < 4. The Js filter is being established as the new standard broadband filter at ≈1.24µm by most major observatories (Keck, Gemini, Subaru, ESO), and is photometrically more accurate than the classical
2.2 Observations 19
sharp edges, practically the same effective wavelength as the normalJ filter, and half-transmittance points at 1.17µm and 1.33µm. We used the Ks filter which is bluer and narrower than standardK, but gives a better signal-to-noise ratio (SNR) for faint sources because it is less affected by the high thermal background of the atmosphere and the telescope. The ISAAC H and Ks filters are close to those used to establish the faint IR standard star system (Persson et al. 1998), while the
Js filter requires a small color correction. The WFPC2 filters that are used are
F300W, F450W, F606W andF814W which we will callU300,B450,V606andI814,
respectively, where the subscript indicates the central wavelength in nanometers.
The observing strategy for the HDF-S follows established procedures for ground-based NIR imaging. The dominance of the sky background and its rapid variability in the infrared requires dithering of many short exposures. We used a 2000 jitter box in which the telescope is moved in a random pattern of Poissonian offsets be-tween successive exposures. This jitter size is a trade-off bebe-tween keeping a large area at maximum depth and ensuring that each pixel has sufficient exposures on sky. Individual exposures have integration times of 6×30 s inJs, 6×20 s inH, and 6×10 s inKs(subintegrations ×detector integration times). We requested service mode observations amounting to 32 hours in each band with a seeing re-quirement of .000.5, seeing conditions that are only available 25% of the time at
Paranal. The observations were grouped in 112 observation blocks (OBs), each of which uniquely defines a single observation of a target, including pointing, number of exposures in a sequence, and filter. The calibration plan for ISAAC provides the necessary calibration measurements for such blocks, including twilight flats, detec-tor darks, and nightly zero points by observing LCO/Palomar NICMOS standard stars (Persson et al. 1998).
2.2 Observations
The HDF-S was observed from October to December 1999 and from April to Oc-tober 2000 under ESO program identification 164.O-0612(A). A summary of the observations is shown in 1. We obtained a total of 33.6, 32.3 and 35.6 hours in
Js,H andKs, distributed over 33,34 and 55 OBs, or 1007,968 and 2136 frames, respectively. This represents all usable data, including aborted and re-executed OBs that were outside weather specifications or seeing constraints. In the re-duction process these data are included with appropriate weighting (see section 3.4). Sixty-eight percent of the data was obtained under photometric conditions and the average airmass of all data was 1.25. A detailed summary of observa-tional parameters with pointing, observation date, image quality and photomet-ric conditions can be found on the FIRES homepage on the World Wide Web (http://www.strw.leidenuniv.nl/~fires).
An analysis of various observational parameters reveals some surprising trends in the data, whereas other expected relations are less apparent. An overview is given in Figure 1. The median seeing on the raw images is better than 0.005 in all bands, with the seeing of 90% of the images in the range 0.004
seen in Figure 1.
Seeing may vary strongly on short timescales but it is not related to any other parameter. The most drastic trend in the raw data is the change of sensitivity with date. Since the cleaning and re-alumization of the primary mirror in March 2000 the count rates of bright stars within a≈300aperture increased by +29% in
Js, +45% inH, and +45%Ks, which is reflected by a change in zero points before and after this date. Because the average NIR sky levels remained the same, this increase proportionally improved the achievable signal-to-noise for background-limited sources. The change in throughput was caused by light scattering, which explains why the sky level remained constant. Sky levels in Js andH, dominated by airglow from OH-emission lines in the upper atmosphere (typically 90 km al-titude), vary unpredictably on the timescale of minutes, but also systematically with observed hour. The average sky level is highest at the beginning and end of each night with peak-to-peak amplitudes of the variation being 50% relative to the average sky brightnesses over the night. The background in Ks is dominated by thermal emission of the telescope, instrument, and atmosphere and is mainly a function of temperature. The Ksbackground is the most stable of all NIR bands and only weakly correlated with airmass; our data do not show a strong ther-mal atmospheric contribution, which should be proportional to atmospheric path length. We take into account the variations of the background and seeing through weighting in the data coadding process.
3
Data Reduction
The reduction process included the following steps: quality verification, flat-fielding, bad pixel correction, sky subtraction, distortion correction, registration, photometric calibration and weighting of individual frames, and combination into a single frame. We used a modified version of the DIMSUM1package and standard
routines in IRAF2 for sky subtraction and coadding, and the ECLIPSE3package
for creating the flatfields and the initial bad pixel masks. We reduced the ISAAC observations several times with an increasing level of sophistication, applying cor-rections to remove instrumental features, scattered light, or clear artifacts when required. Here we describe the first version of the reduction (v1.0) and the last version (v3.0), leaving out the intermediate trial versions. The last version pro-duced the finalJs,H andKsimages, on which the photometry (see section 5) and analysis (see section 8) is based.
1
DIMSUM is the Deep Infrared Mosaicing Software package developed by Peter Eisenhardt, Mark Dickinson, Adam Stanford, and John Ward, and is available via ftp toftp://iraf.noao. edu/contrib/dimsumV2/
2IRAF is distributed by the National Optical Astronomy Observatories, which are operated
by the AURA, Inc., under cooperative agreement with the NSF.
3
2.3 Data Reduction 21
3.1 Flatfields and Photometric Calibration
We constructed flatfields from images of the sky taken at dusk or dawn, grouped per night and in the relevant filters, using the flatroutine in ECLIPSE, which also provided the bad pixel maps. We excluded a few flats of poor quality and flats that exhibited a large jump between the top row of the lower and bottom row of the upper half of the array, possibly caused by the varying bias levels of the Hawaii detector. We averaged the remaining nightly flats per month, and applied these to the individual frames of the OBs taken in the same month. If no flatfield was available for a given month we used an average flat of all months. The stability of these monthly flats is very good and the structure changes little and in a gradual way. We estimate the relative accuracy to be 0.2−0.4% per pixel from the pixel-to-pixel rms variation between different monthly flats. Large scale gradients in the monthly flats do not exceed 2%. We checked that standard stars, which were observed at various locations on the detector, were consistent within the error after flatfielding.
Standard stars in the LCO/Palomar NICMOS list (Persson et al. 1998) were observed each night, in a wide five-point jitter pattern. For each star, on each night, and in each filter, we measured the instrumental counts in a circular aper-ture of radius 20 pixel (200.94) and derived zero points per night from the
magni-tude of that star in the NICMOS list. We identify non-photometric nights after comparison with the median of the zero points over all nights before and after re-aluminization in March 2000 (see section 2.2). The photometric zero points exhibit a large increase after March 2000 but, apart from this, the night-to-night scatter is approximately 2%. We adopted the mean of the zero points after March 2000 as our reference value. See Table 2 for the list of the adopted zero points. By applying the nightly zero points to 4 bright unsaturated stars in the HDF-S, observed on the same night under photometric conditions, we obtain calibrated stellar magnitudes with a night-to-night rms variation of only ≈ 1−1.5%. No corrections for atmospheric absorption were required because the majority of the science data were obtained at similar airmass as the standard star observations. In addition, instrumental count rates of HDF-S stars in individual observation blocks reveal no correlation with airmass. We used the calibrated magnitudes of the 4 reference stars, averaged over all photometric nights, to calibrate every individual exposure of the photometric and non-photometric OBs. The detector non-linearity, as described by Amico et al. (2001), affects the photometric calibra-tion by.1% in theH-band, where the exposure levels are highest. Because the effect is so small, we do not correct for this. We did not account for color terms due to differences between the ISAAC and standard filter systems. Amico et al. (2001) report that the ISAAC H and Ks filters match very well those used to establish the faint IR standard star system of Persson et al. (1998). Only the ISAAC Js filter is slightly redder than Persson’sJ and this may introduce a small color term,
Furthermore, the predicted color correction is small and could not be reproduced with our data. In the absence of a better calibration we chose not to apply any color correction. We did apply Galactic extinction correction when deriving the photometric redshifts, see section 6, but it is not applied to the catalog.
As a photometric sanity check, we compared 200 circular diameter aperture magnitudes of the brightest stars in the final (version 3.0, described below) images to magnitudes based on a small fraction of the data presented by R01. Each data set was independently reduced, the calibration based on different standard stars, and the shallower data were obtained before re-aluminization of the primary mirror. The magnitudes of the brightest sources in all bands agree within 1% between the versions, indicating that the internal photometric systematics are well under control. For the NIR data, the adopted transformations from the Johnson (1966) system to the AB system are taken from Bessell & Brett (1988) and we apply Js,AB=Js,V ega+ 0.90, HAB =HV ega+ 1.38 andKs,AB =Ks,V ega+ 1.86.
3.2 Sky Subtraction and Cosmic Ray Removal
The rapidly varying sky, typically 25 thousand times brighter than the sources we aim to detect, is the primary limiting factor in deep NIR imaging. In the longest integrations, small errors in sky subtraction can severely diminish the achievable depth and affect faint source photometry. The IRAF package DIMSUM provides a two-pass routine to optimally separate sky and astronomical signal in the dithered images. We modified it to enable handling of large amounts of data and replaced its co-adding subroutine, which assumes that the images are undersampled, by the standard IRAF task IMAGES.IMMATCH.IMCOMBINE. The following is a brief summary of the steps performed by the REDUCE task in DIMSUM.
For every science image in a given OB a sky image is constructed. After scaling the exposures to a common median, the sky is determined at each pixel position from a maximum of 8 and a minimum of 3 adjacent frames in time. The lowest and highest values are rejected and the average of the remainder is taken as the sky value. These values are subtracted from the scaled image to create a sky subtracted image. A set of stars is then used to compute relative shifts, and the images are integer registered and averaged to produce an intermediate image. All astronomical sources are identified and a corresponding object mask is created. This mask is used in a second pass of sky subtraction where pixels covered by objects are excluded from the estimate of the sky.
2.3 Data Reduction 23
3.3 First Version and Quality Verification
The goal of the first reduction of the data set is to provide a non-optimized image, which we use to validate and to assess the improvements from more sophisticated image processing. The first version consists of registration on integer pixels and combination of the sky subtracted exposures per OB. For each of the 122 OBs, we created an average and a median combined image to verify that cosmic rays and other outliers were removed correctly, and we visually inspected all 4149 individual sky subtracted frames as well, finding that many required further processing as described in the following section. Finally, we generated the version 1.0 images (the first reduction of the full data set) by integer pixel shifting all OBs to a common reference frame, and coaveraging them into the Js, H and Ks images. While this first reduction is not optimal in terms of depth and image quality, it is robust owing to its straightforward reduction procedure.
3.4 Additional Processing and Improvements
The individual sky subtracted frames are affected by a number of problems or instrumental features, which we briefly describe below, together with the applied solutions and additional improvements that lead to the version 3.0 images. The most important problems are:
• Detector bias residuals, most pronounced at the rows where the read-out of the detector starts at the bottom (rows 1,2, ...) and halfway (rows 513,514, ...), caused by the complex bias behaviour of the Rockwell Hawaii array. These variations are uniform along rows, and we removed the residual bias by sub-tracting the median along rows in individual sky subtracted exposures, after masking all sources.
• Imperfect sky subtraction, caused by stray light or rapid background vari-ations. Strong variations in the backgrounds, reflection from high cirrus, reflected moonlight in the ISAAC optics or patterns of less obvious origin can lead to large scale residuals in the sky subtraction, particularly in Js and H. For some OBs, we succesfully removed the residual patterns by splitting the sequence in two (in case of a sudden appearance of stray light), or subtracting a two-piece cubic spline fit along rows and columns to the background in individual frames, after masking all sources. We rejected a few frames, or masked the affected areas, if this simple solution did not work.
Several steps were taken to improve the quality and limiting depths of the version 1.0 images, the most important of which are:
• Distortion correction of the individual frames and direct registration to the 3×3 blockedI814image (0.11900pixel−1), our preferred frame of reference. We
obtained the geometrical distortion coefficients for the 3rd order polynomial solution from the ISAAC WWW-page4. The transformation procedure
in-volves distortion correcting the ISAAC images, adjusting the frame-to-frame shifts, and finding the linear transformation to the WFPC2 I814 frame of
reference. This linear transformation is the best fit mapping of source po-sitions in the blocked WFPC2I814 image to the corresponding positions in
the corrected Js-band image5. Compared to version 1.0 described in the previous section, this procedure increases registration accuracy and image quality, decreases image smearing at the edges introduced by the jittering and differential distortion. Given the small amplitude of the ISAAC field distortions, the effect on photometry is negligible. In the linear transfor-mation and distortion correction step the image is resampled once using a third-order polynomial interpolation, with a minimal effect of the interpolant on the noise properties.
• Weighting of the images. We substantially improved the final image depth and quality by assigning weights to individual frames that take into account changes in seeing, sky transparency, and background noise. Two schemes were applied: one that optimizes the signal-to-noise ratio (SNR) within an aperture of the size of the seeing disk, and one that optimizes the SNR per pixel. The first improves the detection efficiency of point sources, the other optimizes the surface brightness photometry. The weightswi of the frames are proportional to either the inverse scaled variancezpscalei×variwithin a seeing disk of size si, or to the inverse scaled variance per pixel, where the scalingzpscaleiis the flux calibration applied to bring the instrumental counts of our four reference stars in the HDF-S to the calibrated magnitude.
wi,point∝(zpscalei×vari×s2i)−1 (1)
wi,extended∝(zpscalei×vari)−1 (2)
3.5 Final Version and Post Processing
The final combined Js, H, and Ks images (version 3.0) were constructed from the individually registered, distortion corrected, weighted and unclipped average of the 1007, 968, and 2136 NIR frames respectively. Ultimately, less than 3% of individual frames were excluded in the final images because of poor quality. In this step we also generated the weight maps, which contain the weighted exposure time per pixel. We produced three versions of the images, one with optimized
4ISAAC home page: http://www.eso.org/instruments/isaac 5
2.4 Final Images 25
weights for point sources, one with optimized weights for surface brightness, and one consisting of the best quartile seeing fraction of all exposures, also optimized for point sources. The weighting has improved the image quality by 10–15% and the background noise by 5–10%, and distortion correction resulted in subpixel registration accuracy between the NIR images andI814-band image over the entire
field of view.
The sky subtraction routine in DIMSUM and our additional fitting of rows and columns (see section 3.4) have introduced small negative biases in combined images, caused by systematic oversubtraction of the sky which was skewed by light of the faint extended PSF wings or very faint sources, undetectable in a single OB. Because of this, the flatness of the sky on large scales was limited to about 10−5. The negative bias was visible as clearly defined orthogonal stripes at
P.A.≈6◦, as well as dark areas around the brightest stars or in the crowded parts of the images. To solve this, we rotated a copy of the final images back to the orientation in which we performed sky substraction, fitted a 3-piece cubic spline to the background along rows and columns (masking all sources), re-rotated the fit, and subtracted it. The sky in the final images is flat to a few×10−6 on large
(>2000) scales.
4
Final Images
The reduced NIRJs,H, andKsimages and weight maps can be obtained from the FIRES-WWW homepage (http://www.strw.leidenuniv.nl/~fires). Through-out the rest of the paper we will only consider the images optimized for point source detection which we will use to assemble the catalog of sources.
4.1 Properties
The pixel size in the NIR images equals that of the 3×3 blocked WFPC2 I814
-band image at 0.11900pixel−1. The combined ISAAC images are aligned with the
HST version 2 images (Casertano et al. 2000) with North up, and are normalized to instrumental counts per second. The images are shallower near the edges of the covered area because they received less exposure time in the dithering process, which is reflected in the weight map containing the fraction of total exposure time per pixel. The area of the ISAAC Ks-band image with weight per pixel
wK ≥ 0.95,0.2, and 0.01 covers 4.5,7.2 and 8.3 arcmin2, while the area used for our preferred quality cut for photometry (w ≥0.2 in all seven bands) is 4.7 arcmin2. The NIR images have been trimmed where the relative exposure time
per pixel is less than 1%.
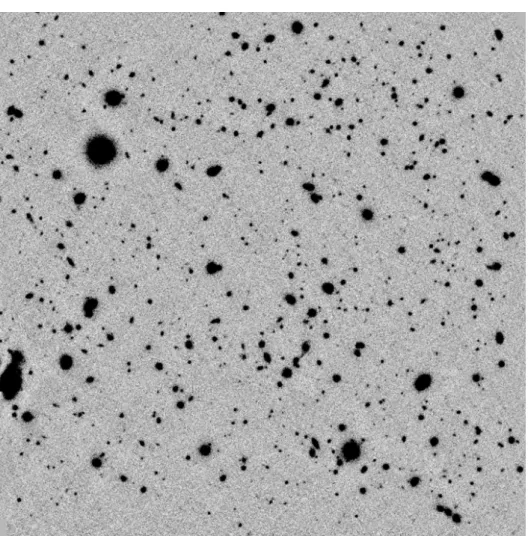
space-Figure 2 — The HDF-S field in the ISAACKs-band divided by the square root of the weight
map (based on the fractional exposure time per pixel) and displayed at linear scaling. The total integration time is 35.6 hours, the stellar FWHM≈000.46 and the total field size is 2.850×2.850.
basedI814 image has been matched to that of the NIR images at FWHM≈000.46
(see section 4.2) and three adjacent WFPC2I814flanking fields have been included
2.4 Final Images 27
Figure 3 —Three-color composite image of the ISAAC field on top of the WFPC2 main-field and parts of three WFPC2 flanking fields. The main-field is outlined in white and North is up. The images are registered and smoothed to a common seeing of FWHM≈ 0.0046, coding
WFPC2 I814 in blue, ISAAC Js in green and ISAACKs in red. There is a striking variety
in optical-to-infrared colors, especially for fainter objects. A number of sources with red colors have photometric redshiftsz >2 and they are candidates for relatively massive, evolved galaxies. These galaxies would not be selected by the U-dropout technique because they are too faint in the observer’s optical.
4.2 Image Quality
The NIR PSF is stable and symmetric over the field with a gaussian core profile and an average ellipticity < 0.05 over the Js, H, and Ks images. The median FWHM of the profiles of ten selected isolated bright stars is 000.45 inJ
s, 000.48H, and 000.46K
For consistent photometry in all bands we convolved the measurement images to a common PSF, corresponding to that of theH-band which had worst effective seeing (FWHM = 000.48). The similarity of PSF structure across the NIR images
allowed simple gaussian smoothing for a near perfect match. The complex PSF structure of the WFPC2 requires convolving with a special kernel, which we con-structed by deconvolving an average image of bright isolated non-saturated stars in theH-band with the averageI814-band image of the same stars. Division of the
stellar growth curves of the convolved images by the H-band growth curve shows that the fractional enclosed flux agrees to within 3% at radiir≥000.35.
4.3 Astrometry
The relative registration between ISAAC and WFPC2 images needs to be very precise, preferably a fraction of an original ISAAC pixel over the whole field of view, to allow correct cross-identification of sources, accurate color information and morphological comparison between different bands. To verify our mapping of ISAAC to WFPC2 coordinates, we measured the positions of the 20 brightest stars and compact sources in all registered ISAAC exposures, and we compared their positions with those in the I814 image. The rms variation in position of
individual sources is about 0.2−0.3 pixel at 0.11900pixel−1 (25−35 mas), but for
some sources systematic offsets between the NIR and the optical up to 0.85 pixel (100 mas) remain. The origin of the residuals is unclear and we cannot fit them with low order polynomials. They could be real, intrinsic to the sources, or due to systematic errors in the field distortion correction of ISAAC or WFPC26. However,
for all our purposes, the effect of positional errors of this amplitude is unimportant. The error in absolute astrometry of the HST HDF-S coordinate system, estimated to be less than 40 mas, is dominated by the systematic uncertainty in the positions of four reference stars (Casertano et al. 2000; Williams et al. 2000).
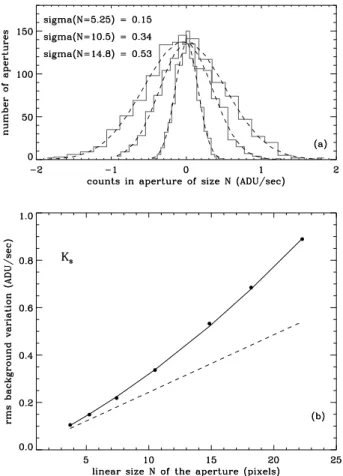
4.4 Backgrounds and Limiting Depths
The noise properties of the raw individual ISAAC images are well described by the variance of the signal collected in each pixel since both Poisson and read noise are uncorrelated. However, image processing, registration and combination have introduced correlations between neighbouring pixels and small errors in the background subtraction may also contribute to the noise. Understanding the noise properties well is crucial because limiting depths and photometric uncertainties rely on them.
Instead of a formal description based on the analysis of the covariance of corre-lated pixel pairs, we followed an empirical approach where we fit the dependence
6The ISAAC field distortion might have changed over the years, but this cannot be checked
because recent distortion measurements are unavailable. The worst case errors of relative posi-tions across the four WFPC2 chips can be 000.1 (Vogt et al. 1997), but is expected to be smaller