THE INSULIN-LIKE GROWTH FACTOR-1 (IGF1) SYSTEM AS A POTENTIAL
BIOMARKER FOR NUTRITIONAL STATUS AND GROWTH RATE IN PACIFIC
ROCKFISH (SEBASTES SPP.)
A Thesis presented to
the Faculty of California Polytechnic State University, San Luis Obispo
In Partial Fulfillment of the Requirements for the Degree Master of Science in Biological Sciences
COMMITTEE MEMBERSHIP
TITLE: The insulin-like growth factor-1 (Igf1) system as a potential biomarker for nutritional status and growth rate in Pacific rockfish (Sebastes spp.)
AUTHOR: Nicole Leslie Hack
DATE SUBMITTED: March 2018
COMMITTEE CHAIR: Sean C. Lema, Ph.D.
Associate Professor, Biological Sciences
COMMITTEE MEMBER: Dean E. Wendt, Ph.D.
Professor and Dean, College of Science and Mathematics
COMMITTEE MEMBER: Brian R. Beckman, Ph.D.
ABSTRACT
The insulin-like growth factor-1 (Igf1) system as a potential biomarker for nutritional
status and growth rate in Pacific rockfish (Sebastes spp.)
Nicole Leslie Hack
Growth performance in vertebrates is regulated by environmental factors including the quality and quantity of food, which influences growth via endocrine pathways such as the growth hormone (GH) / insulin-like growth factor somatotropic axis. In several teleost fishes, circulating concentrations of insulin-like growth factor-1 (Igf1) correlate positively with growth rate, and it has been proposed that plasma Igf1 levels may serve as an indicator of growth variation for fisheries and aquaculture applications. Here, I tested whether plasma Igf1 concentrations might serve as an
ACKNOWLEDGMENTS
The authors thank Rob Brewster for assistance with tank construction, Tom
Moylan and Jason Felton for logistical assistance throughout the experiment, and Gianna
Milano, Meredith Beeson, Kasey Cordova, Frances Glaser, Dante Delaney, Lizzie de
Luca, Thomas Eldib, Ella Abelli-Amen, Christa Lam, Laura Manning, Niki Monjazeb,
Haley Perkins, Rachel Roorda, Emily Sroczynski, Nicholas Wall, Krista Lai, Mel Kasai,
Haley Gonzales, Marie Solis, Jade Wacker, Natalie Miller-Binkley, Sam Farrow, Peter
VanderBloomer, Miguel Jimenez for assistance with animal care. We acknowledge
support from the NOAA IOOS program through CeNCOOS for the ambient temperature
data collected at the Cal Poly Pier (award to R. Walter and D. Wendt, Cal Poly).
This research supported by funding from California SeaGrant (R/HCME-15).
Additional support was provided to N. Hack by California State University’s (CSU)
Council on Ocean Affairs, Science & Technology (COAST), by the Baker-Koob
Endowment, and by College Based Fee support from California Polytechnic State
University. Fish were collected under Scientific Collecting Permit # SC-4793 from the
TABLE OF CONTENTS
Page
LIST OF TABLES ...ix
LIST OF FIGURES ... x
INTRODUCTION ... 1
CHAPTER 1 - Insulin-like growth factor I (IGF-I) as a physiological biomarker for growth rate in juvenile Sebastes rockfishes ... 6
1.1. Abstract ... 6
1.2. Introduction ... 8
1.3. Materials and Methods ...11
1.3.1. Animal collection and husbandry ...11
1.3.2. Species identification ...11
1.3.3. Sequencing of partial cDNAs linked to IGF signaling from olive rockfish ...12
1.3.4. Food ration treatments ...14
1.3.5. Plasma Igf1 quantification ...15
1.3.6. Quantification of Igf system gene transcripts ...15
1.3.7. Statistical Analyses ...17
1.4. Results ...18
1.4.1. Identification of partial cDNAs from olive rockfish ...18
1.4.2. Ration differences generate variation in growth rate ...19
1.4.3. Effect of ration amount on plasma Igf1 concentrations ...19
1.4.5. Ration effects on Igf system-associated mRNAs in
skeletal muscle ...21
1.5. Discussion ...22
1.5.1. Variation in growth related to plasma Igf1 ...23
1.5.2. Growth-related variation in hepatic and muscle Igf1 and Igf2 gene expression ...25
1.5.3. Responses of Igfbp and Igf1 receptor mRNA abundance to ration amount ...28
1.6. Conclusions ...34
1.7. Tables ...35
1.8. Figures ...40
CHAPTER 2 - Spatial and temporal variation in plasma insulin-like growth factor-1 (Igf1) in blue rockfish (Sebastes mystinus) in MPAs ...50
2.1. Abstract ...50
2.2. Introduction ...52
2.3. Methods ...55
2.3.1. Animals ...55
2.3.2. Study Sites ...56
2.3.3. Plasma Igf1 Quantification ...58
2.3.4. Statistical Analyses ...59
2.4. Results ...60
2.4.1. Body size ...60
2.4.2. Plasma Igf1 standardization ...61
2.4.3. Plasma Igf1 variation with habitat protection status ...62
2.5. Discussion ...63
2.5.1. Plasma Igf1 variation with habitat protection status ...64
2.5.2. Environmental influences on plasma Igf1 ...66
2.6. Conclusion ...68
2.7. Tables ...69
2.8. Figures ...70
LIST OF TABLES
Page
1.1 Degenerate primers used for amplification and sequencing of partial
cDNAs from olive rockfish, Sebastes serranoides ...35
1.2 Gene-specific primers for SYBR green quantitative PCR in olive
rockfish ...36
1.3 Mass and length-specific somatic growth rates (SGR) calculated across
different time intervals ...37
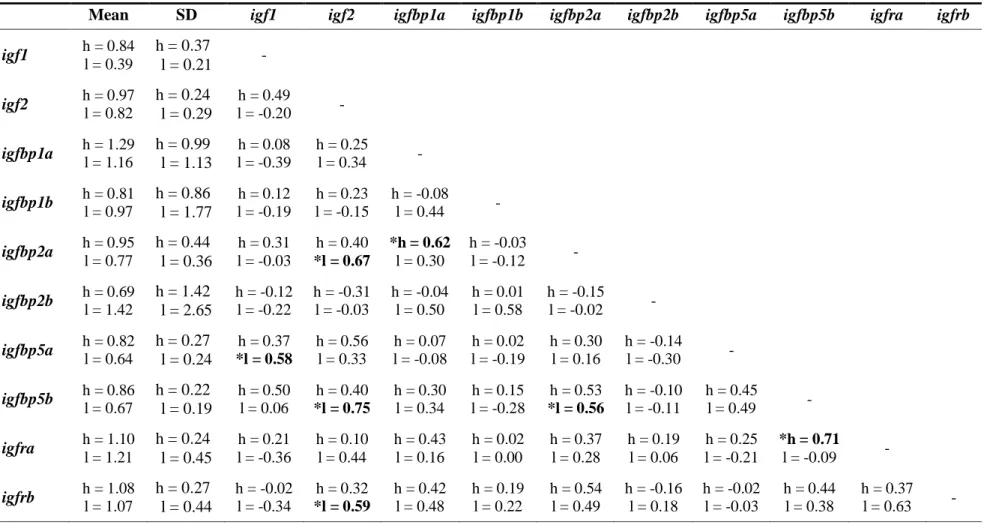
1.4 Liver mRNA gene correlation matrix. Correlations are Pearson’s product-moment correlations. Bolded and stared values indicate
significant correlations (FDR corrected P > 0.05) ...38
1.5 Muscle mRNA gene correlation matrix. Correlations are Pearson’s product-moment correlations. Bolded and stared values indicate
significant correlations (FDR corrected P > 0.05) ...39
2.1 Principal component loadings. Variable in order are wind speed, swell height, wave height, wave cardinal direction, secchi depth, surface
LIST OF FIGURES
Page
1.1. Mean (±SEM) values of (A) mass, (B) standard length, and (C) condition factor for rockfish reared under high ration (4% wet wt.) or low ration (1% wet wt.) conditions. Mass and body condition factor differed between treatments beginning on day 24, while length differed beginning
on day 48 ...40
1.2. High (4%) ration fish (dark gray bars, n = 25) showed a greater (A) mass-specific and (B) length-specific somatic growth rate (SGR) than low (1%) ration fish (light gray bars, n = 26). Bars represent group means
(±SEM) of percent change per day with p-values from student t-tests...41
1.3. Mass and standard length (SL) relations separated by treatment before and after experimental manipulation. Initial measures prior to the
experiment (day 0 - triangles) are lower and have shallower slopes than
final measurements (day 98 – circles) ...42
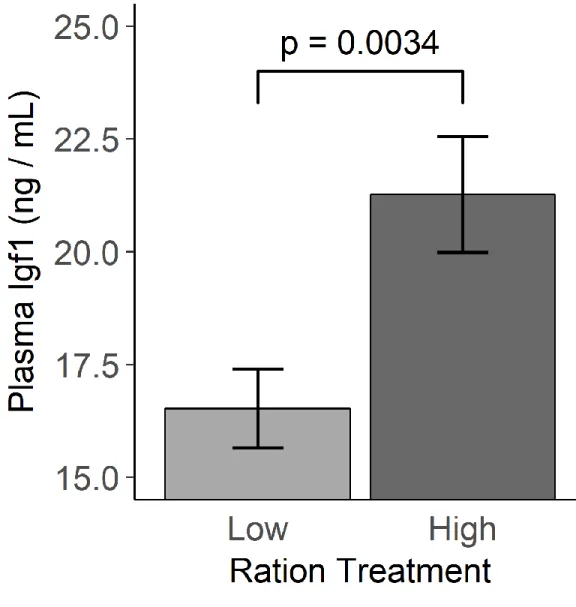
1.4.Comparison of mean (±SEM) plasma total Igf1 concentrations
between high ration (4% wet wt.) and low ration (1% wet wt.) treatments. Rockfish in the high ration treatment (n = 24) had significantly higher
plasma Igf1 than low ration fish (n = 26) ...43
1.5. Individual (A) mass-specific specific growth rate (SGR) and (B) length-specific SGR both correlated positively to plasma Igf1
concentration. SGR values shown are calculated from the body size
change across the entire experimental period (day 0 to 98). Lines represent Pearson correlation relationships for fish from both ration treatments
combined (n = 50) ...44
1.6. Relative hepatic mRNA levels from the high and low ration
treatments. (A) Levels of igf1 and igf2 did not differ between treatments. (B) Transcripts encoding Igf binding proteins igfbp1a and igfbp1b were expressed at higher relative levels in rockfish reared under the low (1%) ration treatment. Data are shown as mean (±SEM) values. Lines indicate significant differences between treatments (Student’s t-test: *P < 0.05,
**P < 0.01, ***P < 0.0001) ...45
1.7. Individual variation in liver igf1 mRNA levels correlated positively with plasma Igf1 concentrations. Pearson’s product-moment correlation line shows the relationship for all fish combined (n = 50). Ration
1.8. Individual variation in liver igf1 mRNA levels correlated positively with plasma Igf1 concentrations within both (A) high (n = 24) and (B) low (n = 19) treatments. Pearson’s product-moment correlation line shows the
relationship for fish in each treatment ...47
1.9. Relative mRNA levels for igf1, igf2, and several genes encoding Igfbps in skeletal muscle of rockfish from the high (4%) and low (1%) ration treatments. (A) Transcript abundance for igf1, but not igf2, was higher in fish from the high ration treatment. (B) Only igfbp5a and
igfbp5b mRNA levels in muscle differed between the two ration treatment groups. (C) There were no differences between treatments for both Igf receptors. Data are plotted as mean (±SEM) values, and lines indicate significant differences between treatments (Student’s t-test: *P < 0.05,
**P < 0.01, ***P < 0.0001) ...48
1.10. Correlation between plasma Igf1 concentrations and relative levels of mRNAs encoding igf1 in skeletal muscle for (A) all fish combined (n = 50), (B) high treatment, and (C) low treatment fish. The line represents a significant Pearson correlation relationship. for Treatments shown for
reference in all fish combined ...49
2.1. Map showing sampling locations in Central California with Marine Protected Areas (MPA) shown in blue. Sampled 500 m2 cells were fished within (1) Piedras Blancas and (2) Point Buchon MPAs and also in
associated reference sites (REF) ...70
2.2. Mean (±SEM) values of total lengths for blue rockfish caught at Piedras Blancas (PBL) and Point Buchon (PBN) within the marine
protected area (MPA) and at adjacent reference sites (REF). Fish caught at Piedras Blancas were significantly larger than those caught at Point
Buchon. Number of samples are indicated inside each bar. Stars indicate significant differences between treatments (Student’s t-test: NS - not
significant, *P < 0.05, **P < 0.01, ***P < 0.0001) ...71
2.3. Mean (±SEM) values of total lengths for blue rockfish caught at (A) Piedras Blancas and (B) Point Buchon within the marine protected area (MPA) and at adjacent reference sites (REF) separated by sampling date. Number of samples are indicated inside each bar. Stars indicate significant differences between treatments (Student’s t-test: NS - not significant, *P <
0.05, **P < 0.01, ***P < 0.0001) ...72
2.4. Linear regression (r2 = 0.066) of total lengths by plasma Igf1
concentrations for all fish combined. Regression and standard error (gray) include both locations and all sampled cells. Protection status only shown
for reference ...73
plasma Igf1 concentrations for all fish combined. Protection status only
shown for reference...74
2.6. Mean (±SEM) values of length standardize plasma Igf1 for blue rockfish caught at (A) Piedras Blancas and (B) Point Buchon within the marine protected area (MPA) and at adjacent reference sites (REF). Stars indicate significant differences between treatments (Student’s t-test: NS -
not significant, *P < 0.05, **P < 0.01, ***P < 0.0001) ...75
2.7. Mean (±SEM) values of length standardize plasma Igf1 for blue rockfish caught at (A) Piedras Blancas and (B) Point Buchon within the marine protected area (MPA) and at adjacent reference sites (REF) separated by sampling date. Number of samples are indicated inside each bar. Stars indicate significant differences between treatments (Student’s
t-test: NS - not significant, *P < 0.05, **P < 0.01, ***P < 0.0001) ...76
2.8. Kernel densities for length standardized plasma Igf1 concentration at Piedras Blancas. Igf1 concentrations are standardized to regional lengths
on paired sampling dates. All dates are shown ...77
2.9. Kernel densities for length standardized plasma Igf1 concentration at Point Buchon. Igf1 concentrations are standardized to regional lengths on
paired sampling dates. All dates are shown ...78
2.10. Individual plasma Igf1 values standardized to total length for all fish caught in Piedras Blancas (PBL) and Point Buchon (PBN) marine
protected areas (MPA) and at adjacent reference sites (REF) separated by
sampling date ...79
2.11. Principal components analysis showing relation of highest
components in relation to Location. Piedras Blancas (PBL, green) exhibits higher wave action (wave height and secchi turbidity) while Point Buchon
(PBN, yellow) has higher temperatures ...80
2.12. Principal components analysis showing relation of highest components in relation to protection status. Marine Protected Areas (MPA) had higher swell and wind speed while reference sites (REF) has
higher turbidity (secchi) ...81
2.13. Principal components analysis showing relation of two highest components in relation to sampling date. August 17, 2016 has notably
high wave height and cloud cover ...82
2.14. Principal components analysis showing relation of two highest components in relation to total length standardized Igf1. Green are higher than expected Igf1 levels for their length and redder points are lower than
2.15. Principal components analysis showing relation of highest components in relation to protection status. Marine Protected Areas (MPA) had higher swell and wind speed while reference sites (REF) has
INTRODUCTION
Over-harvesting of marine species occurs globally and is considered one of the most
detrimental influences of humans on marine ecosystems especially for coastal regions of
California (Gray, 1997; Halpern et al., 2008). Such overexploitation of marine fish and
invertebrates not only leads to collapses in populations of these harvested species, but can
also undermine entire marine ecosystems by changing trophic cascades and triggering
ecological phase shifts in marine communities (e.g. Mumby et al., 2006; Ling et al.,
2009). Additional stressors of variable temperatures, upwelling, and food availability
each can impact fish population dynamics such as recruitment success, reproductive
output, and density-dependent growth (Caselle et al., 2010; VenTresca et al., 1996).
Nutritional stress in the form of reduced food quantity or quality, in particular, severely
affects growth performance in fish thus hampering reproduction and survival. For
populations of marine fishes, the lack of noninvasive metrics for determining spatial and
temporal variation in growth performance has limited the ability to predict variation in
fish stock reproduction and recruitment, along with links to natural changes in prey
availability, temperature, or other environmental factors.
While somatic growth serves as a reliable indicator of individual and population
fitness, this has historically been an evasive measurement in fishes in the wild. Currently,
commonly used methods for quantifying individual growth rates of wild fishes require
terminal sampling (otolith analysis), time consuming tagging (mark-recapture), or have
limited value as indicators of somatic growth (RNA:DNA ratios) (Andrews et al., 2011).
The development of rapid, non-lethal methods for quantifying growth rates is needed to
External environmental influences are translated into changes in growth in part
via the altered secretion of stimulatory or inhibitory hormones within the somatotropic
endocrine axis. Blood hormone concentrations have shown to be easily accessible
indicators of growth regulation and metabolism (Möstl and Palme, 2002). The growth
hormone (GH)/insulin-like growth factor (Igf) system, specifically, has been shown to be
a key regulator of changes in somatic growth with variation in nutritional status (Fuentes
et al., 2013; Picha et al., 2008a; Reindl and Sheridan, 2012). Changes in nutritional
conditions have been shown to alter liver production of the somatomedin hormone Igf1 in
fishes. Given that relationship between Igf1 and nutritional status, it has been proposed
that circulating concentrations of Igf1 may serve as a reliable indicator of recent growth
rate in fishes (Beckman, 2011; Picha et al., 2008a; Reinecke, 2010). In most vertebrates,
insulin-like growth factor-1 (Igf1) is the predominant mediator of growth following
activation of the GH/Igf axis (e.g. Duan, 1997; Perez-Sanchez and Le Bail, 1999;
Reinecke et al., 2005). In brief, GH secreted from the anterior pituitary binds the GH
receptor to stimulate hepatic production of Igf1, which regulates somatic tissue growth by
binding Igf1 receptors in target tissues while exerting negative feedback on pituitary GH
production (Duan et al., 2010; Fuentes et al., 2013; Le Roith et al., 2001; Wood et al.,
2005). Conserved amongst vertebrates, Igf1 regulates growth by promoting cell
proliferation, cartilage growth, and skeletal elongation (Reinecke et al., 2005;
McCormick et al., 1992; Duan, 1997; Chen et al., 2000; Wood et al., 2005). The function
of Igf1 is controlled in part by Igf binding proteins (Igfbps) which modulate the activity
of Igf1 and Igf2 by binding to the hormones thus limiting the amount of Igf hormone
Only a handful of studies have examined the relationship between Igf1 and
growth variation in fishes (Beckman, 2011; Picha et al., 2008a). Variations in growth
caused by manipulated food quantities has been attributed to differences in Igf1
concentrations (e.g., Kelley et al., 2001; Picha et al., 2008a; Reinecke, 2010; Shimizu and
Dickhoff, 2017). It is thought that these changes in plasma Igf1 with food ration result
from GH resistance in the liver, as GH levels tend to be inversely related to Igf1 levels
(e.g., Fox et al., 2006). Positive correlations between plasma Igf1 and growth rate have
been seen in tilapia (Uchida et al., 2003), coho salmon (Beckman et al., 2004a,b), and
chum salmon (Oncorhynchus keta, Kaneko et al., 2015).
Individual variation in hepatic igf1 mRNA levels were correlated with plasma
Igf1 (Gabillard et al., 2003; Pierce et al., 2005) and over all liver igf1 mRNAs have been
shown to decrease in relative abundance in fish experiencing restricted food rations or
fasting conditions in a variety of taxa (Pierce et al., 2005; Vera Cruz et al., 2006;
Monserrat et al., 2007; Kawanago et al., 2014). Although the liver is commonly accepted
as the main tissue of Igf1 synthesis, extrahepatic Igf1 production also appears important
for regulating growth of some tissues via autocrine or paracrine effects (e.g., Firth and
Baxter, 2002; Franz et al., 2016), and can be regulated in a tissue-specific pattern (Eppler
et al., 2010; Fox et al., 2010). Just as in the liver, food restriction has been observed to
alter extrahepatic igf1 mRNA levels in select tissues of fish (Fox et al., 2010; Norbeck et
al., 2007, Peterson and Waldbieser, 2009; Terova et al., 2007). Both Igf1 and Igf2 have
been demonstrated to increase igf1 transcription in cultured myocytes from gilthead sea
shown to respond to acute changes in food intake in Atlantic salmon, rainbow trout, and
tilapia; in these species, igf1 is downregulated by fasting and upregulated immediately
following refeeding (Breves et al., 2016; Bower et al., 2008; Fox et al., 2010; Gabillard et
al., 2006; Monserrat et al., 2007; Picha et al., 2008b).
Igfbps are critical for modulating the effects of Igf hormones, and the ratio of
Igf:Igfbp in circulation plays a critical role in regulating Igf1 availability for receptor
binding (Clemmons, 2016). Igfbp1 proteins – which have been duplicated in teleosts –
are thought to be among of the highest concentration binding proteins in circulation in
fishes, and Igfbp1 has been shown to bind Igf1 with high affinity in several teleost
species (Shimizu and Dickhoff, 2017). The expression of both Igfbp1a (regarded as the
28-32 kDa Igfbp protein in fishes) and Igfbp1b (regarded as the 20-25kDa Igfbp) has
been shown to be altered by nutritional status, sometimes in patterns that appear more
responsive to feeding than even Igf1 in some teleosts (Shimizu et al., 2006; Picha et al.,
2008a). Generally, both Igfbp1a and 1b show elevated hepatic and plasma expression
under nutritional restriction (Shimizu and Dickhoff, 2017). Overexpression of hepatic
Igfbps is generally thought to increase relative Igf1 binding in circulation, thereby
reducing Igf1 stimulation of growth in peripheral tissues (Clemmons, 2016).
Previous experimental studies in juvenile Sebastes rockfishes have shown that
individual plasma Igf1 concentrations correlate positively with individual SGR variation
(Chapter 1; Hack et al., unpub. results), indicating that concentrations of Igf1 can provide
an instantaneous picture of an individual’s relative growth rate in these fishes. Ecological
factors such as water temperature, upwelling intensity, and turbidity influence quantity of
output, recruitment success, and density-dependent growth (e.g., Frank et al., 2007;
Frederiksen et al., 2006; Harley et al., 2006; Hunt and McKinnell 2006; Caselle et al.,
2010; VenTresca et al., 1996; White and Caselle, 2008). Hormonal biomarkers are
currently mostly used within the aquaculture industry to monitor growth and health of
farmed stocks. By expanding the assessment to recreationally and commercially
important species, this tool could be used to measure the regional variation in population
production and size, as well as how these correlate to ecosystem processes, fishing
pressures, and decadal oscillations.
In the present study, we assessed the relationship between circulating Igf1 and
growth rate in olive rockfish, one of several Sebastes rockfishes important as recreational
and commercial groundfish fisheries in the Northern Pacific Ocean. By feeding groups of
juvenile olive rockfish two different ration amounts (1% or 4% wet mass per d) for 98 d,
we intentionally generated differences in SGR, with rockfish given the 4% ration
growing 60% faster in mass and 22% more rapidly in length per day compared to fish
given the 1% ration. We then used these ration-induced differences in growth to evaluate
how growth variation links to changes in circulating Igf1, as well as relative mRNA
levels of igf1 and several other genes encoding proteins involved in the somatotropic
endocrine axis. Finally, we tested the use of this biomarker in the field by measuring
plasma Igf1 concentrations in blue rockfish from within and outside of MPAs along the
CHAPTER 1
Insulin-like growth factor I (IGF-I) as a physiological biomarker for growth rate in
juvenile Sebastes rockfishes
1.1. Abstract
Currently, commonly used methods for quantifying individual growth rates of wild
fishes require terminal sampling (otolith analysis), time consuming tagging
(mark-recapture), or have limited value as indicators of somatic growth (RNA:DNA ratios). The
development of rapid, non-lethal methods for quantifying growth rates is needed to
provide data necessary for informed fisheries management. Blood hormone
concentrations have shown to be accessible indicators of growth regulation and
metabolism. Specifically, insulin like growth factor-I (Igf1) has a low clearance rate and
robust relationship to somatic growth in several fishes, making it a potential endocrine
biomarker of specific growth rate for fisheries applications. Here, we tested whether
plasma Igf1 concentrations could be used as a tractable indicator of somatic growth and
nutritional status in Sebastes rockfishes, a group of species important to commercial and
recreational fisheries on the Pacific coast of N. America. To test associations between
Igf1 and growth rate, we collected juvenile olive rockfish (Sebastes serranoides) from
central California, USA, and reared them in captivity under food rations of 1% (n=27) or
4% (n=26) wet mass per day to experimentally generate growth variation. Fish raised
under higher rations exhibited high plasma total Igf1 concentrations as well as lower
(igfbp1b) and higher skeletal muscle mRNA levels of Igf binding protein-5a (igfbp5a)
1.2. Introduction
Nutritional stress in the form of reduced food quantity or quality affects growth
performance in fish, which in turn can impact population-level processes such as
recruitment success or reproductive output (Caselle et al., 2010; VenTresca et al., 1996).
For populations of marine fishes, the lack of noninvasive metrics for determining spatial
and temporal variation in growth performance has limited the ability to predict variation
in fish stock reproduction and recruitment. The effects of nutritional stress on somatic
growth in fishes, however, are regulated in part via changes in a variety of endocrine
pathways including those involved in the somatotropic, thyroid, and glucocorticoid
endocrine axes (Picha et al., 2008a; Power et al., 2001; Sadoul and Vijayan, 2016; Won
and Borski, 2013), and indices of these endocrine pathways may be useful as biomarkers
for assessing growth variation in fish culture as well as in wild fish stocks.
The growth hormone (GH)/insulin-like growth factor (Igf) system, in particular,
has been shown to be a key regulator of changes in somatic growth with variation in
nutritional status (Fuentes et al., 2013; Picha et al., 2008a; Reindl and Sheridan, 2012). In
most vertebrates, insulin-like growth factor-1 (Igf1) is the predominant mediator of
growth following activation of the GH/Igf axis (e.g. Duan, 1997; Pérez-Sánchez and Le
Bail, 1999; Reinecke et al., 2005). In short, GH secreted from the anterior pituitary binds
the GH receptor to stimulate hepatic production of Igf1, which regulates somatic tissue
growth by binding Igf1 receptors in target tissues while exerting negative feedback on
pituitary GH production (Duan et al., 2010; Fuentes et al., 2013; Le Roith et al., 2001;
Teleost fishes have also evolved at least six types of Igf binding proteins (Igfbps),
which themselves evolved into multiple isoforms following gene duplication events in
some teleost lineages (Daza et al., 2011; Shimizu and Dickhoff, 2017). Igfbps modulate
the activity of Igf1 and Igf2 by binding the hormones and regulating the amount of Igf
hormone available to activate receptors, effectively inhibiting or prompting Igf action.
There is also evidence, however, that some Igfbps have their own biological activity and
can activate Igf1 receptors or other cell-surface or intranuclear proteins (e.g.,
transforming growth factor-5 receptor, peroxisome proliferator-activated receptor )
independent of Igf hormone binding (Baxter, 2015; Chan et al., 2009; Clemmons, 2007,
2016; Duan and Xu, 2005; Huang et al., 2003; Jogic-Brahim et al., 2009).
For fish experiencing food limitation or deprivation, circulating concentrations of
Igf1 decrease while some Igfbps increase, ultimately contributing to reduced muscle and
skeletal growth (e.g., Kelley et al., 2001; Picha et al., 2008a; Reinecke, 2010; Shimizu
and Dickhoff, 2017). Such declines in circulating Igf1 with food restriction have been
observed in a wide variety of fishes, including Mozambique tilapia (Oreochromis
mossambicus,Breves et al., 2014; Uchida et al., 2003), Arctic charr (Salvelinus alpinus,
Cameron et al., 2007), gilthead sea bream (Sparus aurata, Pérez-Sánchez et al., 1995),
and several species of salmonids (Beckman et al., 2004a,b; Bower et al., 2008; Breves et
al., 2016; Kaneko et al., 2015; Pierce et al., 2005; Wilkinson et al., 2006). Igfbp
expression in fishes has also been found to be responsive to variation in food
consumption. Although the number of Igfbp isoforms that have evolved appear to differ
across teleost fish taxa, variation in food availability has been shown to influence
protein levels in blood circulation have been observed to decline in post-smolt coho
salmon, Oncorhynchus kisutch,in the hours after feeding (Shimizu et al., 2009), and
fasted coho salmon were found to have higher plasma Igfbp1 levels than fish not
experiencing food restriction (Shimizu et al., 2006). Mechanistically, at least some of
these nutrition-associated changes in Igfbp expression appear to be caused by inhibition
of Igfbp1 gene expression. This is supported by the observation of elevated mRNAs
encoding the type 1 igfbp gene in the liver of Atlantic salmon, Salmo salar, smolts under
food restriction (Hevrøy et al., 2011). Breves et al. (2016) likewise observed increased
hepatic igfbp1a1 mRNA levels in Atlantic salmon parr fasted for 3 to 10 d.
In this study, the relationships between growth rate and the Igf1 system were
examined in juvenile olive rockfish (Sebastes serranoides) by creating a range of positive
growth rates and exploring differences between experimental treatments as well as
variation that occurred among individuals within treatments. Rockfishes of genus
Sebastes are an important component of commercial and recreational groundfish fisheries
in the northern Pacific Ocean (e.g., Miller et al., 2014; Parker et al., 2000), and several
species are being explored for their economic viability and best rearing practices in
mariculture (e.g., Lee, 2001; Son et al., 2014). Juvenile olive rockfish were reared for 98
d under differing ration levels, and then examined for differences in growth rate, plasma
Igf1 concentration, and the relative abundance of gene transcripts encoding igf1, igf2, as
well as isoforms of type 1, 2 and 5 igfbps in the liver and skeletal muscle. The link
between somatic growth and transcript expression levels was also examined for Igf1
receptors a(igf1ra) and b (igf1rb) in skeletal muscle, to assess how variation in
1.3. Materials and Methods
1.3.1. Animal collection and husbandry
Young-of-the-year juvenile (3-10 mo) olive rockfish (S. serranoides)were
collected from San Luis Bay in Central California, USA between 5 May and 10 July
2016. All fish were collected using a Standard Monitoring Unit for the Recruitment of
Fishes (SMURF) (Ammann, 2004), which was placed under California Polytechnic State
University’s Center for Coastal Marine Sciences pier facility (35°10'12.3"N
120°44'27.2"W). The SMURF was deployed approximately 1 to 3 m below the surface
for durations varying between 3 to 11 (4.35 ± 1.66) days.
Upon collection, juvenile rockfish were transferred to flow-through 340 L tanks
where they were maintained in captivity under ambient salinity (33‰), temperature
(range: 12.4 – 18.9C), and photoperiod conditions. Fish were fed ad libitum daily with
commercial fish pellet feed (BioPro2 pellets, 1.5 mm, BioOregon, Longview, WA, USA)
for at least 3 weeks prior to the start of the experiment. All procedures were approved by
the Institutional Animal Care and Use Committee of California Polytechnic State
University (Protocol # 1504).
1.3.2. Species identification
Juvenile S. serranoides can be difficult to identify to the species level using only
morphological traits, especially from the sympatric congener yellowtail rockfish, S.
flavidus. Therefore a ~369 bp region of the mitochondrial DNA D-loop control region (S.
degenerate primers to the mtDNA D-loop region developed by Hyde and Vetter (2007).
Nucleotide sequences for those primers were as follows: (forward) 5
-CCTGAAAATAGGAACCAAATGCCAG-3, and (reverse) 5
-GAGGAYAAAGCACTTGAATGAGC-3. Genomic DNA was isolated from skeletal
muscle of each fish using the DNeasy Cell and Tissue Kit (Qiagen, Valencia, CA,
USA), and the resulting genomic DNA was amplified in 50 lPCR reactions containing
25 l of GoTaq Colorless Master Mix (Promega Corp., Madison, WI, USA), 18 l
nuclease-free H2O, 1 l each of forward and reverse primer (10 mM), and 5 l of
genomic DNA (69.5-154 ng/l). All reactions were conducted using a thermal profile of
95C for 5 min followed by 38 cycles of 95C for 30 s, 54C for 30 s, and 72C for 1
min, and then a 2 min final extension at 72C. The resulting PCR products were
examined on 1.2% EtBr gels before being cleaned (QIAquick PCR Purification Kit,
Qiagen) and Sanger sequenced (Molecular Cloning Labs, South San Francisco, CA,
USA). The resulting sequences were then aligned using Sequencher v5.1 software
(GeneCodes Corp., Ann Arbor, MI, USA) against existing mtDNA D-loop sequences
from GenBank to confirm species identity.
1.3.3. Sequencing of partial cDNAs linked to IGF signaling from olive rockfish
Total RNA was extracted from the liver and skeletal muscle tissues of an olive
rockfish (86.8 mm standard length [SL], 12.77 g body mass) using TriReagent®
(Molecular Research Center, Inc., Cincinnati, OH, USA) and bromochloropropane for
2.02; P300 NanoPhotometer, Implen, Inc., Westlake Village, CA, USA) and DNase
treated (TURBO DNA-free kit, Life Technologies, Grand Island, NY, USA).
First strand cDNA was generated by reverse transcription (GoScript™ Reverse
Transcription System, Promega) in 20 µl reactions containing 4.88 µg total RNA
template (8 µl), 4 µl 5X buffer, 3 µl MgCl2, 1 µl random primers, 1µl dNTPs, 0.5 µl
RNase inhibitor, 1 µl reverse transcriptase, and 1.5 µl nuclease-free water. Reactions
were incubated at 25 °C for 5 min, 42 °C for 1 h, followed by 70 °C for 15 min to
inactivate the reverse transcriptase enzyme.
Degenerate primers were used to perform PCR to amplify partial cDNAs
encoding igf1, igf2, and the Igf1 receptors igf1ra and igf1rb as well as select igfbps from
olive rockfish (Table 1). Degenerate primers were designed from consensus regions of these genes identified by BLAST search of the genome assemblies for flag rockfish
(Sebastes rubrivinctus, GCA_000475215) and tiger rockfish (Sebastes nigrocinctus,
GCA_000475235), which were the only Sebastes taxa with genomes available at the time of primer design. Partial cDNAs encoding igf1 (accession no. AF481856), elongation factor 1-alpha (ef1, KF430623), and ribosomal protein L17 (rpl17, KF430620) from Schlegel’s black rockfish (Sebastes schlegelii), and igf2 (Y16643) from shorthorn sculpin (Myoxocephalus scorpius) were also used as part of the alignments for primer design.
The resulting partial sequences were aligned using Sequencher v5.1 software
(GeneCodes Corp.) to find consensus nucleotide regions, and degenerate primers were
synthesized by Eurofins Genomics (Louisville, KY, USA).
PCR was performed with degenerate primers in 50 µl reactions containing 25 µl
and reverse primers (10-50 mM), and 21 µl nuclease-free H2O. Reactions were amplified
under a thermal profile of 95 ˚C for 2 min, 37 cycles of 95 ˚C for 30 s, 53 ˚C for 30 s, and
72 ˚C for 1 min and 20 s, succeeded by 2 min of 72 ˚C. PCR products were then tested by
gel electrophoresis on 1.2% agrose gels. Any products that were of expected size were
cleaned (QIAQuick PCR Kit, Qiagen) and Sanger sequenced (Molecular Cloning Labs).
1.3.4. Food ration treatments
Each olive rockfish was implanted intraperitoneally with a passive integrated
transponder (PIT) tag (7 mm, Loligo Systems, Inc., Viborg, Denmark) for individual
identification, which allowed for repeated measurements of standard length (SL, mm)
and body mass (g) from the same fish. Fish were then systematically assigned to one of
six 340 L tanks (0.97 m diameter x 0.48 m depth) to ensure each tank had the same
average wet body mass (2.95 ± 0.12 g, F5,46 = 0.0827, p = 0.9946) prior to commencing
food ration treatments. Tanks were randomly assigned to one of the following two food
rations: 1) high feed (4% mass of feed per fish wet mass; n = 25 fish), or 2) low feed (1%
mass of feed per fish wet mass; n = 27 fish) with three replicate tanks per treatment
group. Each tank contained 7 to 10 fish to allow for social interactions, and fish were fed
1.5 mm pellet feed (BioPro2 pellets, Bio-Oregon®) daily.
Fish standard lengths and weights were measured at day 0 (baseline) and then at
time points of day 24, day 48, day 75, day 91, and day 98 of the experimental treatments
to quantify body size and growth variation. Lengths (SL) and weights were used to
Ricker, 1975; Lambert and Dutil, 1997), as well as specific growth rate (SGR), calculated
as follows (e.g., Lugert et al., 2014):
𝑆𝐺𝑅 = log(𝑚𝑎𝑠𝑠𝑓𝑖𝑛𝑎𝑙− 𝑚𝑎𝑠𝑠𝑖𝑛𝑖𝑡𝑖𝑎𝑙
𝑡𝑜𝑡𝑎𝑙𝑑𝑎𝑦𝑠 × 100)
After 98 days of the experimental ration treatments, fish were euthanized (tricaine
methanesulfonate, MS222, Argent Aquaculture, LLC, Redmond, WA, USA) and blood
was collected by severing the caudal peduncle. Blood was centrifuged at 3,000 x g for 10
min at 4C, and the resulting plasma was collected and stored at -80C. Liver and skeletal
muscle tissues were also dissected from each fish, frozen immediately in liquid N2, and
kept at -80°C until RNA extraction.
1.3.5. Plasma Igf1 quantification
Plasma total (combined bound and unbound to Igfbps) Igf1 concentrations were
determined using a time-resolved fluoroimmunoassay (TR-FIA) with DELFIA assay
reagents (Perkin-Elmer) and anti-Igf1 antiserum to barramundi (Lates calcarifer)
(GroPep BioReagents, Ltd., Thebarton, SA, Australia). This TR-FIA and barramundi
anti-IGF-I antiserum was previously validated for use in Sebastes rockfishes.
1.3.6. Quantification of Igf system gene transcripts
The relative abundance of gene transcripts for igf1 and igf2, Igf1 receptors a
(igfra) and b (igfrb), and isoforms of Igf binding proteins type 1 (igfbp1a, and -1b), type
2 (igfbp2a, and -2b), and type 5 (igfbp5a, and -5b)were quantified in the liver and
Total RNA was extracted from liver and muscle tissues using TriReagent®
(Molecular Research Center, Inc.) and bromochloropropane. RNA was subsequently
DNase treated (TURBO DNA-free kit, Life Technologies) and quantified by
spectrophotometry (260:280 = 2.02, P300 NanoPhotometer, Implen, Inc.). RNA from
each fish was then diluted to 68.6 ngl-1 for liver and 20.8 ngl-1 for skeletal muscle to
standardize total RNA concentrations prior to reverse transcription. RNA was reverse
transcribed in 24 µl reactions with 2.86 µg (liver) or 0.87 µg (muscle) DNase-treated
RNA template (10 µl), 4.8 µl 5X buffer (GoScript™, Promega), 3.775 µl MgCl2 (3.9 mM
concentration), 1.2 µl dNTPs (0.5 mM each dNTP), 1.2 µl random primers, 0.125 µl
RNase (Recombinant RNasin® Ribonuclease Inhibitor, Promega), 0.9 µl GoScript™
reverse transcriptase (Promega), and 2 µl nuclease-free water. Reverse transcription
reactions were conducted at 25˚C for 5 min, 42˚C for 60 min, and then completed with a
reverse transcriptase inactivation at 70˚C for 15 min.
Primers for SYBR Green qRT-PCR were designed to the protein coding regions
of each olive rockfish partial cDNA using the PrimerQuest tool of Integrated DNA
Technologies (Coralville, IA, USA). Primers were also designed to amplify ef1a and
rpl17 for use as reference genes. All primers were synthesized by Eurofins Genomics
(Louisville, KY) and kept at -20℃ until use.
Quantitative real-time PCR assays were conducted in 16 µl reactions with 8 µl
iTaq™ Universal SYBR® Green Supermix (BioRad Laboratories, Inc., Hercules, CA,
USA), 1 µl of both forward and reverse primers (10 mM), 4.5 µl nuclease-free H2O, and
1.5 µl cDNA template. All SYBR Green qRT-PCR reactions were run on a CFX
of 95°C for 2 min, 42 cycles of 95 °C for 5 s and 60 °C for 30 s, followed by 65˚C for 15
s. For each gene, a standard curve was made from a pool of RNA from samples
comprised of fish from both ration treatments. This pooled sample was serially diluted
and each standard concentration assayed in triplicate. Correlation coefficients (r2) for the standard curves were always greater than r2 = 0.96. Melt curve analyses were also performed to confirm amplification of a single product and the absence of primer–dimers
during each quantitative PCR run. PCR efficiencies for each gene were calculated using
the equation: %𝑒𝑓𝑓𝑖𝑐𝑖𝑒𝑛𝑐𝑦 = [10(−1 𝑠𝑙𝑜𝑝𝑒⁄ )– 1] × 100; mean efficiencies are provided in Table 2.
For each gene, relative mRNA levels were calculated using the standard curve
and normalized to the geometric mean of rpl8 and ef-1 mRNA expression. Abundance
values of each gene of interest were then expressed as a relative level by dividing the
resulting values by the mean value of the low treatment group to obtain a value of 1.
Specificity of the primer sets was also assessed by Sanger sequencing select PCR
products for each gene.
1.3.7. Statistical Analyses
Repeated-measures ANOVA models were used to test for effects of ration
treatment on body mass, length, and condition factor (K) over the 98 d experimental
period. There were no within treatment tank effects, which was found by comparing
ANOVA models with and without ‘tank’ as a fixed effect, so ‘tank’ was not considered in
the analysis. Student t-tests were then used to test for differences in mass, length, and
day. Pearson’s correlations were also used to examine relationships between Igf1 and
both mass-specific SGR and length-specific SGR for all fish combined. Associations
between plasma Igf1 concentrations and both hepatic and muscle igf1 mRNA levels for
all fish, as well as within treatments, were tested using Pearson’s correlations.All
statistics were conducted using R v3.3.2 through RStudio v1.0136.
1.4. RESULTS
1.4.1. Identification of partial cDNAs from olive rockfish
Degenerate primer PCR amplified partial cDNAs encoding igf1 (362 bp,
GenBank accession no. MG366820) and igf2 (451 bp, MG366821) for olive rockfish, as well as cDNAs for the following Igfbps: igfbp1a (679 bp, MG366822), igfbp1b (702 bp,
MG366823), igfbp2a (519 bp, MG366824), igfbp2b (678 bp, MG366825), igfbp5a (200 bp, MG366826), and igfbp5b (707 bp, MG366827). Partial cDNAs were also sequenced for the Igf1 receptors a (igf1ra, 426 bp, MG366828) and (igf1rb, 340 bp, MG366829). BLAST analyses using GenBank (https://www.ncbi.nlm.nih.gov/) combined with phylogenetic analysis of the deduced amino acid sequences for the partial cDNAs
encoding Igfbps confirmed the identity of these cDNAs.
Partial sequences encoding 416 bp of the cDNA for elongation factor 1- (ef1)
(MG366830) and 399 bp of a cDNA for 60S ribosomal protein L17 (rpl17) (MG366831) were also amplified and sequenced from olive rockfish for use as internal reference genes
1.4.2. Ration differences generate variation in growth rate
There were no significant differences in body size parameters (mass, standard
length, and condition factor) between rockfish in the two ration treatments at the start of
the experiment (day 0, p > 0.24), prior to commencing feeding. However, fish in the 4%
ration treatment were significantly larger in mass (F1,50 = 58.12, p < 0.001) and body
condition factor (F1,50 = 28.65, p < 0.0001) after 24 d, and were larger in SL (F1,50 =
27.46, p < 0.0001) after 48 d (Fig. 1), compared to fish in the 1% ration treatment. Rockfish in the 4% ration treatment remained larger in mass and length and also
had a higher condition factor until the end of the experiment on day 98 (Fig. 1). As expected by those body size differences, fish in the 4% ration treatment ultimately
exhibited greater mass-specific SGR (F1,50 = 146.77, p < 0.0001) and length-specific SGR
(F1,48 = 59.37, p < 0.0001) compared to fish in the 1% ration treatment (Fig. 2).
Variances in mass were even across all tanks in each treatment prior to the
experiment (F5,46 = 0.397, p = 0.8484) as well as after 98 d of manipulated feed (F5,46 =
1.841, p = 0.1235). Standard lengths similarly showed equal variances in initial (F5,46 =
0.3281, p = 0.8935) and final measurements (F5,46 = 1.299, p = 0.281, Fig. 3).
1.4.3. Effect of ration amount on plasma Igf1 concentrations
Plasma Igf1 concentrations were significantly higher in rockfish from the high
ration treatment (F1,48 = 9.509, p= 0.0034) (Fig. 4). When looking at all fish mass and length specific SGR were both strongly correlated to plasma Igf1 levels (Fig. 5), whereas Igf1 concentrations showed no relationship with change in body condition factor (r =
Mass-specific SGR amongst all fish was more strongly correlated than
length-specific SGR but both correlated to plasma Igf1 concentrations for multiple time periods
(Table 3). All time intervals for mass-specific SGR were correlated to plasma Igf1 except the last 7 days (day 91-98, Table 3). Excluding the last 7 days, SGR for mass became more strongly correlated to Igf1 at later time periods. Length-specific SGR was
significantly correlated to Igf1 concentrations at every time point. There were no
significant correlations within ration treatments.
1.4.4. Regulation of mRNAs encoding Igfs and Igfbps in liver
There was no difference between treatments for transcripts of igf1 (F1,45 = 1.663, p
= 0.2038) or igf2 (F1,45 = 1.366, p = 0.2487) in the liver (Fig. 6A). Of the binding
proteins, igfbp1a (F1,44 = 11.63, p = 0.0014) and igfbp1b (F1,45 = 24.30, p < 0.0001) had
the only differences between treatments with approximately 3 and 4-fold greater
abundance, respectively, in fish from the low ration treatment (Fig. 6B). Liver igfbp2a, igfbp2b,igfbp5a and igfbp5b did not differ in relative mRNA abundance between ration
treatments.
Plasma Igf1 and hepatic igf1 mRNA correlated strongly across all fish (r =
0.5447, p = 0.0001; Fig. 7). Within treatments, Igf1 also correlated to liver igf1 with the low ration having a stronger correlation (r = 0.7031, p = 0.0005; Fig. 8A) than the high ration (r = 0.5537, p = 0.0050; Fig. 8B).
No significant correlations were observed between plasma Igf1 and mRNA levels
for igfbp1a (r = -0.119, p = 0.44), igfbp1b (r = -0.227, p = 0.14), or any other Igfbp gene
amongst liver mRNA transcripts with the low treatment having more correlates than the
high ration treatment (Table 4).
1.4.5. Ration effects on Igf system-associated mRNAs in skeletal muscle
Transcripts encoding igf1 were significantly more abundant in the skeletal muscle
of rockfish in the high ration treatment than in the low ration (F1,44 = 30.50, p < 0.0001)
but igf2 did not differ between treatments (F1,44 = 3.468, p = 0.0692; Fig. 9A). While igfbp1a, igfbp1b, igfbp2a and igfbp2b mRNA levels did not show any differences
between treatments, igfbp5a (F1,44 = 5.963, p = 0.0187) and igfbp5b (F1,45 = 9.919, p =
0.0029) levels where significantly higher in the high ration treatment compared to
respective low treatment fish (Fig. 9B). None of the examined Igf1 receptors showed any difference in mRNA abundance between treatments (Fig. 9C).
Muscle igf1 mRNA abundance correlated to plasma Igf1 when grouping all fish (r
= 0.4880, p = 0.0007; Fig. 10A) but this relationship was driven by rockfish in the high ration treatment only (r = 0.4144, p = 0.0493; Fig. 10B), as the relationship was not significant when fish in the low treatment were analyzed separately (r = 0.1487, p =
0.509; Fig. 10C). Relatively few mRNA transcripts correlated amongst fish in the same treatment but similar to liver tissue, the low treatment had more correlates than the high
1.5. Discussion
Fish in the wild experience shifting conditions of food abundance or quality,
temperature, photoperiod, and other environmental parameters that can affect rates of
development and somatic growth. Such external environmental influences are translated
into changes in growth in part via the altered secretion of stimulatory or inhibitory
hormones within the somatotropic endocrine axis. In particular, changes in nutritional
conditions have been shown to alter liver production of the somatomedin hormone Igf1 in
fishes (Breves et al., 2014; Breves et al., 2016). Given that relationship between Igf1 and
nutritional status, it has been proposed that circulating concentrations of Igf1 may serve
as a reliable indicator of recent growth rate in fishes (Beckman, 2011; Picha et al., 2008a;
Reinecke, 2010).
In the present study, the relationship between circulating Igf1 and growth rate was
examined in olive rockfish, one of several Sebastes rockfishes important as recreational
and commercial groundfish fisheries in the Northern Pacific Ocean. By feeding groups of
juvenile olive rockfish two different ration amounts (1% or 4% wet mass per d) for 98 d,
differences in SGR were intentionally generated, with rockfish given the 4% ration
growing 60% faster in mass and 22% more rapidly in length per day compared to fish
given the 1% ration. Ration-induced differences in growth were then used to evaluate
how growth variation, both between treatments and among all fish, links to changes in
circulating Igf1, as well as relative mRNA levels of igf1 and several other genes encoding
1.5.1. Variation in growth related to plasma Igf1
Juvenile olive rockfish experiencing faster growth under the high ration treatment
exhibited higher plasma Igf1 concentrations. Similar differences in circulating Igf1
concentrations linked to variation in food ration have been observed previously in other
fishes including tilapia (Breves et al., 2014; Uchida et al., 2003), sea bream
(Pérez-Sánchez et al., 1995), and salmon (e.g., Beckman et al., 2004a; Breves et al., 2016; Pierce
et al., 2005). It is thought that these changes in plasma Igf1 with food ration result from
GH resistance in the liver, as there are typically negative correlations between plasma GH
and Igf1 levels in food restricted fish, and positive correlations in fed individuals (e.g.,
Fox et al., 2006). Supporting this idea, olive rockfish displayed a positive correlation
between plasma Igf1 and hepatic igf1 mRNA levels, suggesting that the variation in
plasma Igf1 observed was at least in part a result of variation in hepatic Igf1 production.
Individual variation in plasma Igf1 in olive rockfish correlated positively with
individual variation in growth rate, supporting the previously proposed idea that variation
in circulating Igf1 concentration may serve as a physiological indicator of growth rate
variation across a variety of fishes (Beckman, 2011; Picha et al., 2008a). The strength of
this correlation between plasma Igf1 and growth rate varied from approximately r = 0.29
to 0.43, depending on whether SGR was measured using body length or mass, and
generally was observed as more robust with measurements of mass-specific SGR (Table 3).
To date, only a handful of studies have examined the relationship between Igf1
and growth variation in fishes (Beckman, 2011; Picha et al., 2008a). Igf1 was found to
al., 2004a,b), and chum salmon (Oncorhynchus keta, Kaneko et al., 2015). Generally,
studies that have examined associations between plasma Igf1 concentrations and SGR in
teleost fishes have observed correlations with coefficients within the range of r = 0.26 to
0.76 (Beckman, 2011). While some studies have observed that circulating Igf1 correlates
more robustly with length-specific SGR (Beckman et al., 2004a, see also Beckman,
2011), the data shown here indicates that circulating Igf1 may correlate more strongly to
mass-specific SGR in olive rockfish. Conversely, Igf1 concentrations did not correlate
well with condition factor which agrees with results seen in other teleost fish (Beckman
et al., 2004a).
While the reason for the discrepancy in length- versus mass-specific SGR
correlations is not entirely clear, it is possible that species-level variation in length-weight
growth relationships may lead to differences in which SGR measurements exhibit a more
robust relationship with plasma Igf1 variation. What is more, the relationships between
nutritional status, plasma Igf1, and growth rate can be responsive to conditions such as
day length, salinity, and water temperature (Beckman, 2011). Future studies seeking to
evaluate Igf1 as a physiological indicator of growth variation in rockfishes should
therefore examine both mass- and length-specific SGR in the context of variation in
environmental parameters relevant to the ecological conditions experienced by these
species in the wild.
Interestingly, plasma Igf1 concentrations in olive rockfish also correlated over the
last 7 d of growth to length-specific SGR but not to specific SGR, despite
mass-specific SGR showing strongly correlative relationships at all other measured time
the strongest correlation over the most recent growth history (e.g., Beckman et al.,
2004a). Again, given that somatic growth rates can vary due to a variety of ecological
factors in addition to food ration amount, such as changes in life history stage,
photoperiod, temperature, or toxicants—and that the relative effects of such factors on
growth can vary among species (Beckman et al., 2011; Picha et al., 2008a)—any one of
several factors may have contributed to the weaker statistical relationship between
mass-specific SGR and plasma Igf1 during the last measurement time interval (day 91-98).
Such effects are often linked to variation in feeding efficiency, which can lead to changes
in growth even with equivalent diet composition and food consumption rates (Mingarro
et al., 2002; Vera Cruz et al., 2006). In Pacific rockfishes, growth rate velocities have
been demonstrated to change with development age (Tsang et al., 2007), and both
temperature and body size can impact growth in these taxa (e.g., Boehlert and Yoklavich,
1983; Kamimura et al., 2012). Due to changes in water temperature, fish growth typically
slows in the fall in conjunction with lowered plasma Igf1 levels (Larson et al., 2001;
Mingarro et al., 2002). Given that the last sampling date (day 98) was 21 October 2016 –
and that fish were reared under ambient photoperiod and ocean temperatures – the
absence of a significant correlation between Igf1 and mass-specific SGR across the final
7 d of the experimental period may have resulted from a slowing of growth with the
transition into the fall season.
1.5.2. Growth-related variation in hepatic and muscle Igf1 and Igf2 gene expression
Liver igf1 mRNAs have been shown to decrease in relative abundance in fish
chinook salmon (O. tshawytscha, Pierce et al., 2005), Nile tilapia (O. niloticus, Vera Cruz
et al., 2006), rainbow trout (O. mykiss, Monserrat et al., 2007), and yellowtail (Seriola
quinqueradiata, Kawanago et al., 2014). Studies in other fishes, such as Mozambique
tilapia (Breves et al., 2014) and Atlantic salmon (Breves et al., 2016), however, did not
observe any changes in hepatic igf1 mRNAs when food was withheld. Hepatic igf1
similarly failed to track changes in plasma Igf1 in masu salmon (O. masu) during
compensatory growth (Kawaguchi et al., 2013). The present results with olive rockfish
correspond with those later studies as there was no alteration in liver igf1 mRNA levels
with differences in ration amount or growth rate. However, individual variation in hepatic
igf1 mRNA levels were correlated with plasma Igf1 in olive rockfish, as seen in other fish
species undergoing varied positive growth (Gabillard et al., 2003; Pierce et al., 2005).
Although the liver is commonly accepted as the main tissue of Igf1 synthesis,
extrahepatic Igf1 production also appears important for regulating growth of some tissues
via autocrine or paracrine effects (e.g., Firth and Baxter, 2002; Franz et al., 2016), and
can be regulated in a tissue-specific pattern (Eppler et al., 2010; Fox et al., 2010). Just as
in the liver, food restriction has been observed to alter extrahepatic igf1 mRNA levels in
select tissues of fish (Fox et al., 2010; Norbeck et al., 2007; Peterson and Waldbieser,
2009; Terova et al., 2007). In the current study, rockfish from 4% ration treatments had
elevated relative levels of igf1 mRNAs in skeletal muscle. Both Igf1 and Igf2 have
demonstrated to increase igf1 transcription in cultured myocytes from gilthead sea bream
(Azizi et al., 2016), so the higher muscle igf1 mRNA levels observed in rockfish from the
4% ration treatment may result directly from the higher circulating levels of Igf1 in these
igf1 transcription has also been shown to respond to acute changes in food intake in
Atlantic salmon, rainbow trout, and tilapia; in these species, igf1 is downregulated by
fasting and upregulated immediately following refeeding (Breves et al., 2016; Bower et
al., 2008; Fox et al., 2010; Gabillard et al., 2006; Monserrat et al., 2007; Picha et al.,
2008b).
Monserrat and colleagues (2007) hypothesized that fish muscle igf1 gene
transcription may exhibit a more rapid response capacity than igf1 gene expression in
liver tissue, which might be expected if changes in hepatic GH stimulation results in a
rapid release of Igf1 or Igf2 in advance of any subsequent upregulation of gene
expression for these hormones. Muscle igf1 mRNA levels have been found to change
within days of initiating fasting (Breves et al., 2016; Montserrat et al., 2007) and
refeeding (Chauvigné et al, 2003; Fuentes et al., 2012; Gabillard et al., 2006), while liver
igf1 mRNAs may not change even after 12 weeks of restricted feed (Gabillard et al.,
2003). Alternatively, it is possible that liver igf1 transcription only responds strongly to
severe nutritional stresses, such as complete fasting (Kawanago et al., 2014; Montserrat
et al., 2007; Uchida et al., 2003). Regardless of response rate, locally produced Igf1
seems to play an important role in regulating growth, at least in vertebrates with a
conserved Igf system given that liver Igf1-knockout mice exhibit normal growth (Le
Roith et al., 2001).
While some studies in teleost fishes have observed notable responses of Igf2
signaling in reaction to nutritional deprivation (e.g., Gabillard et al., 2006), olive rockfish
did not display any response in hepatic or muscle igf2 mRNA levels when given a limited
in igf2 mRNA levels in the liver or muscle of rainbow trout under differing feeding
regimes, although this study was conducted on older fish undergoing starvation and may
not be comparable. The majority of studies that looked at igf2 transcription response to
nutritional status focused on testing the effects of extreme nutritional deprivation (i.e.,
fasting) followed by refeeding, and as such it not entirely comparable to the current study
(Bower et al, 2008; Chauvigné et al, 2003; Peterson and Waldbieser, 2009). These
previous findings along with the current findings imply that igf2 gene expression may
only be altered under severe nutritional stress but more research is needed in variation in
positive growth rate.
1.5.3. Responses of Igfbp and Igf1 receptor mRNA abundance to ration amount
Igfbps are critical for modulating the effects of Igf hormones, and the ratio of
Igf:Igfbp in circulation plays a critical role in regulating Igf1 availability for receptor
binding (Clemmons, 2016). In this study only total Igf1 concentrations in plasma were
measured, thus it is impossible to evaluate any changes in the Igf1 bound:unbound ratio
that could result from changes in nutrition and growth rate. Even so, by examining the
relative mRNA abundance of several igfbps in liver and muscle tissue, this study provides
an initial picture of how Igfbp expression is impacted by variation in growth resulting
from differences in food consumption
Igfbp1 proteins – which have been duplicated in teleosts – are thought to be
among of the highest concentration binding proteins in circulation in fishes, and Igfbp1
has been shown to bind Igf1 with high affinity in several teleost species (Shimizu and
protein in fishes) and Igfbp1b (regarded as the 20-25kDa Igfbp) has demonstrated to be
altered by nutritional status, sometimes in patterns that appear more responsive to feeding
than even Igf1 in some teleosts (Shimizu et al., 2006; Picha et al., 2008a). Generally, both
Igfbp1a and 1b show elevated hepatic and plasma expression under nutritional restriction
(Shimizu and Dickhoff, 2017). Juvenile olive rockfish experiencing limited food seem to
follow the same pattern as they had higher hepatic abundance of both igfbp1a and
igfbp1b transcripts.These high levels of hepatic igfbp1a and 1b mRNAs under food
restriction correspond to the findings of previous studies in fasted Atlantic salmon
(Breves et al., 2016), masu salmon (Kawaguchi et al., 2013), and Mozambique tilapia
(Breves et al., 2014).
Overexpression of hepatic Igfbps is generally thought to increase relative Igf1
binding in circulation, thereby reducing Igf1 stimulation of growth in peripheral tissues
(Clemmons, 2016). Due to the lack of response in the olive rockfish liver from all other
binding proteins, it is likely that igfbp1a and igfbp1b play a key role in modulating the
amount of available Igf1 in circulation, ultimately contributing to the observed
differences in growth. In juvenile salmon, for instance, circulating Igfbp1a and Igfbp1b
levels both correlated inversely with growth rate (Kawaguchi et al., 2013). In light of that
relationship, Kawaguchi and coworkers (2013) proposed that plasma Igf1 may serve as a
reliable, positive indicator of growth, while plasma Igfbp1b may be a negative indicator.
In olive rockfish, there were no significant correlations between individual hepatic
igfbp1a or igfbp1b mRNA levels and individual growth rate. Nonetheless, given the
igfbp1a and igfbp1b levels are more sensitive to shifts in food consumption than plasma
Igf1 under some conditions of nutritional stress (Picha et al., 2008a).
Generally, transcripts encoding igfbp1a and igfbp1b are at lower abundance in
skeletal muscle than in liver (Bower et al., 2008; Bower and Johnston, 2010; Breves et
al., 2014; Fuentes et al., 2013; Safian et al., 2012). Because of this, igfbp1 mRNAs are
less frequently measured in muscle tissues from teleosts exposed to food manipulation
experiments, and relatively little is known about the role of extrahepatic Igfbp1
production in regulating muscle growth. There were no observed changes in olive
rockfish muscle igfbp1a or igfbp1b mRNA levels to differences in food ration, even
though both transcripts were at detectable levels in this tissue. Notably, there are
conflicting findings concerning the expressional regulation of igfbp1 mRNAs in skeletal
muscle in fishes, even across studies using the same species. In Atlantic salmon, for
instance, some studies have been unable to detect igfbp1 mRNAs in homogenized
fast-twitch (white) muscle tissue or isolated, cultured myocytes (Bower et al., 2008; Bower
and Johnston, 2010). Other work with this species, however, not only detected igfbp1
transcript expression in this same tissue, but also observed expressional regulation in
response to temperature (Hevroy et al., 2015). These incongruent findings suggest that
muscle igfbp1 expression may vary with several factors besides nutritional status, such as
development age or ecological conditions, which may interact to obscure clear patterns of
igfbp1 regulation in muscle, depending on the experimental testing conditions.
Similar to other teleosts, olive rockfish possess mRNA encoding two distinct
igfbp2 mRNAs (igfbp2a and igfbp2b). In teleosts, igfbp2 transcripts are found at the
Igfbp2 functioning as the primary carrier of Igfs in blood circulation (Shimizu and
Dickhoff, 2017). The role of Igfbp2 in teleost fishes represents a distinct change in the
function of this protein compared to mammals where Igfbp3 is the main transporter of
Igfs (Shimizu and Dickhoff, 2017). Surprisingly, overexpression of Igfbp2 inhibits cell
proliferation and DNA synthesis in both cultured mammalian and zebrafish (Danio rerio)
cells (Duan et al., 1999). Additionally, hepatic igfbp2 mRNA expression is elevated by
GH and suppressed by prolonged food deprivation (Duan et al., 1999; Chen et al., 2014;
Gabillard et al., 2006; Kelley et al., 2001; Safian et al., 2012). This implies that hepatic
Igfbp2 production increases under GH stimulation to help dampen the concurrent release
of Igfs from the liver but is downregulated to shift the bound:unbound ratio of Igfs in
plasma under severe nutritional stresses.
In the rockfish studied here, liver and muscle igfbp2a and igfbp2b mRNA levels
were unaffected by food ration. In studies using other teleosts, expressional regulation of
hepatic igfbp2 transcripts have been observed largely in the context of fasting/refeeding
experimental manipulations. Liver igfbp2 has shown to respond to fasting in several
fishes (Chen et al., 2014; Duan et al., 1999; Safian et al., 2012), although not all species
(Breves et al., 2014; Gabillard et al., 2006). Muscle igfbp2 has also been observed to be
downregulated during fasting in fine flounder (Paralichthys adspersus, Safian et al.,
2012) and rainbow trout (Gabillard et al., 2006), and then return to basal levels after
refeeding. Given that the experimental treatments with rockfish involved differences in
ration amount and not complete food deprivation/fasting, it appears that the severity of
nutritional stress in the 1% ration treatment was insufficient to induce changes in Igfbp2
stress would result in altered hepatic or muscle expression of Igfbp2 mRNAs in rockfish,
as has been observed in other fishes.
Igfbp5 is expressed in many tissues and has been linked to bone growth (Duan et
al., 2005), juvenile development (Salih et al., 2004), and skeletal muscle differentiation
(Ren et al., 2008; Safian et al., 2012). Transcripts encoding igfbp5a and igfbp5b are
present in the liver of many teleost fishes (Breves et al., 2014; Gabillard et al., 2006;
Kamangar et al., 2006; Safian et al., 2012; Pedroso et al., 2009; Zheng et al., 2017), but
have generally not been shown to be sensitive to variation in nutritional status in this
tissue (e.g., Breves et al., 2014; Gabillard et al., 2006). In skeletal muscle, however,
Igfbp5 gene transcription does appear to be regulated by nutrition (Bower et al., 2008;
Bower & Johnston, 2010; Gabillard et al., 2006; MacQueen et al., 2011; Zheng et al.,
2017; but see Amaral & Johnston, 2011). For instance, in fine flounder, muscle igfbp5
mRNAs were downregulated while fasting and upregulated during refeeding (Safian et
al., 2012). Olive rockfish showed elevated mRNA levels for both igfbp5a and igfbp5b in
muscle supporting those previously observed effects of nutritional variation on Igfbp5
expression in this tissue. While the function and mechanism of action for Igfbp5
regulation in muscle remains unclear, Bower and Johnston (2010) observed that amino
acid addition alone led to an increase in igfbp5 expression in cultured myotube cells from
Atlantic salmon, suggesting that specific composition of nutritional variation may in part
influence the dynamics of muscle Igfbp5.
Partial cDNAs were amplified and sequenced encoding two forms of Igf1
receptors (igf1ra and igf1rb) from olive rockfish. Multiple Igf1 receptors have been