145
[Journal of Labor Economics, 2003, vol. 21, no. 1] 䉷2003 by The University of Chicago. All rights reserved. 0734-306X/2003/2101-0005$10.00
Is There a Glass Ceiling in Sweden?
James Albrecht,
Georgetown UniversityAnders Bjo¨rklund,
Swedish Institute for Social Research(SOFI), Stockholm University
Susan Vroman,
Georgetown UniversityUsing 1998 data, we show that the gender log wage gap in Sweden increases throughout the wage distribution and accelerates in the upper tail. We interpret this as a strong glass ceiling effect. We use quantile regression decompositions to examine whether this pattern can be ascribed primarily to gender differences in labor market characteristics or in the rewards to those characteristics. Even after extensive controls for gender differences in age, education (both level and field), sector, industry, and occupation, we find that the glass ceiling effect we see in the raw data persists to a considerable extent.
I. Introduction
Is there a glass ceiling in Sweden? Using micro data from 1998, we find that the gender log wage gap (hereafter simply the gender gap) increases throughout the wage distribution with a sharp acceleration in the upper tail of the distribution. We interpret this as strong evidence of a glass ceiling.
Previous work on the gender gap in Sweden focused on the average We thank seminar participants, especially at the 2000 EALE/SOLE meetings and at IFAU (Uppsala), for helpful comments, Peter Norman for a useful con-versation that led to fig. 4, and Fredrik Andersson for programming advice. Fi-nally, we thank the Swedish Council for Social Research (SFR) for financial support.
log wage gap between men and women. A micro data set containing individual wage data was first available in Sweden in 1968. At that time, the average raw wage gap between men and women was estimated to be almost 30%. The same survey was also carried out in 1981 and 1991. By 1981, the average gender gap had declined by about 10 percentage points, but this gap then remained more or less stable to 1991 and then, according to our data, increased slightly by the end of the 1990s. These developments in the average gender gap appear to have been driven by corresponding developments in the overall wage distribution (Edin and Richardson 2002). The importance of the overall wage distribution for the magnitude of the average gender gap is also emphasized by Blau and Kahn (1996). Their analysis suggests that, in the early 1980s, the markedly larger average gender gap in the United States compared to Sweden could be explained by higher overall U.S. wage inequality.
Several attempts have been made to estimate the extent to which the average gender gap is due to differences in human capital attributes such as schooling and work experience versus the extent to which it is due to differences between genders in wages paid for given attributes. Less than half of the gap can be explained by factors such as differences in years of schooling, experience, and tenure (le Grand 1991; Edin and Richardson 2002). Further, differences in working conditions do not seem to matter at all for the gender gap (Palme and Wright 1992).
All of the above-mentioned work examines only average log wage gaps. This work is interesting, but it cannot address the question of whether women encounter a glass ceiling. By a glass ceiling, we mean the phe-nomenon whereby women do quite well in the labor market up to a point after which there is an effective limit on their prospects. The existence of a glass ceiling would imply that women’s wages fall behind men’s more at the top of the wage distribution than at the middle or bottom. To investigate whether a glass ceiling exists obviously requires that the gender gap be examined in different parts of the distribution.
In this article, we document the existence of a significant glass ceiling effect in Sweden in the 1990s. That is, the average gender gap in Sweden in the 1990s is mainly attributable to the gap at the top of the wage distribution. We examine other wage gaps to see whether this is a general phenomenon. We find that this effect was much less pronounced in the 1981 data and was not at all evident in the 1968 data. Thus, the glass ceiling appears to be a phenomenon of the 1990s in Sweden. We also look at the wage gap between recent immigrants and other workers in Sweden. Unlike the gender log wage gap, the immigrant log wage gap is essentially constant over the entire wage distribution. This suggests that the glass ceiling effect is purely a gender-specific phenomenon. Finally, we look at 1999 data from the United States and do not find a comparable pattern. Indeed, the gender gap at the top of the Swedish wage distribution is
Is There a Glass Ceiling in Sweden? 147 larger than the corresponding gap in the United States despite a much larger average gender gap in the United States.
We then turn to explanations. We examine the extent to which the pattern of gender gaps over the wage distribution can be accounted for by differences between men and women in their characteristics versus differences in the returns to those characteristics. We estimate quantile regressions at various percentiles of the wage distribution as well as sep-arate quantile regressions by gender. Finally, we carry out a Oaxaca-Blinder-type decomposition using quantile methods. This allows us to address our basic question across the wage distribution. Controlling for education (both level and field), age, immigrant status, sector, and industry of employment, we find that gender differences in returns to labor market characteristics are the more important factor. When we add a detailed occupational control, differences in returns still account for most of the gender gap at the bottom of the distribution, but, at the top of the dis-tribution, differences in returns and differences in characteristics each account for about half of the gender gap.
The remainder of the article is organized as follows. In the next section, we describe our data sources. Our findings with respect to the observed gender gaps are presented in a series of figures in Section III. Section IV contains the results of our quantile regressions, both pooled and by gen-der, and our decomposition analysis. The last section contains concluding remarks.
II. Data
We use several Swedish data sets. Our primary data set is the so-called LINDA data. This is a special data set created by Statistics Sweden (SSW) for research purposes (see Edin and Fredriksson 2000). The LINDA data set is based on a random sample in 1994 of approximately three hundred thousand people of all ages.1The sample is followed over time as a panel
and is complemented each year with new immigrants and newly born individuals to make it a nationally representative data set in each year. The variables in LINDA are primarily taken from SSW’s registers. For the 1998 data, SSW ensured that the employers of the complete LINDA sample reported monthly earnings information. We thus have monthly earnings information for all employed persons, except the self-employed. The monthly earnings figures are expressed in full-time equivalents, that is, they give the amount the individual would have earned had he or she worked full time.
1LINDA also contains information about the household members of the sam-pled persons, as well as a special sample of immigrants to Sweden. However, we only use the random sample of the Swedish population, which of course also contains immigrants.
The major advantages of this data source are the earnings data and the large sample size. The drawback is that only a few explanatory variables are available; most notably, actual work experience is missing. On the other hand, there is good information about educational attainment in these data. Specifically, information on educational level and field is taken from SSW’s education register of the population.2
We also use data from SSW for 1992. These 1992 data were collected from employers in the same manner as the LINDA data. Employers reported monthly earnings, working hours, occupation, and some addi-tional information for their employees. These data cover all employed persons in the public sector and parts of the private sector.3For the part
of the private sector that is not completely covered, SSW took a random sample of firms. We took a subsample of the data by applying a subsample weight equal to 0.01 times SSW’s sample weight. This generated a simple random sample of around 29,000 workers.
Finally, we also use data from the 1968, 1981, and 1991 waves of the Swedish Level of Living Surveys (SLLS).4 In contrast to the SSW data,
the SLLS data are based on interviews with individuals. This data source is the one most commonly used in previous research. It contains infor-mation about many determinants of individuals’ wages. In addition to human capital variables such as schooling, work experience, and tenure, the data set provides information about self-reported working conditions as well as several demographic characteristics.5In these data, the hourly
wage is measured using information from a sequence of questions. A question is first asked about the mode of pay, whether it is by hour, by week, by month, by piece rate, and so forth. Conditional on the answer to this question, the next question is about the pay per hour, per week, and so forth. Finally, information about normal working hours is used to compute hourly wages for those who are not paid by the hour. The 2We use seven education levels: Ed1, less than 9 years of education (folkskola and incomplete comprehensive school,grundskola); Ed2, 9 or 10 years of basic education, i.e., comprehensive school (grundskola) or junior secondary school (realskola); Ed3, upper-secondary school for up to 2 years (kortare gymnasium); Ed4, upper-secondary school (high school) for 3 years (la¨ngre gymnasium); Ed5, postsecondary schooling for less than 3 years (kortare universitetsutbildning); Ed6, at least 3 years of postsecondary education (la¨ngre universitetsutbildning); Ed7, completed doctoral degree (forskarutbildning). In some estimations, we also use field of education, namely (1) general education; (2) arts, humanities, and religion; (3) teacher training; (4) administration, economics, social science, and law; (5) industry and technology; (6) transport and communication; (7) health; (8) agri-culture, forestry, and fishing; (9) service and defense; and (10) unspecified.
3For more information, see Statistics Sweden (1992). 4For more information, see Erikson and A˚ berg (1987).
5The 1991 SLLS data also contain information on education from Statistics Sweden’s education register.
Is There a Glass Ceiling in Sweden? 149 drawback of the SLLS is its small sample size. The survey is basically a representative sample of one per thousand of the population aged 15–75 years (18–75 in 1991) in each year. This yields roughly 3,000 observations of employed male and female workers in each year.
Table 1 summarizes the five different samples that we use. The data from the three waves of the SLLS show that the average gender gap declined from 33% in 1968 to 18% in 1981 and then rose somewhat to 20% in 1991.6 All wages are in nominal terms. Note also that the SLLS
and SSW wage data are expressed in different units, namely, hourly and monthly, respectively. The well-known overall wage compression that took place during the 1970s is demonstrated by the fact that both the standard deviation of the log wage and the 90/10 percentile ratio fell sharply from 1968 to 1981 for both men and women. That the 90/50 and 50/10 percentile ratios declined as well shows that the compression took place in both parts of the wage distribution. In terms of explanatory variables in the SLLS data, there are almost no gender differences in years of schooling, but, as expected, men have more work experience than women, even though the differential is falling over time. Further, men more often work in the private sector.
The data from Statistics Sweden show a smaller average gender gap in the early 1990s—15% in 1992 compared to 20% in the 1991 wave of the SLLS. Further, both the standard deviation of the log wage and the per-centile ratios reveal less wage inequality in the SSW data. Even though there is a year and a half between the data collection points—the SLLS data were collected in the spring of 1991, and the SSW wages refer to the fall of 1992—the differences are more likely due to differences in mea-surement than to changes in the real wage structure. It is not clear which wage data are more reliable.7 Both data sources probably suffer from
measurement error. We estimate wage equations with identical regressors and find that the explanatory power is somewhat higher in the SSW data (see app. table A1). This finding, together with the lower wage inequality in the SSW data, is consistent with less classical measurement error in these data.
From 1992 to 1998, earnings inequality increased in all the dimensions reported in table 1. The standard deviation of log wages as well as the P90/P50 and P50/P10 ratios rose for both men and women. The average gender gap rose slightly from 15% to 16%. Further, educational attain-ment rose over the 1990s, so that a larger fraction of women than men had long university training (level 6) in 1998.
6These gender gaps are, in fact, log wage differences. We refer to them as percents and will continue to do so through the rest of the article, even though a log difference of 0.33 corresponds to a 39.1% gap.
150
SLLS 1968 SLLS 1981 SLLS 1991 SSW 1992 SSW 1998
Men Women Men Women Men Women Men Women Men Women
Log wage 2.41
(.442) 2.08(.470) 3.66(.308) 3.48(.276) 4.44(.312) 4.24(.241) 9.64(.282) 9.49(.196) 9.87(.320) 9.71(.223)
P90/P10 2.59 2.46 1.97 1.65 2.05 1.71 1.96 1.56 2.13 1.63
P90/P50 1.73 1.63 1.63 1.34 1.54 1.38 1.55 1.32 1.65 1.35
P50/P10 1.50 1.51 1.28 1.23 1.33 1.24 1.26 1.18 1.29 1.21
Age 39.9
(14.2) (14.0)38.4 (12.7)39.2 (12.3)38.6 (12.1)39.7 (12.1)39.6 (11.7)40.1 (11.6)41.1 (11.8)41.1 (11.6)41.9 Years of work experience 23.0
(15.0) (11.8)14.7 (13.8)20.6 (10.9)15.4 (13.0)20.1 (10.8)16.8 N.A. N.A. N.A. N.A. Years of schooling 8.63
(2.92) (2.69)8.66 10.7(3.59) 10.3(3.15) 11.7(3.33) 11.5(2.91) N.A. N.A. N.A. N.A. Private sector .762
151
Ed1 N.A. N.A. N.A. N.A. .141
(.349) (.314).111 (.351).143 (.324).120 (.283).088 (.249).064
Ed2 N.A. N.A. N.A. N.A. .110
(.313) (.321).117 (.320).116 (.318).114 (.324).119 (.304).103
Ed3 N.A. N.A. N.A. N.A. .358
(.479) (.492).409 (.472).334 (.486).383 (.465).317 (.477).350
Ed4 N.A. N.A. N.A. N.A. .153
(.360) (.320).116 (.354).146 (.308).106 (.392).190 (.355).148
Ed5 N.A. N.A. N.A. N.A. .116
(.320) (.343).136 (.336).129 (.360).153 (.347).140 (.381).176
Ed6 N.A. N.A. N.A. N.A. .108
(.310) (.311).108 (.325).120 (.327).122 (.339).132 (.360).153
Ed7 N.A. N.A. N.A. N.A. .015
(.120) (.060).004 (.105).011 (.055).003 (.113).013 (.069).005 No. of observations 1,894 1,191 1,822 1,659 1,655 1,663 14,266 15,015 49,780 48,407
Note.—Standard deviations are in parentheses.SLLSpSwedishLevel of Living Surveys;SSWpStatisticsSweden. Educational levels: Ed1plessthan 9 years of education (folkskolaand incomplete comprehensive school,grundskola); Ed2p9or 10 years of basic education, i.e., comprehensive school (grundskola) or junior secondary school (realskola); Ed3pupper-secondary school for up to 2 years (kortare gymnasium); Ed4pupper-secondary school (high school) for 3 years (la¨ngre gymnasium); Ed5ppostsecondaryschooling for less than 3 years (kortare universitetsutbildning); Ed6pat least 3 years of postsecondary education (la¨ngre universitetsutbildning); Ed7pcompleteddoctoral degree (forskarutbildning). N.A.pnotavailable.
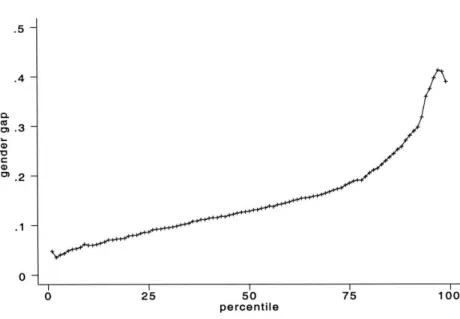
Fig.1.—Gender log wage gap, Sweden, 1998
III. Basic Log Wage Gaps—Figures
In this section, we present some of our basic findings using a series of figures. Our main finding is that the gender gap in Sweden is much larger at the top of the distribution than at the bottom. This pattern is char-acteristic of the 1990s. A similar pattern, although not as pronounced, is present in 1981, but data from 1968 do not show this pattern. We also examine the immigrant-nonimmigrant wage gap in Sweden in 1998 but find that the gap is essentially constant throughout the distribution. We take this as evidence that a gap that increases as one moves up the wage distribution is a gender-specific phenomenon. Finally, this phenomenon seems to be much more important in Sweden than it is in the United States.
Figure 1, which is based on the 1998 data, shows the observed gender gap at each percentile in the wage distribution. Thus, for example, at the seventy-fifth percentile, we see a gender gap of slightly less than 20%. That is, the log wage of the man at the seventy-fifth percentile of the male wage distribution is a bit less than 20 points above the log wage of the female at the seventy-fifth percentile of the female wage distribution. The important features of this figure are (i) male and female wages are close to equal at the bottom of the wage distribution, (ii) male and female wages are extremely unequal (up to a maximum log wage difference of about 0.4) at the top of the distribution,8 (iii) there is a steady increase 8Note that a log wage gap of .4 is equivalent to a raw wage gap of about 50%.
Is There a Glass Ceiling in Sweden? 153
Fig.2.—Gender log wage gap, Sweden, 1992
in the gender gap as we move up in the wage distribution, and (iv) there is a sharp acceleration in the increase in the gender gap starting at about the seventy-fifth or eightieth percentile in the wage distribution. It is this final aspect of the gender gap by percentile that we interpret as a glass ceiling.
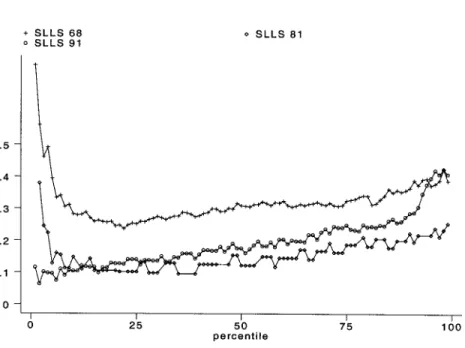
The same basic patterns can be seen in the figure based on the 1992 SSW data (fig. 2). Relative to 1998, the 1992 data show a bit less overall inequality but a slightly stronger glass ceiling effect. Figure 3 shows the gender gap by percentile using the 1968, 1981, and 1991 SLLS data sets. The same basic patterns can also be seen in the 1991 SLLS data set, although there are a few notable differences; namely, there is a bit more inequality between men and women at the bottom of the distribution, a bit less inequality at the top of the distribution, and a later (around the eighty-seventh percentile) break point for the strong acceleration in male/ female wage inequality. The pattern observed for the 1981 wage distri-bution is different. The log wage gap increases as we move up the dis-tribution, but the sharp acceleration in the gap that we interpret as a glass ceiling effect is not present. There is also greater wage inequality at the bottom of the distribution. Finally, in 1968, the nature of the gender gap is strikingly different. In that year, the most important gap between men and women is at the bottom of their respective distributions. It should be noted that the gender gaps shown in figure 3 are based on many fewer observations than are the corresponding gaps in figures 1 and 2.
Fig.3.—Gender log wage gaps, Sweden, 1968, 1981, 1991
wage equalization efforts by Swedish unions. Centrally determined wage agreements contained clauses giving extra wage increases to members with low wages (Hibbs and Locking 1996). These efforts were particularly strong during the 1970s and continued into the mid-1980s, and the de-crease in the gender gap in the bottom of the distribution from 1968 through the early 1990s is consistent with a general attempt at wage compression. To understand the spreading in the gender gap at the top of the distribution, one might also look for a general cause. One such cause might be that the Swedish labor market is discriminatory at the top in general, but, as figure 4 shows, the immigrant log wage gap does not expand at the top of the distribution.9 Instead, this gap is essentially
constant across all percentiles. Thus, it appears that the glass ceiling effect is a gender effect.
To put the 1990s patterns in the Swedish gender gap in perspective, it is useful to compare them with the corresponding U.S. patterns. Figure 5 gives the U.S. gender gap by percentile as observed in the March 1999 Current Population Survey (CPS).10For most percentiles, the gender gap
is larger in the United States than in Sweden (as one would expect, since the percentage difference between average male and female wages is larger 9We define an immigrant to be someone not born in Sweden and who came to Sweden in 1987 or later. The result shown in fig. 4 does not appear to be sensitive to changes in the definition of immigrant.
Fig.4.—Immigrant log wage gap, Sweden, 1998
in the United States than in Sweden), but the gender gap is very much larger in Sweden than in the United States at the top of the wage distri-bution. The strong dip in the gender gap at the bottom of the distribution is likely attributable to the minimum wage; the dip at the very top of the distribution is probably caused by top coding.11 Top coding appears to
affect less than 1% of the individuals in the CPS, but this 1% figure will understate the problem if most of the top coding applies to wages paid to males, as one would expect. However, if we look at the seventy-fifth through the ninetieth percentiles, the figure differs greatly from the Swed-ish pattern.12
Our figure 5 is comparable to figure 2ain Fortin and Lemieux (1998). They used data from the outgoing rotation groups in the 1991 Current Population Surveys on individuals’ usual weekly or hourly earnings from their main jobs for their analysis. Note that Fortin and Lemieux used hours-weighted wages, whereas our wages are unweighted. Nonetheless, the pattern shown in their paper is essentially the same as that shown in figure 5. We interpret these graphs as indicating that the glass ceiling effect is stronger in Sweden than in the United States.
A potential explanation for the patterns observed in figures 1–3 is a compositional one. During the 1970s and early 1980s, average labor mar-ket prospects improved for women relative to men. This implies that the average log wage gap between older men and older women in the 1990s is larger than the corresponding gap for younger men and younger women. Since wages increase with experience, older workers will tend on average to have higher wages than younger workers. The combination of these two factors could generate an upward-sloping gender gap.
The gender gaps for three cohorts are shown in figure 6. The lowest profile is for the youngest cohort of workers in the 1998 data, namely, those workers between the ages of 18 and 33. The other two profiles, those for workers aged 34–49 and 50–65, are very similar to each other and very different from the profile for the youngest workers in the upper tail of the distribution. Since the older workers are, on average, more highly paid than their younger counterparts, the fact that the latter two profiles lie above the one for the youngest cohort accounts for an in-creasing gender gap. This effect, while potentially important, does not explain the sharp acceleration in the gender gap that we see at the top of the 1990s distributions. Rather, this acceleration simply reflects the gender
11There is no top coding in the Swedish data.
12A similar analysis performed by Bonjour and Gerfin (2001) for the Swiss economy finds a smaller gender gap at the top of the distribution than at the bottom.
Is There a Glass Ceiling in Sweden? 157
Fig.6.—Gender log wage gap by cohort, 1998
log wage profiles of the oldest two cohorts.13In addition, if composition
explained the glass ceiling effect in Sweden, then one would expect it to also produce a glass ceiling effect in the U.S. data, where average wages for women relative to those for men have also increased over time. Since the U.S. pattern is so different from the Swedish pattern, the compositional argument does not seem compelling. Accordingly, we now investigate the traditional explanations for the gender gap, namely, that men and women differ in terms of their labor market characteristics and/or the rewards to these characteristics.
IV. Quantile Regression Results
In this section, we first present a series of quantile regressions to in-vestigate the extent to which the gender gap at various percentiles can be explained by individual differences in labor market characteristics. In do-ing this, we impose the restriction that men and women are paid the same rewards for their labor characteristics. We next estimate separate quantile regressions for men and for women to examine the extent to which the returns to the various labor market characteristics at various percentiles 13The fact that the gender gap does not accelerate in the upper tail of the distribution for the youngest cohort might be taken as evidence that these workers do not face a glass ceiling, but, of course, one must take into account that younger workers are in the early part of their careers before age-earnings profiles typically fan out.
differ by gender. Finally, we carry out a decomposition analysis to identify the extent to which the gender gap at various percentiles can be explained by differences between the genders in characteristics versus differences in labor market rewards to those characteristics.
Quantile regression is a technique for estimating thevth quantile of a random variabley(log wage in our application) conditional on covariates. The quantile regression model (see, e.g., Koenker and Bassett 1978 or Buchinsky 1998) assumes that the conditional quantile ofy,qv, is linear
in x; that is, q pxb(v). The coefficient vector b(v) is estimated as the
v
solution to
min
{
冘
vFyi⫺xib(v)F⫹冘
(1⫺v)Fyi⫺xib(v)F}
. !i:y≥xb(v) i:y xb(v)
b(v) i i i i
The advantage of quantile regression over, say, ordinary least squares is that it allows one to estimate the marginal effect of a covariate on log wage at various points in the distribution, that is, not just at the mean. Thus, for example, quantile regression allows us to estimate the effect of gender, age, education, and so forth on log wage at the bottom of the log wage distribution (e.g., at the tenth percentile), at the median, and at the top of the distribution (e.g., at the ninetieth percentile). In log wage quan-tile regressions, the coefficient estimates,b(v), are interpreted as the es-timated returns to individual characteristics at thevth quantile of the log wage distribution.
A. Pooled Quantile Regressions with Gender Dummies
We begin by investigating the extent to which the difference between the male and female log wage distributions can be attributed to differences in the characteristics that men and women bring to the labor market. Table 1 suggests three differences that are worth investigating. First, men typically have more years of work experience than women do, for ex-ample, an average of 20.1 years of work experience for men versus 16.8 years for women in the 1991 SLLS data. Unfortunately, we lack a direct measure of experience in the SSW data. Second, although male and female educational attainments are essentially the same in terms of years of schooling, there are some potentially important differences in the types of education completed by men and women. For example, men are much more likely than women are to have completed a doctoral degree. We also have detailed data in 1998 on field of education that we can examine to see whether differences in education field account for some of the gender gap. Third, men are much more likely than women are to work in the private sector. In the 1998 data, 72.0% of the men versus 39.3% of the women work in the private sector. In addition to sector, we have
Is There a Glass Ceiling in Sweden? 159 detailed information in the 1998 data on industry of employment and occupation.
To examine the effects of differences in characteristics on the gender gap at different points in the distribution, we carry out a series of quantile regressions on the pooled 1998 data set, that is, the combined male and female data sets. These pooled quantile regressions impose the restriction that the returns to included labor market characteristics are the same for the two genders. The estimated gender dummy coefficients in these re-gressions thus indicate the extent to which the gender gap remains un-explained at the various quantiles when we control for individual differ-ences in various combinations of characteristics.
Table 2 presents the estimated gender dummy coefficients at the fifth, tenth, twenty-fifth, fiftieth, seventy-fifth, ninetieth, and ninety-fifth per-centiles using the pooled 1998 data. We also present the corresponding estimated gender dummy coefficients from ordinary least squares (OLS) regressions for comparison. The first panel shows the raw gender gap without any control variables. The coefficient estimates for the gender dummy in this panel are (necessarily) identical to the log wage gaps one could read in figure 1. The advantage of quantile regression in this context is that we can attach standard errors to the estimated gender gaps at the various percentiles. As we saw in figure 1, the gender gap increases as we move up the wage distribution with a particular acceleration after the seventy-fifth percentile. We tested pairwise equality of adjacent coeffi-cients (e.g., equality of the gender dummy coefficoeffi-cients at the fifth and tenth percentiles) and carried out anF-test for equality of all seven gender dummy coefficients. The hypothesis of equality is overwhelmingly re-jected (i.e.,p-value≈0) in all cases. Of course, this strengthens the point illustrated by figure 1, namely, that just looking at the average gender gap (16.2%—the OLS estimate) is inadequate.
Panel 2 in table 2 presents quantile regression estimates of the gender dummy coefficient when age, age squared, the basic education variables (i.e., Ed1–Ed7), and an immigrant dummy are added as controls. We begin with these basic regressors for two reasons. First, age (at least when a direct measure of experience is unavailable) and education are the two variables that are universally used in log wage regressions. Second, these variables and immigrant status, unlike other variables such as field of education, sector, industry, and occupation, are clearly exogenous.
The gender dummies in these regressions are interpreted as the effects of gender on log wage at the various percentiles once we control for individual differences in these basic labor market characteristics. Inter-estingly, when we control for age, education, and immigrant status, the gender dummies increase in absolute value relative to the raw gender dummies from the fifth through the seventy-fifth percentiles. The OLS gender dummy coefficient also increases. One reason is that in the 1998
5th 10th 25th 50th 75th 90th 95th OLS Observed gender gap (np98,200) ⫺.048
(.0025) ⫺(.0013).065 ⫺(.0016).098 ⫺(.0017).133 ⫺(.0031).198 ⫺(.0029).336 ⫺(.0073).387 ⫺(.0018).162 Gender gap with basic control variables
(np98,200) ⫺.059
(.0021) ⫺(.0014).079 ⫺(.0012).115 ⫺(.0013).158 ⫺(.0022).210 ⫺(.0032).266 ⫺(.0046).293 ⫺(.0015).174 Gender gap with basic control variables and
field of education (np98,200) ⫺.053
(.0026) ⫺(.0016).069 ⫺(.0014).100 ⫺(.0017).134 ⫺(.0021).177 ⫺(.0033).221 ⫺(.0053).254 ⫺.153.0017) Gender gap with basic control variables, field of
education, and sector (np98,187) ⫺.050
(.0027) ⫺(.0018).065 ⫺(.0014).085 ⫺(.0014).113 ⫺(.0021).150 ⫺(.0032).180 ⫺(.0049).206 ⫺(.0017).132 Gender gap with basic control variables, field of
education, sector, and industry (np98,187) ⫺.048
(.0025) ⫺(.0018).055 ⫺(.0013).071 ⫺(.0014).101 ⫺(.0021).138 ⫺(.0032).168 ⫺(.0048).185 ⫺(.0017).122 Gender gap with basic controls, field of
educa-tion, sector, industry, and occupation (using
10% sample;np9,611)* ⫺.038
(.0096) ⫺(.0060).040 ⫺(.0062).053 ⫺(.0032).065 ⫺(.0076).083 ⫺(.0099).080 ⫺(.0086).084 ⫺(.0053).076
Note.—OLSpordinaryleast squares.
* The sample was constructed by taking 10% of the women and 10% of the men for whom information on occupation was available. This sample gave 4,856 men and 4,755 women.
Is There a Glass Ceiling in Sweden? 161 data, except at the top levels (i.e., Ed6 and Ed7), women were better educated than men. In addition, all else equal, immigrants are paid less than nonimmigrant workers, and working women are less likely to be immigrants than are working men. At the ninetieth and ninety-fifth per-centiles, however, controlling for the basic regressors decreases the effect of gender.
We present the complete set of coefficient estimates for the quantile regressions on the basic control variables in table A2 in the appendix. The effect of age and age squared on the log wage is constant in the bottom half of the distribution, but at the seventy-fifth percentile and beyond, this effect increases. At almost every percentile, the estimated returns to education increase with level of education, and at each level of education, estimated returns increase almost uniformly by percentile. Fi-nally, the effect of immigrant status decreases slightly as we move up the log wage distribution.
Because we know from the literature that gender differentials in work experience and tenure have significant power in explaining the gender gap, we use the fact that the 1991 SLLS data contain these variables as well as age by estimating our basic model using the 1991 data and then rees-timating it using experience and tenure instead of age.14The results from
both estimations are presented in appendix table A3. Using age and age squared, the 1991 results are similar to those obtained using the 1998 data. Although all the estimated gender dummy coefficients are larger using the 1991 data, the unexplained gender gap still increases by percentile and accelerates at the seventy-fifth percentile, just as in the 1998 estimates. Using the 1991 data, the estimated OLS gender dummy coefficient is 19.6%, with a variation from 12.8% for the fifth percentile to 30.2% for the ninety-fifth percentile. When we replace age with experience and add tenure, the unexplained gender gaps are reduced, but the basic pattern remains. Using OLS, the estimated effect of gender is 18.2%, with a variation from 11.8% for the tenth percentile to 27.8% for the ninetieth percentile. (The figure at the fifth percentile is 12.8% and that at the ninety-fifth percentile is 26.2%.)
We would ideally like to use the 1992 SSW data to see if there are differences in the estimates based on the two data sources (i.e., the SLLS data vs. the SSW data), but since the 1992 SSW data do not contain an immigrant variable, we could not estimate our basic model using these data. Instead, to investigate the comparability issue, we estimated the basic model without the immigrant variable first using the 1991 SLLS and then using the 1992 SSW data. These estimates are presented in appendix table 14Using 1988 U.S. data, Blau and Kahn (2000) report that 33% of the total gender gap could be explained by education, experience, and race. Experience accounted for virtually all of the explained portion.
A4 and are roughly comparable. Naturally, the estimates using the 1991 data are less precise since that data set is much smaller.
Returning to table 2, we now add a series of control variables that are arguably endogenous. Nonetheless, as an accounting exercise, it is useful to know the extent to which the gender gap at different percentiles can be “explained” by these variables. We first add field of education to the control variables, even though gender differences in choice of field of education may result from different labor market expectations. Using U.S. data, Brown and Corcoran (1997) show that a significant part of the average gender gap among college graduates is accounted for by differ-ences in field of highest degree. We know of no previous Swedish study that uses field of education to address the gender-gap issue.
Our data allow us to distinguish among at most 10 fields of education within each of the education levels 3–7 (see n. 2); in all, the quantile regressions include 46 combinations of field and level. In panel 3 of table 2 we report the estimated gender gaps when these 46 combinations of level and field of education as well as age, age squared, and immigrant status are used as controls. All the estimated gender dummy coefficients decrease, but those at the ninetieth and ninety-fifth percentiles fall the most. Despite these reductions, the glass ceiling pattern remains in the estimated unexplained gender gaps.
In panel 4 of table 2, we add sector of employment (private, local government, with central government as the left-out category) to our control variables.15Since the choice of sector in which to work is typically
made after education is completed, the argument for the endogeneity of this variable is even stronger. As with the other variables, controlling for sector has the greatest effect at the top of the wage distribution. The reason is that working in the private sector has a large payoff in the top of the wage distribution, and many more men than women work in the private sector. In panel 5, we present the estimated gender dummy co-efficients that remain when we also control for industry of employment, using 24 industry dummies. In contrast to the previous panels, the effect of controlling for industry is similar throughout the wage distribution. That is, with the exception of the fifth and ninety-fifth percentiles, the reductions in the unexplained gender gap are not very different as we move up the log wage distribution.
In terms of explaining the gender gap by differences in labor market characteristics between the genders, the essential message of the first five panels of table 2 is quite clear. Except at the very top of the wage dis-tribution, controlling for covariates does not account for much of the gap. Even at the seventy-fifth percentile, and even when we include var-15As indicated in table 2, the number of observations used in the quantile regressions decreases when we add sector, because of missing data.
Is There a Glass Ceiling in Sweden? 163 iables that are arguably endogenous, we can explain less than 30% of the raw gender gap (19.8% vs. 13.8%). At the ninetieth and ninety-fifth per-centiles, matters are somewhat different. Using only age, age squared, education, and immigrant status, we can explain about 21% (respectively, 24%) of the gender gap at the ninetieth (respectively, ninety-fifth) per-centiles. To put these figures in perspective, this is only slightly less than the fraction of the average gender gap that can be explained using OLS on the full set of covariates (12.2% vs. 16.2%). Once we include field of education, sector, and industry as regressors, we can reduce the coefficients on the gender dummy at the ninetieth and ninety-fifth percentiles even further, but these coefficients are still considerably above those lower down in the distribution. In short, after adjusting for a set of basic control variables as well as field of education, sector, and industry, the gender gap is still greater at the top of the wage distribution than at the bottom.
The final panel of table 2 examines the effect of gender differences in occupation. As indicated, for example, by table 3 of Dolado, Felgueroso, and Jimeno (2001), the extent of occupational segregation in Sweden is greater than in the United States and the non-Scandinavian European Union countries. This relatively segregated pattern might reflect a pe-culiarly Swedish preference that women work in family-friendly occu-pations—although we think explanations based on cross-country differ-ences in preferdiffer-ences are unconvincing—it could reflect the rational response of workers and firms to the constraints and incentives implied by Swedish family policy, or it could simply be that occupations that are relatively segregated in other countries are particularly prevalent in Swe-den. Whatever the factors underlying the relatively high degree of oc-cupational segregation in Sweden, it is interesting to investigate the extent to which occupational differences account for the pattern that we see in the gender gap.
Meyersson-Milgrom, Petersen, and Snartland (2001) also emphasize the occupational gender division in Sweden. They show that men and women with similar observable characteristics who have the same job with the same employer receive essentially the same wage. That is, the gender gap—and specifically the glass ceiling effect—primarily reflects the fact that men and women have different jobs. This is an important and useful fact, but we emphasize that we do not view occupational, or more gen-erally job, segregation as an explanation of the glass ceiling effect. Oc-cupation and wage are jointly determined variables. In this sense, occu-pational segregation is the form in which the glass ceiling is manifested rather than an independent explanation of it.16
16In the sociological literature, occupational segregation is sometimes treated as a cause of the gender gap. For example, Wright et al. (1995) have shown that the gender gap in workplace authority is higher in Sweden than in the United
To examine the extent to which gender differences in occupation can account for the gender gap in wages, we use 107 occupational dummies. It was not feasible to run the quantile regressions with the 46 field of education dummies, the 24 industry dummies, and the 107 occupation dummies on the whole data set. Instead, we took a sample of the data set (10% of the men and 10% of the women for whom we had information on occupation) and found that adding occupational dummies to the var-iables used in panel 5 of table 2 has a substantial effect.17The results are
given in panel 6 of table 2. The unexplained gender gap falls to 8.4% at the ninety-fifth percentile and to 3.8% at the fifth percentile (compared to 18.5% at the ninety-fifth percentile and to 4.8% at the fifth percentile in panel 5). That is, controlling for occupation substantially reduces the gender gap throughout the wage distribution. The effect of controlling for occupation on the gender gap reflects the occupational segregation that is present in Sweden. It is interesting to note, however, that even when we include 107 occupation dummies, the gender gap is much larger at the top than at the bottom of the wage distribution.
The results presented in table 2 assume that the coefficients on the explanatory variables are the same for men and women. In the next section, we examine whether this is, in fact, the case.
B. Quantile Regressions by Gender
Tables 3 and 4 present quantile log wage regressions by gender. In table 3, we estimate the effects of age, age squared, and education on log wage separately for men and for women at the various percentiles. This table shows the extent to which returns to basic control variables differ between men and women at the various points in their respective distributions. In table 4, we add two demographic variables (marital status and number of children), sector, and a dummy variable for full-time status. We do this because these variables are frequently mentioned as controls that have markedly different effects by gender. To save space, we only present results for the tenth, fiftieth, and ninetieth percentiles in table 4. We discuss the results in table 3 first.
The coefficients on age for men are always above the corresponding States. If, as suggested by Hultin and Szulkin (1999), the gender composition of the supervisory staff has an independent effect on wages, then occupational seg-regation could explain part of the observed pattern in the gender gap.
17As a check on the sampling procedure, we actually took five samples. The estimates presented in panel 6 correspond to the sample among the five that produced the median gender gap estimated by OLS. The variation in the OLS and quantile regression estimates across the five samples is consistent with the estimated standard errors reported in panel 6. For example, the coefficient esti-mates at the fifth percentile range from ⫺.021 to ⫺.043, while the coefficient estimates at the ninety-fifth percentile range from⫺.084 to⫺.104.
Table 3
Quantile Regressions by Gender, 1998 (Percentiles)
5th 10th 25th 50th 75th 90th 95th OLS
Men:
Age .031
(.0012) (.0009).030 (.0007).029 (.0007).032 (.0011).035 (.0019).046 (.0026).051 (.0008).036 Age2/100 ⫺.031
(.0015) ⫺(.0011).030 ⫺(.0009).028 ⫺(.0009).031 ⫺(.0013).032 ⫺(.0023).043 ⫺(.0032).047 ⫺(.0008).034
Ed2 ⫺.003
(.0081) (.0062).007 (.0049).036 (.0052).057 (.0079).106 (.0131).160 (.0184).219 (.0057).076
Ed3 .041
(.0072) (.0055).048 (.0043).071 (.0046).090 (.0069).128 (.0114).169 (.0160).216 (.0050).104
Ed4 .055
(.0073) (.0056).069 (.0044).109 (.0048).154 (.0074).248 (.0122).337 (.0172).406 (.0052).197
Ed5 .117
(.0079) .139.0060) (.0047).194 (.0051).243 (.0077).329 (.0128).431 (.0179).491 (.0055).276
Ed6 .199
(.0077) (.0058).228 (.0046).287 (.0050).419 (.0076).606 (.0125).698 (.0176).761 (.0055).455
Ed7 .366
(.0158) (.0121).404 (.0096).493 (.0104).589 (.0157).722 (.0258).794 (.0359).806 .608.0113)
Imm ⫺.185
(.0111) ⫺(.0086).168 ⫺(.0067).161 ⫺(.0073).149 ⫺(.0110).129 ⫺(.0180).125 ⫺(.0252).123 ⫺(.0080).161 Constant 8.763
(.0243) 8.821(.0185) 8.908(.0140) 8.929(.0146) 8.921(.0217) 8.778(.0363) 8.727(.0509) 8.834(.0159) Women:
Age .023
(.0009) (.0006).023 (.0004).022 (.0005).020 (.0008).023 (.0014).027 (.0022).032 (.0006).024 Age2/100 ⫺.023
(.0010) ⫺(.0007).023 ⫺(.0005).021 ⫺(.0006).019 ⫺(.0009).023 ⫺(.0017).028 ⫺(.0026).033 ⫺(.0007).024
Ed2 .016
(.0064) (.0045).019 (.0034).036 (.0038).058 (.0063).071 (.0111).095 (.0172).118 (.0045).061
Ed3 .053
(.0056) (.0040).050 (.0030).061 (.0033).072 (.0054).068 (.0096).069 (.0148).070 (.0039).069
Ed4 .064
(.0063) (.0045).068 (.0034).096 (.0037).124 (.0062).140 (.0111).178 (.0172).221 (.0044).132
Ed5 .134
(.0059) (.0042).141 (.0032).159 (.0035).186 (.0058).211 (.0104).241 (.0159).279 (.0041).193
Ed6 .218
.0059) (.0042).232 (.0032).270 (.0036).307 (.0058).332 (.0104).458 (.0162).559 (.0042).327
Ed7 .334
(.0180) (.0130).411 (.0098).479 (.0110).610 (.0180).688 (.0321).768 (.0487).801 (.0129).599
Imm ⫺.130
(.0084) ⫺(.0060).127 ⫺(.0045).102 ⫺(.0050).078 ⫺(.0082).072 ⫺(.0147).082 ⫺(.0225).072 ⫺(.0059).092 Constant 8.843
(.0181) 8.885(.0126) 8.958(.0090) 9.059(.0098) 9.126(.0160) 9.149(.0288) 9.143(.0448) 9.007(.0114) Note.—Men (np49,788); women (np48,412). Standard errors are in parentheses. OLSp
least squares; status. Educational levels: Ed than 9 years of education ordinary Immpimmigrant 1pless
(folkskolaand incomplete comprehensive school,grundskola); Ed2p9or 10 years of basic education, i.e., comprehensive school (grundskola) or junior secondary school (realskola); Ed3pupper-secondary school for up to 2 years (kortare gymnasium); Ed4pupper-secondary school (high school) for 3 years (la¨ngre gymnasium); Ed5ppostsecondaryschooling for less than 3 years (kortare universitetsutbildning); Ed6patleast 3 years of postsecondary education (la¨ngre universitetsutbildning); Ed7pcompleted doc-toral degree (forskarutbildning).
Table 4
Quantile Regressions by Gender, 1998 (Percentiles)
Men (np49,780) Women (np48,407)
10th 50th 90th OLS 10th 50th 90th OLS
Age .025
(.0010) (.0009).028 (.0020).040 (.0009).031 (.0006).022 (.0005).021 (.0012).026 (.0006).025 Age2/100 ⫺.025
(.0012) ⫺(.0011).026 ⫺(.0024).036 ⫺(.0010).028 ⫺(.0008).021 ⫺(.0007).020 ⫺(.0014).026 ⫺(.0007).024
Ed2 .015
(.0059) (.0056).065 (.0129).163 (.0055).084 (.0044).020 (.0039).058 (.0083).086 (.0043).065
Ed3 .054
(.0053) (.0049).099 (.0112).182 (.0048).114 (.0038).047 (.0034).087 (.0073).109 (.0038).091
Ed4 .073
(.0054) (.0051).172 (.0121).337 (.0050).207 (.0043).064 (.0038).121 (.0083).167 (.0043).133
Ed5 .158
(.0058) (.0054).275 (.0129).435 (.0054).306 (.0041).133 (.0037).210 (.0081).287 (.0041).221
Ed6 .246
(.0057) (.0054).456 (.0128).732 (.0054).500 (.0041).218 (.0037).334 (.0082).479 (.0041).358
Ed7 .416
(.0118) (.0112).633 (.0261).910 (.0110).665 (.0125).370 (.0113).604 (.0245).877 (.0125).602
Married .034
(.0031) (.0030).048 (.0067).100 (.0029).064 (.0020).002 (.0018).001 ⫺(.0039).006 (.0020).001 No. of
child-ren .004
(.0015) (.0014).002 ⫺(.0032).005 (.0014).001 ⫺(.0011).002 ⫺(.0010).003 (.0021).000 ⫺(.0011).003
Private .009
(.0038) (.0036).079 (.0087).155 (.0036).095 ⫺(.0030).037 (.0027).021 (.0058).101 (.0030).029 Local
gov-ernment ⫺.056
(.0048) ⫺(.0045).077 ⫺(.0103).073 ⫺(.0044).074 ⫺(.0029).035 ⫺(.0026).061 ⫺(.0056).114 ⫺(.0029).068 Full-time .128
(.0055) (.0051).099 (.0114).059 (.0050).109 (.0021).054 (.0019).028 ⫺(.0039).056 (.0021).026
Imm ⫺.169
(.0082) ⫺(.0078).144 ⫺(.0179).147 ⫺(.0077).168 ⫺(.0057).112 ⫺(.0051).075 ⫺(.0110).066 ⫺(.0057).094 Constant 8.790
(.0195) 8.827(.0173) 8.719(.0406) 8.741(.0170) 8.912(.0129) 9.031(.0110) 9.187(.0242) 8.970(.0122) Note.—Standard errors are in parentheses.OLSpordinaryleast squares;Immpimmigrantstatus. Educational levels: Ed1plessthan 9 years of education (folkskolaand incomplete comprehensive school,
grundskola); Ed2p9 or 10 years of basic education, i.e., comprehensive school (grundskola) or junior
secondary school (realskola); Ed3pupper-secondary school for up to 2 years (kortare gymnasium); Ed4pupper-secondary school (high school) for 3 years (la¨ngre gymnasium); Ed5ppostsecondary
schooling for less than 3 years (kortare universitetsutbildning); Ed6patleast 3 years of postsecondary education (la¨ngre universitetsutbildning); Ed7pcompleteddoctoral degree (forskarutbildning).
coefficients for women, and this gap grows as we move up the wage dis-tribution. This is due in part to the fact that age is a better proxy for experience for men than it is for women and in part to the fact that women’s log wage-experience profiles tend to be flatter than men’s, even when a good measure of experience is available. In addition, the coefficient on age is higher for both men and women at the top of the wage distribution.
Women realize essentially the same return to education as men do at almost all levels of education at the very bottom of the wage distribution. Once we reach the twenty-fifth percentile, men start to get a bigger payoff than women do at almost all levels of education. This is particularly true
Is There a Glass Ceiling in Sweden? 167 at the very top of the wage distribution. For some levels of education, this difference is quite important. For example, at the ninety-fifth per-centile in the two distributions, the payoff to a man who has completed at least 3 years of postsecondary schooling (Ed6) is estimated to be about 20% higher (i.e., 0.761–0.559) than the corresponding payoff to a woman. Interestingly, however, the payoffs to doctoral degrees (Ed7) do not seem to be much different between men and women. The immigrant penalty is greater for men than for women at all percentiles, and for both men and women the immigrant penalty falls almost uniformly as we move up the distribution.
The patterns for age, education, and immigrant status in table 4 are similar. In terms of the additional variables, it is worth noting that being married has a positive effect for men and no significant effect for women and that number of children is almost always insignificant.18The premium for
work-ing in the private sector is much higher for men than for women throughout the wage distribution, while the penalty associated with local government employment is greater for men at the bottom of the distribution but lower at the ninetieth percentile. Working full time has a greater payoff for men than for women. This payoff is smaller at higher percentiles in the distri-bution and is, in fact, negative for women at the ninetieth percentile.
Tables 3 and 4 clearly indicate that the returns to labor market variables are different for men and women. In discussing the results on the gender gaps presented in table 2, we assumed that returns to characteristics were the same for men and women. In the next section, we look at the issue of whether the gender gap at various points in the wage distribution is due to differences in labor market characteristics by gender or whether it is due to differences in the returns to these characteristics by gender.
C. Decompositions
In this section, we use quantile regression techniques to decompose the difference between the male and female log wage distributions into a com-ponent that is due to differences in labor market characteristics between the genders and a component that is due to differences in the rewards that the two genders receive for their labor market characteristics. This decom-position is in the spirit of the Oaxaca-Blinder technique (e.g., Oaxaca 1973) except that, rather than identifying the sources of the differences between the means of two distributions, we explain the differences, quantile by quantile, between the male and female log wage distributions.
There are several techniques available in the literature for decomposing 18In the SSW data, the number of children (age 17 or younger) is defined as the number living with the adult in the sample. Using the 1991 SLLS data, we confirmed that our results were unaffected if we instead used the number of children the individual ever had.
differences in distributions. Probably the best known is the technique based on weighted-kernel estimates due to Dinardo, Fortin, and Lemieux (1996). Other approaches include the hazard-based approach of Donald, Green, and Paarsch (2000) and the rank regression method of Fortin and Lemieux (1998). We use an approach developed by Machado and Mata (2000), which is based on quantile regression techniques.
The idea is to generate two counterfactual densities: (i) the female log wage density that would arise if women were given men’s labor market characteristics but continued to be “paid like women,” and (ii) the density that would arise if women retained their own labor market characteristics but were “paid like men.” The Machado-Mata approach to estimating the first density is as follows:
1. Drawn numbers at random from (0,1), sayv1,v2, … ,vn.
2. Using the female data set, estimate the quantile regression coeffi-cient vectors,bf(v), forip1, … ,n.
i
3. Makendraws at random with replacement from the male data set, denoted byxm, forip1, … ,n.
i
4. The counterfactual density is then generated as{y px bm f(v)}for
i i i
.
ip1, … ,n
The approach to estimating the second counterfactual density (female characteristics but “paid like men”) is simply to reverse the roles of male and female in steps 2 and 3, that is, use the male data set to estimate the quantile regression coefficients and make the bootstrap draws from the female data set. Note, however, that the linearity of quantile regression implies that the decomposition of the difference between the male and female log wage densities is exact; that is,
m m f f m f f m m f
x b (v)-x b(v)p(x -x )b(v)⫹x [b (v)-b(v)].
We follow the Machado-Mata approach almost exactly, except that rather than drawing n numbers at random from (0,1) and then estimating n
quantile regression coefficient vectors, we simply estimate the quantile regressions at the first percentile, the second percentile, and so forth up to the ninety-ninth percentile. Then, rather than taking one draw at ran-dom from the Xmatrix for each estimated coefficient vector, we make 100 draws for eachb(vi). One can also use the Machado-Mata approach to estimate standard errors for the estimated counterfactual densities by repeating their procedure many times and generating a set of estimated densities. We do not estimate standard errors for our counterfactual den-sities. The number of observations in our data set is such that repetition produces virtually identical estimated densities at each repetition.
The results from our decompositions are given in table 5. The first panel of table 5 gives the observed gender gaps at the various percentiles; that is, it is identical to the first panel of table 2. The gender gaps reported in the rest of table 5 are constructed by estimating the betas using only
Is There a Glass Ceiling in Sweden? 169 Table 5
Counterfactual Gender Gaps, 1998—Percentages (Counterfactuals Constructed Using Male X’s and Femaleb’s; Percentiles)
5th 10th 25th 50th 75th 90th 95th OLS
Observed gender gap ⫺.048 ⫺.065 ⫺.098 ⫺.133 ⫺.198 ⫺.336 ⫺.387 ⫺.162 Counterfactual gap using
basic control variables ⫺.057 ⫺.078 ⫺.110 ⫺.142 ⫺.208 ⫺.346 ⫺.402 ⫺.171 Counterfactual gap using
basic control variables
and education fields ⫺.058 ⫺.079 ⫺.109 ⫺.132 ⫺.178 ⫺.291 ⫺.331 ⫺.154 Counterfactual gap using
basic control variables, education fields, and
sector ⫺.063 ⫺.077 ⫺.098 ⫺.110 ⫺.156 ⫺.269 ⫺.317 ⫺.137 Counterfactual gap using
basic control variables, education fields, sector,
and industry ⫺.055 ⫺.068 ⫺.086 ⫺.106 ⫺.154 ⫺.263 ⫺.310 ⫺.130 Counterfactual gap using
basic control variables, education fields, sector, industry, and
occupa-tion* ⫺.079 ⫺.070 ⫺.074 ⫺.079 ⫺.091 ⫺.162 ⫺.195 ⫺.099 Note.—OLSpordinaryleast squares.
* The last row is based on a sample of the data consisting of 10% of the males and 10% of the females.
data on women and then assuming that women have the male distribution of labor market characteristics. For example, the second panel of table 5 gives the gap between the male log wage density at various percentiles and the counterfactual density constructed assuming that women have the male distribution of age, education, and immigrant status but are rewarded for these characteristics “like women.”
It is interesting to compare these results with those in table 2. Table 2 gives the gender gaps controlling for differences in labor market char-acteristics but assuming that men and women receive the same rewards for these characteristics. The most striking difference between the two tables is at the top of the wage distribution. Whereas table 2 suggests that differences in characteristics account for a substantial portion of the gender gap at the top of the distribution, table 5 indicates otherwise. In table 5, when we control for age, education, and immigrant status (panel 2), the gender gap rises throughout the distribution. This indicates that it is clearly not gender differences in age, education, and immigrant status that account for the gender gap at the top of the distribution but, rather, the differential rewards that women receive for these characteristics. The cor-responding panel in table 2 showed that controlling for these variables reduced the gender gap at the top by about one quarter, but this assumed, contrary to what we see in tables 3 and 4, that the rewards that men and women receive for these characteristics are the same. The next three panels of table 5 convey a similar message. Adding first field of education, then
Fig.7.—Decomposition analysis, 1998
sector of employment, and then industry reduces the gender gaps at the top of the distribution, but this effect is very small relative to that in table 2. For example, after controlling for all these variables (panel 5), the gender gap at the ninety-fifth percentile falls from 38.7% to 31.0%, while in table 2 it falls to 18.5%. (At the ninetieth percentile it falls to 31.7%, whereas in table 2 it falls to 16.8%.) The results in table 5 indicate that the glass ceiling effect is due to differences in rewards between the genders at the top of the wage distribution rather than to differences in characteristics. It is interesting to perform this exercise on the 10% sample that was the basis of the estimates presented in panel 6 of table 2.19This is reported
in the last panel of table 5. Note that at the ninety-fifth percentile the gap falls to 19.5% compared to the gender gap estimated controlling for occupation of 8.4% reported in table 2. Table 5 shows that even after controlling for occupation there is a significant upward twist in the gender gap indicating evidence of a glass ceiling. This is even clearer in figure 7 where the increased slope after the seventy-fifth percentile is still evident even after including all the controls, that is, including occupation. We argued above that occupational segregation is the form in which the glass ceiling effect is manifested. What we see here is that even after taking occupation into account, there is a residual glass ceiling.
19As before, we also performed this exercise using the four other samples. In no case were the results qualitatively different.
Is There a Glass Ceiling in Sweden? 171 V. Conclusions
In this article, we have addressed the question of whether there is a significant glass ceiling in Sweden. The answer, quite simply, is yes. There is an extremely large gap between men and women at the top of the wage distribution. The size of this gap is especially striking given the fact that the average gender gap in Sweden is quite small by international standards. It is also the case that this glass ceiling phenomenon is not diminishing over time—on the contrary, we find that the glass ceiling is much more pronounced in the 1990s than it was earlier. We also find that the glass ceiling is much more important in Sweden than in the United States, which is perhaps contrary to what one might expect given the fact that the Swedish average log wage gap between the genders is smaller than the corresponding U.S. gap. Finally, we examine the log wage gap for nonimmigrants versus immigrants. The fact that this gap does not increase as we move up the wage distribution suggests that the glass ceiling effect is specifically related to gender, as opposed to being a more general labor market phenomenon. We next examine the extent to which the gender gap at various per-centiles in the wage distribution can be explained by differences in the characteristics that men and women bring to the labor market. Using quantile regressions that impose the restriction that the male and female coefficients are the same, we find that covariates can account for some of the gap between men and women, especially at the top of the wage dis-tribution. Using the basic control variables reduces the gap at the ninetieth and ninety-fifth percentiles but increases it further down in the wage distribution. Adding field of education, sector, and industry reduces the gender gaps found with the basic controls throughout the distribution. These latter variables are, however, arguably endogenous. When we also account for occupation, we find that the gender gap at the top of the distribution falls substantially. With our full set of controls, we are able to “account for” about three-quarters of the gender gap at the top of the distribution. We argue, however, that including occupation, which ac-counts for about one-third of the “explained” gender gap at the top of the distribution, is really another way of showing the glass ceiling effect, which manifests itself partly through occupational segregation.
We also estimate separate quantile regressions by gender and find sub-stantial differences between the genders in the coefficients on the covariates at various percentiles in the male and female distributions. This indicates that the pooled quantile regression results are misleading. Accordingly, we carry out a decomposition analysis to determine the extent to which the gender gap at various percentiles can be ascribed to differences between the genders in covariates versus differences in rewards to those covariates. This analysis shows that when we control for gender differences in basic co-variates, age, education, and immigrant status, by giving women the labor
market characteristics that men have but allowing them “to be paid like women,” we explain none of the gender gap at the top of the wage dis-tribution. In fact, the gender gap increases throughout the disdis-tribution. Adjusting for field of education, sector, and industry explains a small portion of the gender gap, but gender differences in rewards to these characteristics is the more important factor. When we add occupation, the gender gap increases at the bottom of the distribution and decreases in the top three-quarters of the distribution. In fact, at the top of the distribution, the counterfactual gap falls to about half of the raw gender gap at the top. That is, about half of the gender gap at the top of the distribution is due to gender differences in rewards to labor market characteristics and about half to gender differences in the characteristics themselves. We emphasize again that we view gender differences in occupation as accounting for rather than explaining the gender gap, but it is interesting that the glass ceiling effect persists even after controlling for occupation.
Given the existence of a substantial glass ceiling effect in Sweden, it is tempting to speculate about possible causes. We have identified gender differences in rewards as a primary factor responsible for the glass ceiling effect, even when we account for occupation. This implies that a taste-based explanation, that is, that Swedish women prefer to work in family-friendly but low-wage jobs, is not consistent with our findings. In any case, we see no obvious reason why women in Sweden should have dif-ferent preferences than, for example, women in the United States. It seems more fruitful to look for explanations in the work environment faced by Swedish women. In this regard, the obvious candidate is the collection of policies in Sweden that influence the interaction between work and family. Specifically, we have in mind Swedish parental leave policy and the day-care system. These policies give Swedish women (and men, in principle) a strong incentive to participate in the labor force. The benefits that a new parent can obtain when a child is born are strongly conditioned on that parent’s employment history, and access to the day-care system is (essentially) conditioned on labor force participation. At the same time, the benefits may discourage strong career commitment on the part of the parents who are most involved in child rearing. In practice, this means that women may have strong incentives to participate in the labor force but not to do so very intensively. This policy effect may be compounded by employers, who presumably expect less career commitment from their female employees. Another factor may be that the relatively high wages at the bottom of the wage distribution make it very difficult for career-oriented women to hire household help or help with child care.20As a
result, women may choose (or be tracked into) the less demanding jobs. 20Although Sweden has an extensive day-care (dagis) system, it is unusual that a child can enterdagisbefore the age of 12 months.
Is There a Glass Ceiling in Sweden? 173 The outcome would then be one in which women do well relative to men at the bottom and middle of the wage distribution but fall substantially behind at the top of the distribution.
Appendix Table A1
Estimated Wage Equations Using Data from SLLS-91 and SSW-92 with Identical Regressors
SLLS-91 SSW-92
All Men Women All Men Women
Gender ⫺.195
(.008) ⫺(.002).155
Age .031
(.002) (.004).038 (.003).025 (.001).026 (.001).032 (.001).020
Age2/100 ⫺.030
(.003) ⫺(.005).035 ⫺(.003).025 ⫺(.001).025 ⫺(.001).030 ⫺(.001).019
Ed2 .070
(.018) (.028).101 (.022).047 (.005).076 (.008).097 (.005).059
Ed3 .121
(.014) (.022).161 (.018).087 (.004).098 (.007).118 (.004).080
Ed4 .192
(.017) (.025).226 (.023).139 (.005).172 (.007).203 (.006).124
Ed5 .273
(.017) (.027).307 (.021).243 (.005).224 (.008).249 (.005).203
Ed6 .365
(.017) (.027).377 (.022).353 (.005).379 (.008).409 (.005).351
Ed7 .444
(.045) (.057).444 (.085).475 (.014).583 (.019).602 (.023).531
Constant 3.561
(.047) 3.351(.075) 3.564(.056) 8.876(.014) 8.707(.023) 8.897(.015) No. of observations 3,318 1,655 1,663 29,281 14,266 15,015
AdjustedR2 .348 .278 .274 .394 .327 .376
Note.—Standard errors are in parentheses.SLLSpSwedish Level of Living Surveys; SSWp
Sweden. Ages 18–65 years. Educational levels: Ed than 9 years of education (folkskola
Statistics 1pless
and incomplete comprehensive school,grundskola); Ed2p9or 10 years of basic education, i.e., com-prehensive school (grundskola) or junior secondary school (realskola); Ed3pupper-secondary school for up to 2 years (kortare gymnasium); Ed4pupper-secondary school (high school) for 3 years (la¨ngre gymnasium); Ed5ppostsecondary schooling for less than 3 years (kortare universitetsutbildning); Ed6patleast 3 years of postsecondary education (la¨ngre universitetsutbildning); Ed7pcompleted doc-toral degree (forskarutbildning).
Table A2
Quantile Log Wage Regressions, 1998 (Percentiles)
5th 10th 25th 50th 75th 90th 95th OLS
Gender ⫺.059
(.0021) ⫺(.0014).079 ⫺(.0012).115 ⫺(.0013).158 ⫺(.0022).211 ⫺(.0032).266 ⫺(.0046).293 ⫺(.0015).174
Age .027
(.0007) (.0005).026 (.0004).025 (.0004).026 (.0007).030 (.0011).035 (.0015).039 (.0005).031 Age2/100 ⫺.026
(.0009) ⫺(.0006).026 ⫺(.0005).024 ⫺(.0005).025 ⫺(.0009).029 ⫺(.0013).033 ⫺(.0019).037 ⫺(.0006).029
Ed2 .006