CTEI-2012-13
© The Authors.
All rights reserved. No part of this publication may be reproduced without the permission of the authors.
http://graduateinstitute.ch/ctei
CTEI
W
ORKING
P
APERS
G
LOBAL SUPPLY CHAINS
:
W
HY THEY
EMERGED
,
WHY THEY MATTER
,
AND WHERE
THEY ARE GOING
a
Richard Baldwin
bSynopsis
The paper presents an economist's perspective on supply chains explaining why they emerged, why they are significant, the future directions they are likely to take, and implications for policy.
a
I thank João Amador , Robert Johnson, Javier Gonzalez-Lopez, and Nadia Rocha for assistance with data from their excellent papers on related topics. I thank Patrick Low and Simon Evenett for excellent discussion, advice and analysis, and Alen Mulabdic for research assistance. This paper was prepared for the Fung Global Institute’s Global Supply Chain Initiative.
b
CTEI-2012-13
http://graduateinstitute.ch/ctei
C
ENTRE FORT
RADE ANDE
CONOMICI
NTEGRATION(CTEI)
The Centre for Trade and Economic Integration fosters world-class multidisciplinary scholarship aimed at developing solutions to problems facing the international trade system and economic integration more generally. It works in association with public sector and private sector actors, giving special prominence to Geneva-based International Organisations such as the WTO and UNCTAD. The Centre also bridges gaps between the scholarly and policymaking communities through outreach and training activities in Geneva.
7 July 2012
1.
I
NTRODUCTIONGlobal supply chains have transformed the world. They revolutionised development options facing poor nations – now they can join supply chains rather than having to invest decades in building their own. Offshoring of labour-intensive manufacturing stages and the attendant international mobility of technology launched era-defining growth in emerging markets – a change that fosters and is fostered by domestic policy reform. Historic income gaps are narrowing as the North de-industrialises and the South industrialises -- a reversal-of-fortunes that constitutes perhaps the most momentous global economic change in the last 100 years. Global supply chains, however, are themselves rapidly evolving. The change is in part due to their own impact (income and wage convergence) and in part due to rapid technological innovations in communication technology, computer integrated manufacturing, 3D printing, etc.
This paper looks at why global supply chains (GSCs) matter, the economics of their
unbundling, and their implications for policy. It finishes with a discussion of factors affecting the future of global supply chains. The paper begins by putting global supply chains into historical perspective.
2.
T
HREE CENTURIES OF GLOBALISATION:
GSC
S IN PERSPECTIVEGlobalisation is often viewed as driven by the gradual lowering of natural and man-made trade costs. This is a serious misunderstanding.
Globalisation has been driven by advances in two very different types of ‘connective’
technologies: transportation and transmission. These have dramatically different implications, but understanding why requires some background.
2.1. 1st unbundling: Steam made it possible, scale economies made it profitable
In the pre-globalisation world, each village made most of what it consumed. Production and consumption were forced together by poor transportation technology. The steam revolution, especially railroads and steamships, made it feasible to spatially separate production and consumption with this starting from the 1830s and accelerating in the 1870s (e.g. the Trans-America line was completed in 1869). Once feasible, scale economies and comparative advantage made separation profitable. This transformed the world.
Globalisation’s first unbundling was marked by five top-line facts: 1. North industrialisation & South de-industrialisation
The ‘North’ (Europe, North America and Japan) industrialised while South de-industrialised, especially India and China (Table 1).
Table 1: Per capita industrialisation levels, 1759-1913 (UK in 1900 = 100).
1750 1800 1830 1860 1880 1900 1913
France 9 9 12 20 28 39 59
Germany 8 8 9 15 25 52 85
Italy 8 8 8 10 12 17 26
Russia 6 6 7 8 10 15 20
UK 10 16 25 64 87 100 115
Canada 5 6 7 10 24 46
USA 4 9 14 21 38 69 126
Japan 7 7 8 7 9 12 20
China 8 6 6 4 4 3 3
India-Pakistan 7 6 6 3 2 1 2
Brazil 4 4 5 7
Mexico 5 4 5 7
Source: Table 9, Bairoch (1982); UK in 1900 = 100
2. Growth take-off
While the “Industrial Revolution” commenced in Britain before the first unbundling, steam power’s dramatic impact on trade costs made it profitable to produce at vast scales. This triggered modern growth, namely a self-sustaining cycle of production, innovation and income gains that made further innovation profitable. This spread to Continental Europe and the US around the middle of the 19th century.1
1
The dates suggested by Rostow (1960) are UK 1783-1802, France 1830-60, Belgium 1833-60, US 1843-60, Germany 1850-73, Sweden 1868-90, Japan 1878-1900, Russia 1890-1914 and Canada 1896-1914.
3. ‘Big time’ international income divergence/convergence
The first unbundling saw North and South incomes diverge massively. Innovation, scale and specialisation gave Northern industry a powerful cost-advantage over industry in the South. In addition to favouring the location of additional manufacturing in the North, the shift also destroyed incentives for innovation in the South. The higher Northern growth – which persisted up till the early 1990s – produced what Lant Pritchett (1997) calls income divergence ‘big time’.2
4. International trade and labour migration boomed
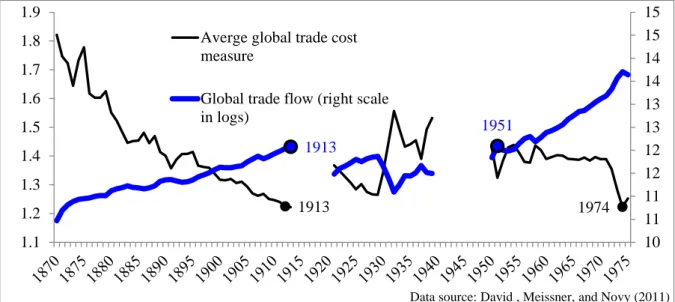
International trade in goods and labour migration exploded during the first unbundling. After being shut down by two world wars, a surge of protectionism and the Great Depression, trade returned, by 1951, to Victorian levels; trade costs (these include protection) returned to pre-WWI levels by 1974 (Figure 1). Mass international migration never resumed.
1913 1974
1913
1951
10 11 11 12 12 13 13 14 14 15 15
1.1 1.2 1.3 1.4 1.5 1.6 1.7 1.8 1.9
Data source: David , Meissner, and Novy (2011) Averge global trade cost
measure
Global trade flow (right scale in logs)
Figure 1:Global trade flows and estimated trade costs, 1870-1975.
Figure 1 shows the strong association between trade costs and globalisation up to the 1980s. From the mid19th century to WWI, trade costs fell rapidly due mostly to lower transportation costs. From 1914 to 1950, trade costs rose erratically but substantially due mostly to man-made trade barriers such as the Smoot-Hawley tariff and the retaliation it provoked. Finally, during the post-war period, trade costs have fallen steadily due mainly to tariff liberalisation and better organisation of transportation (e.g. containerisation).
5. Production clustered locally as it dispersed globally
The 1st unbundling did not make the world flat. Indeed, it produced the first globalisation paradox: freer trade led production to cluster locally in factories and industrial districts. The world’s economic geography went from homogenous (subsistence agriculture everywhere but a few cities) to ‘spiky’ (Florida 2005). The flat-world musings of
economists-without-economics-training, like Thomas Friedman and William Greider, are about as wrong as can be (Figure 2).
Globalisation’s paradox is solved with three points: i) cheap transport favours large-scale
2
On the theory connecting agglomeration, innovation, growth and income divergence, see Baldwin, Martin and Ottaviano (2001).
production, ii) such production is complex, and iii) extreme proximity lowers the cost of coordinating the complexity. By removing one constraint (transport costs), the 1st unbundling brought forward another – coordination costs. Proximity became more important in many ways, not less.
Figure 2: Light emissions: Lower transport costs make the world spiky Source: Richard Florida, “The World is Spiky,” The Atlantic Monthly, October 2005
2.2. 2nd unbundling: ICT made it possible, wage differences made it profitable
To think about the micro-clustering of economic activity, consider a stylised factory with three production stages (Figure 3 middle panel). Coordinating production requires a complex exchange among stages of goods, technology, people, training, investment, and information (double-headed arrows). For reasons that are easy to list but hard to study, bundling all stages in a single factory reduces costs and risk.
Stage B Stage
A
Stage C ICT
revolution
Stage B Stage A
Stage C
⇒
Figure 3: Schematic illustration of coordination costs and the 2nd unbundling Source: Derived from Baldwin (2011a).
Some of the coordination costs are related to communication, so the ‘coordination glue’ began to melt from the mid-1980s with ICT’s melding of telecommunications, computers and organisational software. In short:
• The ICT revolution made it possible to coordinate complexity at distance.
• The vast wage differences between developed and developing nations made separation profitable.
This was globalisation’s 2nd unbundling – some production stages previously performed in close proximity were dispersed geographically (Figure 3 right panel).
Importantly, most technology is firm specific, so internationalising supply chains often involves offshoring know-how. While technology transfer is an ancient story (gunpowder), ICT facilitated control that reduced the costs and risks of combining developed-economy technology with developing nation labour.3 For this reason, technology became more internationally mobile.
2.2.1. Indicators of global supply chains
Directly measuring the ‘nexus’ or the rise of 21st century trade is difficult; existing statistical categories were designed to quantify the 1st unbundling.
0.0 1.0 2.0 3.0 4.0 5.0
1967 1972 1977 1982 1987 1992 1997 2002 2007
Europe+US+Canada Asia
Latin America Africa
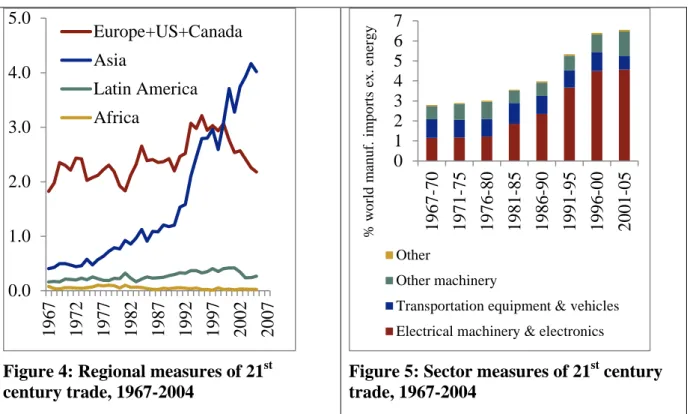
Figure 4: Regional measures of 21st century trade, 1967-2004
0 1 2 3 4 5 6 7 1967-70 1971-75 1976-80 1981-85 1986-90 1991-95 1996-00 2001-05 % w o rl d m anuf . im p o rt s ex. e ne rgy Other Other machinery
Transportation equipment & vehicles Electrical machinery & electronics
Figure 5: Sector measures of 21st century trade, 1967-2004
One measure of supply chain internationalisation focuses on products where nations are exporting and importing extraordinarily much. This makes little sense from 1st unbundling perspective; nations seem to have both a comparative advantage (extraordinarily large exports relative to other nations) and a comparative disadvantage (extraordinarily large imports relative to other nations). From a 2nd unbundling perspective, the extent of such overlapping comparative advantage and disadvantage provides a proxy for global supply chains. Thus the sum of such overlapping trade as a fraction of world manufacturing trade provides a conservative measure of supply-chain trade (Amador and Cabral 2006). The evolution of this measure by region and by sector is shown in Figure 4 and Figure 5. These charts show that there is nothing new about supply-chain trade. However, before the ICT revolution, most of the international sourcing was done among mature economies, e.g. US and Canada in the auto industry, or intra-EU trade in machinery. Figure 4 shows that starting in the late 1970s, Asia’s participation in GSCs started to boom, with a sudden take-off timed with the ICT revolution around 1990. By the late 1990s, Asia surpasses the north Atlantic economies.
3
As it turns out, 21st century trade is concentrated in relatively few sectors (Figure 5). Electrical machinery and electronics take the lion’s share of the level and the growth in the 1990s.
US Can
ad a M ex ic o Ja p an C hi na Indi a Indone si a K o re a G er m an y UK Ita ly F ra n ce S p ain P ol and P or tuga l B ra zi l
US 18% 37% 1% 2% 2% 3% 3% 1% 2% 1% 2% 2% 1% 1% 5% Canada 4% 2% 0% 0% 0% 0% 0% 0% 0% 0% 0% 0% 0% 0% 0% Mexico 2% 1% 0% 0% 0% 0% 0% 0% 0% 0% 0% 1% 0% 0% 1% Japan 1% 1% 5% 5% 1% 5% 6% 1% 1% 0% 1% 1% 1% 1% 1% China 3% 3% 9% 2% 5% 6% 7% 2% 2% 2% 2% 3% 3% 1% 3% India 0% 0% 0% 0% 1% 1% 1% 0% 0% 0% 0% 0% 0% 0% 1% Indonesia 0% 0% 0% 2% 1% 1% 1% 0% 0% 0% 0% 0% 0% 0% 0% Korea 1% 0% 4% 1% 4% 1% 2% 0% 0% 0% 0% 1% 1% 0% 1% Germany 1% 1% 3% 0% 1% 2% 2% 1% 4% 5% 5% 7% 12% 7% 2%
UK 1% 1% 1% 0% 0% 1% 0% 0% 2% 1% 2% 2% 1% 2% 1%
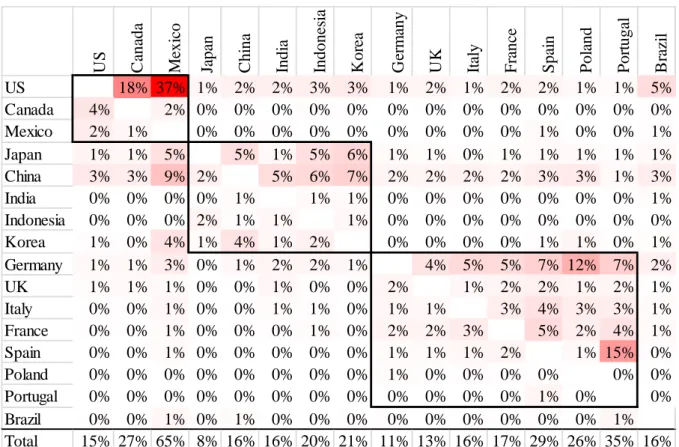
Italy 0% 0% 1% 0% 0% 1% 1% 0% 1% 1% 3% 4% 3% 3% 1% France 0% 0% 1% 0% 0% 0% 1% 0% 2% 2% 3% 5% 2% 4% 1% Spain 0% 0% 1% 0% 0% 0% 0% 0% 1% 1% 1% 2% 1% 15% 0% Poland 0% 0% 0% 0% 0% 0% 0% 0% 1% 0% 0% 0% 0% 0% 0% Portugal 0% 0% 0% 0% 0% 0% 0% 0% 0% 0% 0% 0% 1% 0% 0% Brazil 0% 0% 1% 0% 1% 0% 0% 0% 0% 0% 0% 0% 0% 0% 1% Total 15% 27% 65% 8% 16% 16% 20% 21% 11% 13% 16% 17% 29% 26% 35% 16% Figure 6: Backward linkage matrix for major supply-chain traders, 2007.
Source: Author’s manipulation of Gonzales-Lopez (2012) data. Notes: The columns show the intermediate inputs intensity from each row nation, e.g. 5% of the gross value of China’s exports consist of intermediates bought from Japan, while 2% of Japan’s gross exports consist of intermediates bought from China.
A different measure of global supply chain activity uses nations’ input-output matrices to identify which goods are inputs into which industries. This family of measures uses this information to identify which imports are used as intermediate inputs and sums them up to get a measure of supply-chain trade.4 Gonzales-Lopez (2012) uses this method to estimate the share of a nation’s exports made up of value added from intermediate inputs from its trade partners. For example, about 37% of the gross value of Mexican exports consists of US intermediate inputs, while only 2% of US exports consist of Mexican intermediate inputs. The matrix of these ‘backward linkages’ (Figure 6) reveals stark asymmetries in the global supply chain.
• There are ‘headquarter’ economies (whose exports contain relatively little imported intermediates) and ‘factory economies’ (whose exports contain a large share of imported intermediates).
The bottom row of the table shows the column sums and thus each nation’s overall dependence on intermediates from the listed nations. Japan and Germany have quite low
4
See Hummels, Ishii and Yi (1999), Johnson and Noguera (2011), Koopman, Wang, and Wei (2008), and González (2012).
shares, but all the advanced technology nations have shares under 20%; the figures for Indonesian and Brazil are low since they are important exporters of natural resources that use few intermediates.
• The global supply chain is really not very global – it’s regional.
Most of the large numbers – which indicate a strong supply-chain relationship – are in the regional blocks, what I call Factory Asia, Factory North America, and Factory Europe.5
• There is a hub-and-spoke asymmetry in the dependence of factory economies on headquarter economy’s intermediate exports.
For example the US column shows small dependency on imports from Canada and Mexico, but the Mexican and Canadian columns show strong dependence on the US and very little dependency on each other. The same can be seen in Factory Asia where Japan is the technology leader, although the asymmetries are far less stark than they are in NAFTA. Germany is the hub in Factory Europe.
2.2.2. The 2nd unbundling’s impact
Many economists think of the 2nd unbundling as just like the first – only applied to parts and components rather than final goods (Grossman and Rossi-Hansberg 2008). This is wrong. The 2nd unbundling transformed the world economy and continues to do so today. Globalisation’s 2nd unbundling was marked by five top-line facts:
1. Reversal of the big income divergence
After rising since the steam revolution, the G7 nations’ share of world income reached its peak in 1988 at two-thirds (Figure 7). The 2nd unbundling reversed this. The offshoring of labour-intensive stages of manufacturing and heightened international mobility of technology produced spectacular growth in emerging markets whose economic reforms fostered and were fostered by the rapid industrialisation.
The reversal has been remarkably fast. By 2010, the G7’s share is down to half (Figure 7). This share is likely to continue to sag for decades; the G7 holds only a tenth of the world’s people.
This reversal-of-fortunes is perhaps the most momentous change in the last 100 years. It is reshaping every aspect of international relations. The ‘rocket engine’ is the rapid
industrialisation in emerging economies.
2. South industrialisation & North de-industrialisation
The 2nd unbundling reversed 19th and 20th century industrialisation/de-industrialisation trend. Since the early 1970s, with a significant pick up in the 1990s, the North has de-industrialised and the South industrialised (Figure 8).
De-industrialisation is a pervasive trend among developed nations, but the South’s rapid industrialisation has been driven by excellent performances of just a dozen nations – all of them heavily involved in international supply chains and most of them in Asia. The performance of Chinese manufacturing alone accounts for much of the reversal.
5
1988, 67% 0% 10% 20% 30% 40% 50% 60% 70% 80%
1820 1830 1840 1850 1860 1870 1880 1890 1900 1910 1920 1930 1940 1950 1960 1970 1980 1990 2000 2010
Source: World Databank from 1960; Maddison pre-1960; pre-1960, G7=W.Europe, US, Canada, Australia &
N.Zealand
G7 share of world GDP, 1820-2010
Figure 7: Reversal of the big divergence
0% 10% 20% 30% 40% 50% 60% 70% 80%
1970 1975 1980 1985 1990 1995 2000 2005 2010
S h ar e of w or ld m an u fac tu rin g G D P
Source: UN online database, unstats.un.org
HQ economies = G7, other factory economies = Korea, Malaysia, Thailand, Singapore, India, Indonesia, Brazil, Mexico, and Turkey
'Headquarter' economies China
China + Other 'factory' economies
Figure 8: Reversal of industrialisation/de-industrialisation trend
3. Rise of 21st century trade: the trade-investment-services-IP nexus
20th century trade meant goods crossing borders. 21st century trade is radically more complex for a very simple reason. Internationalising supply chains internationalised the complex two-way flows that used to take place only within factories (Figure 3).
This is why it is misleading to view the 2nd unbundling from the perspective of the 1st unbundling. The rise of global supply chains is much more than extra trade in parts and components. The heart of 21st century trade is an intertwining of:
• Trade in goods, especially parts and components;
• International investment in production facilities, training, technology and long-term business relationships;
• The use of infrastructure services to coordinate the dispersed production, especially services such as telecoms, internet, express parcel delivery, air cargo, trade-related finance, customs clearance services, etc.; and
• Cross-border flows of know-how such as formal intellectual property and more tacit forms such as managerial and marketing know-how.
To stress its interconnectedness, I call this the trade-investment-services-IP nexus.6 4. New industrialisation path: joining rather than building industrial supply chains The 2nd unbundling revolutionised development options faced by poor nations. Before the rise of global supply chains, nations had to build a deep and wide industrial base before becoming competitive. This is the way the US, Germany and Japan did it. After the 2nd unbundling, nations could industrialise by joining international supply chains (Baldwin
6
2011b). Joining supply chains is drastically faster and surer than the old import-substitution route. The developing nations that adopted this new strategy are called ‘emerging market economies’.
The new join-instead-of-build development paradigm also transformed the political economy of policy reform.
5. New political economy of liberalisation
Many pro-industrialisation policies from the pre-ICT era – import substitution policies, FDI and local-content restrictions, state-owned enterprises, etc. – turned out to be hindrances to joining supply chains. Many developing nations dropped the old policies to attract offshored manufacturing jobs and investment. This revolutionised the world of trade and investment policy.
South Asia
Sub-Saharan
Africa
Middle East & North Africa
East Asia & Pacific 0
5 10 15 20 25 30 35 40 45 50
Source: World Databank Average developing-nation tariffs by region
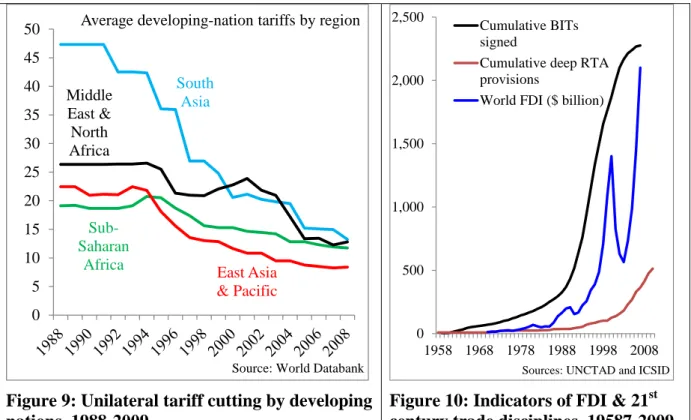
Figure 9: Unilateral tariff cutting by developing nations, 1988-2009
0 500 1,000 1,500 2,000 2,500
1958 1968 1978 1988 1998 2008
Sources: UNCTAD and ICSID
Cumulative BITs signed
Cumulative deep RTA provisions
World FDI ($ billion)
Figure 10: Indicators of FDI & 21st century trade disciplines, 19587-2009
Before the 2nd unbundling, the political economy of trade liberalisation was “I’ll open my market if you open yours”.7 After the 2nd unbundling, the political economy was mostly unilateral: “I’ll open my borders and adopt pro-nexus reforms to attract factories and jobs”. Many emerging economies unilaterally liberalised tariffs, embraced business, and pro-investor policies.
The volte face in the political economy of trade liberalisation is most obvious in the developing nation’s marked unilateral reduction of tariffs (Figure 9).8 The new pro-trade, pro-investment attitude can also be seen in nations’ willingness to embrace disciplines on ‘Beyond the Border Barriers’ (BBBs) in ‘deep’ trade agreements with their key supply chain
7
It was a game played mostly by rich nations. Developing nations were not required to reciprocate under the GATT’s ‘Special and Differential Treatment’ principle.
8
partners.9
Starting in the mid1980s and accelerating sharply in the 1990s, nations signed agreements with new disciplines to underpin the trade-investment-services-IP nexus (Figure 10).10 Important multilateral progress on these issues was made with the Uruguay Round’s
inclusion of intellectual property, investment and services, but the multilateral route was shut when the Doha Round focused firmly on 20th century trade issues. As can be seen in Figure 10, the number of 21st century disciplines in RTAs exploded in the 2000s.11
9
Asymmetric in the sense that the agreements required the developing nation to change large swaths of laws and regulation but require almost no regulatory reform of the developed nation partner.
10
These include provisions on investment, capital flows, intellectual property protection, competition policy, services trade, and industrial standards and regulations; see WTO (2011) for detailed analysis.
11
3.
E
CONOMICS OF SUPPLY CHAIN UNBUNDLINGSupply chains are as old as industry. Automobiles require tires which require rubber; steel requires iron which requires iron ore. The supply chain is the sequence of plants that provide these inputs. The value chain is a broader concept popularised by Michael Porter.
Porter thought that firms spent too much time and money performing stages and support activities where they had no competitive advantage (Porter 1985). This is why Porter
squeezed the supply chain into a single stage, ‘operations’, while breaking out pre- and post-fabrication stages, and support activities. Porter’s main thought was to apply the Ricardian principle of comparative advantage to firm’s value chains. He told firms to focus on what they do best and to outsource for the rest. Porter is not the right framework for thinking about value chains in 2012 – in large part because most firms followed Porter’s advice.
Globalisation’s 2nd unbundling shifted the locus of globalisation from sectors to stages of production. This requires an analytic focus on supply chains. The economics of this change is best looked at by decomposing it into two phenomena: fractionalisation and dispersion.
• Fractionalisation concerns the unbundling supply chains into finer stages of production.
• Dispersion concerns the geographic unbundling of stages.
3.1. Supply chain unbundling: The functional dimension
To consider why ICT improvements lead to the unbundling of production, it is useful to view the supply chain at four levels of aggregation: products, stages, occupations, and tasks
(Figure 11). At the bottom is the product, which is conceived of as including after sales services. At the top are tasks – the full list of everything that must be done to get the product into consumers’ hands and provide them with associated after-sales services.
Product Occupation
Occupation
Stage Stage
E F
D
A B C G H I J K L
Occupation
Occupation Occupation
O
ccupations:S
tages:T
asks:P
roduct:The TOSP framework
Figure 11: Tasks, occupations, stages and product – the TOSP framework
Notes: The circles represent individual tasks, the rectangles represent individual occupations and the ovals represent individual stages of production.
One natural intermediate aggregation is ‘occupation’ – the group of tasks performed by an individual worker. Stages – defined as a collection of occupations that are performed in close proximity due to the need for face-to-face interaction, fragility of the partially processed goods, etc. – are the critical level of aggregation since supply chain internationalisation
typically involves the offshoring of stages rather than individual occupations or individual tasks.
With this in hand, consider the economics of the optimal: 1) Tasks per occupation; and
2) Occupations per stage.
3.1.1. Functional unbundling: Specialisation versus coordination and risk
Adam Smith had it right – specialisation pays – or as he described it in his famous pin factory example, a finer division of labour boosts productivity. Rather than hiring dozens of workers each of which performs all the tasks of making a pin, 18th century pin makers allocated
individual tasks to individual workers (although Smith called them “operations”, not “tasks”). The downside of splitting up tasks is the difficulty of coordinating the whole process.
Moreover, a long supply chain also tends to be risky – the famous weakest-link property. In a nutshell, the optimal allocation of tasks to occupations is governed by the trade-off between specialisation and coordination.
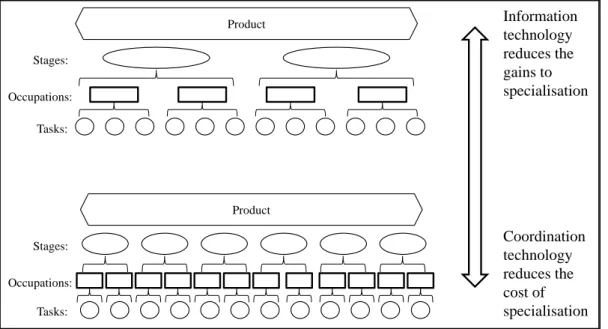
As the ICT revolution rolls on, this fundamental trade-off is shifting towards more stages. The effects, however, are not straightforward, as Bloom et al (2006) show. Some ICT improvements reduce the benefits of specialisation while others reduce the costs of specialisation.
ICT affects the optimal division of labour via two channels:
• Communication and organisational technologies – call them coordination
technologies for short – facilitate transmission of ideas, instructions and information. Good coordination technology favours fewer tasks per occupation and fewer occupations per stage.
• Information technology makes it easier for individual workers to master more tasks.
Product
I I I I
I I I I I
I
I I
Occupations: Stages:
Tasks:
Product
I I I I
I I I I I
I
I I
Occupations: Stages:
Tasks:
Coordination technology reduces the cost of specialisation Information technology reduces the gains to specialisation
This happens in several ways. Computerising tasks and embedding them in machinery is one. Numerically controlled machines, robots, computer-aided manufacturing, etc. embed
information in capital in a way that allows a single worker to perform a wider range of tasks. Task that used to be done by a team of specialised workers can be done by a single worker operating the machine.
This basic communication-technology versus information-technology trade-off is illustrated schematically in Figure 12. In a nutshell:
• Better coordination technology reduces the cost of specialisation and thus fosters functional unbundling.
• Better information technology reduces the benefits of specialisation and thus disfavours functional unbundling.
This insight has recently received some empirical support from Lanz et al (2012). They find that offshoring of business services complements manufacturing activities, in the sense that increased import penetration in business services is associated with a shift in local task content from information and communication related tasks towards tasks related to handling machinery and equipment. Offshoring of other services complements local information-intensive tasks in that it shifts local task composition towards ICT-related tasks.
3.2. Geographical unbundling: Balancing dispersion & agglomeration forces
Locational decisions have been studied for centuries. The touchstone principle is that firms seek to put each stage in the lowest cost location. The cost calculation involves a trade-off between direct factor costs and ‘separation’ costs.
• The direct costs include wages, capital costs and implicit or explicit subsidies.
• The separation costs should be broadly interpreted to include both transmission and transportation costs, increased risk and managerial time.
The location decision may also be influenced by local spillovers of various types. In some sectors and stages, say fashion clothing, proximity between designers and consumers may be critical. In others, product development stages may be made cheaper, faster and more
effective by co-location with certain fabrication stages. Yet other stages and sectors are marked by strong technological spillovers that make clustering of producers the natural outcome.
The mainstream framework for studying the impact of market size on industrial location is the so-called New Economic Geography literature launched by Paul Krugman in the 1990s (e.g. Krugman 1991, Fujita, Krugman and Venables 1999). The New Economic Geography perspective views the locational outcome as balancing dispersion forces and agglomeration forces.
3.2.1. Dispersion forces
Dispersion forces favour the geographic dispersion of stages. There are two prominent dispersion forces in the supply-chain context:
• Skilled and unskilled labour wages gaps determine ‘vertical specialisation’.
The offshoring of labour-intensive stages from Japan, US and Germany to their nearby low-wage neighbours is driven by two low-wage gaps. Low-skill labour is much dearer in the ‘headquarter’ economies (e.g. US, German, Japan) than it is in the nearby ‘factory’ economies (Figure 13). High-skill labour, however, remains relative abundant and thus relative cheap in headquarter economies (Figure 14). The result is a spatial sorting of
skill-intensive stages to high-wage nations and labour-skill-intensive stages to low-wage nations. This is the key to North-to-South offshoring.
• Firm-level specialisation and excellence determine ‘horizontal specialisation’. Factor prices are not the only consideration; as Figure 4 shows, international supply chains have long existed among high-wage economies. The dispersion here is driven by a much more micro gain from specialisation.
For example, when it comes to automobile air conditions, the Japanese company Denso and the French company Valeo dominate their markets through excellence – not low wages. While each could in principle make their own auto air conditioners, scale economies mean that it is cheaper for Swedish and German auto firms to source them from France. Given the systemic importance of learning-by-doing and the growing role of scale economies in an ever more fractionalised supply chain, it is natural that regional champions will emerge in
particular parts and components. This is the key to the ‘horizontal’ internationalisation of supply chains among high-wage nations.
2008
$0 $50
Mexico Canada US Poland
Czech… Portugal
UK Italy France NL Germany China Philipp… Taiwan
Korea Singapore Japan
Source: US Bureau of Labor Statistics, Int'l Labor Comparisons
Hourly labour costs, manufactures
Figure 13: Wage differences in Factory Asia, Factory North American and Factory Europe
0% 1% 2% 3% 4%
0% 10% 20% 30% 40% 50% 60% 70%
Source: World Databank online
Primary degree or less
Secondary degree or more
R&D/GDP (right scale)
Figure 14: Education and R&D: ASEANs, China, Korea, US, Japan and Canada, 2005
3.2.2. Agglomeration forces
Agglomeration forces are the opposite of dispersion forces – they encourage geographical clustering. Technically, an agglomeration force is said to exist when the spatial concentration of economic activity creates forces that encourage further spatial concentration.
There are many agglomeration forces, but some of them only operate on a very local scale. These local agglomeration forces, such as knowledge spillovers, help explain why firms in the same line of business so often cluster. When it comes to locational unbundling of supply
chains – a phenomenon that spans the globe in some cases – these are too local to provide much explanatory leverage. The most important agglomeration forces for global supply chains are supply-side and demand-side linkages.12
These are subject to what might be called ‘circular causality’ (Figure 15):
• Demand-linked circular causality rests on market-size/demand issues;
If an economy already enjoys the presence of great deal of economic activity (GDP), then doing business in the economy will – all else equal – be attractive to firms seeking to be near their customers. As this attraction draws more firms and more economic activity, the cycle continues. Were it not for dispersion forces, extreme location outcomes would be observed. Indeed in the case of some cities like Tokyo, demand-links have resulted in a truly astounding share of activity concentrated spatially. This is one key reason why manufacturers continue to produce in high-wage nations. Customers attract suppliers whose workers become new customers.
• Supply-linked circular causality rests on cost-of-inputs issues.
Since firms source intermediate inputs from other firms, the presence of many firms in a given location tends to make that location attractive to new firms from the input-cost perspective. This is one key reason why China is such an attractive location for the production of new goods – especially in electronics. Suppliers attract more suppliers.
Key
determinant: Input buying costs
Relocation causes
input-cost shifting Big-market
advantage induces relocation
Supply -linked circular causality
Big market input-supply Share of firms in
the big market
Key
determinant: Output selling costs
Relocation causes expenditure
shifting Big-market
advantage induces relocation
Demand -linked circular causality
Big market size Share of firms in
the big market
Figure 15: Circular causality & agglomeration forces
Generally speaking, demand-links operate on an economy-wide basis, while supply-links operate more on a sectoral basis.13
In this framework, the location of industry shifts to balance agglomeration and dispersion forces (Figure 16). Extreme solutions are occasionally observed, but interior solutions are the more common outcome.
Trade costs and hump-shaped agglomeration
While the interplay of agglomeration and dispersion forces determines the equilibrium
12
Called, respectively, forward and backward linkages by 20th century writers like Albert Hirschman. 13
The reason is that a clustering of firms means a clustering of workers and thus a clustering of purchasing power. However, the purchasing power tends to get spent on the whole range of goods.
location of industry, changes in trade costs can have unexpected effects.
Lower trade and transportation costs makes distance less of an issue and thus weaken both agglomeration and dispersion forces. If the agglomeration forces weaken more than the dispersion forces, clustering weakens; if the opposite happens, clustering get more pronounced.
This logic explains why that clustering tends to follow a ‘hump shaped’ pattern as trade costs fall. Consider the polar examples:
• When trade is highly restricted, it is very unprofitable for firms in one region to sell to other regions; each region makes their own.
• At the other extreme of perfectly costless trade, location region is immaterial.
In short, agglomeration is not necessary when trade costs are zero; it is not possible when trade costs are very high. In between these two extremes, being in a cluster is both possible and rewarding.
Agglomeration forces:
Demand-links & Supply-links Dispersion
forces:
Wage gaps & specialisation
Location adjusts to balance the forces
Figure 16: Equilibrium location balances agglomeration and dispersion forces.
This widely known feature of the New Economic Geography logic leads to the seemingly contradictory conclusion that lowering trade costs when they are high tends to produce a concentration of economic activity (in the North, as history would have it). However beyond some threshold level, further trade cost reductions leads to dispersion away from the North. This explains how globalisation’s first and second unbundlings could have diametrically opposed effects on the agglomeration of industry and overall economic activity.
This hump-shaped outcome in global economic activity is shown in Figure 7.14 The first unbundling fostered agglomeration in the North while the 2nd unbundling fosters dispersion. The salient point is that the world today is beyond the crest; lower trade costs will almost surely foster greater dispersion of economic activity to the South.
3.2.3. Agglomeration economies and supply-chain location
New economic geography is useful in thinking about the micro, or firm-level, determinants of location, but it was originally designed to study the emergence of large-scale – i.e. across
14
This data, from the economic historian Angus Maddison, differs in the peak year from the more modern data series used in Figure 7.
regions and nations – economic structures. The baseline here is the observation that economic activity tends to become more concentrated as economic integration proceeds (Marius 2001, Niepmann and Felbermayr 2010).
The obvious application here is China. The vast agglomeration of manufacturing capacity that has assembled in China since 1990 will – by itself – continue to attract manufacturing activity. As China’s low-wage advantage erodes the new economic geography framework predicts a dispersion of activity beyond China – not a disappearance. The key work here is Paul Krugman, Tony Venables and their students; particularly relevant is the ‘island hopping’ framework introduced by Puga and Venables (1996). Starting from a situation where all industry is in one nation, they show how productivity/wage growth induces firms to move offshore to a second location once a threshold wage is reached.
The key points here are that the spread is not even – the departing industry does not spread out evenly, it concentrates in just one new location to benefit from agglomeration rents. Moreover, the relocation does not empty out the first location/nation but rather slows the growth of new manufacturing activity. As the second location’s wages are driven up, a third location/nation emerges for offshoring. This is, in essence, the geographical dimension of the flying geese pattern whereby one East Asian nation after the other benefits from a cluster of industrial activity.
3.2.4. GSCs and the 2nd unbundling
Treating the functional and geographical dimensions of unbundling separately is convenient analytically but it misses one important interaction. Functionally unbundling the supply chain can be done in a way that results in stages that have more homogenous skill/technology demands. This is advantageous given the vast wage differences (Figure 13). In other words, supply chain fractionalisation may be driven in part by the possibility of offshoring low-skilled stages to low-wage nations. This is illustrated in Figure 17; a single stage, initially located in Japan, is unbundled into two stages so the low-skill tasks – marked by an ‘L’ in the circles – can be clustered and offshored to China. The relatively skill-intensive stage stays in Japan (the ‘H’ in the circle indicates a high-skilled task).
L L
Occupations: Stage:
Tasks: H L L L
&
L H
Figure 17: Schematic illustration of function and location unbundling interactions
3.3. Smile curve economics
The 2nd unbundling made it feasible to offshore stage of production; some stages moved, others did not. Curiously, value added along the value chain seemed to shift away from the offshored stages. This observation is known as the “smile curve” which shows the value added at each stage of production (Figure 18). This curve asserts that fabrication – especially final assembly – involves less value creation today than it did before the 2nd unbundling – the smile deepened, so to speak.
Stage Stage’s share of
product’s total value added
Manufacturing stages
Sales,
marketing and after sales services Product
concept, Design, R&D
21stcentury value chain
1970s value chain
Figure 18: The smile curve: Good and bad stages in the value chain.
Nokia N95 example
The allocation of value added along a value chain can be seen in the decomposition of the total retail sales price of the Nokia N95 phone (Ali-Yrkkö et al 2011). Although the phone is mostly ‘made’ in Asia, Figure 19 shows that most of the value added accrues in Europe. The total value added in Europe depends on where the phone is sold (retail margin) and
assembled (China or Finland). In the worst of cases – an N95 assembled in China and sold in the US – more than half the value added is in Europe; the high end figure is 68%.
3.3.1. Why did the smile deepen?
A definitive answer to this question will require a great deal more empirical research, but simple economics suggests an obvious explanation – cost accounting. When a stage’s cost is reduced by offshoring, its share in value added falls since a stage’s value added is based on costs. Even if the cost-saving is fully passed on to consumers, the offshored stage’s share of value added will fall. This basic cost-accounting effect can be amplified by:
• Relative market power
Offshored tasks tend to be things that can be done in many emerging nations – most of them are eager to attract such stages. The non-offshored stages, by contrast, tend to involve things where firms naturally have market power due to product differentiation, branding, etc. In short, offshored tasks become commoditized; the onshore tasks do not.
• Internationally mobile technology
If the offshoring firm moves its advanced technology to the offshore location, it drives down the cost of the offshored task even more. As before, this automatically shifts value to the non-offshored tasks.
P
roc
es
sors
M
em
ori
es
O
the
r i
nt
egra
te
d
cir
cu
its
Di
sp
la
y
Ca
m
era
O
the
r pa
rt
s
N
oki
a**
Asse
m
b
ly
D
is
tr
ib
u
tio
n
R
eta
ilin
g
0% 20% 40% 60% 80% 100%
L
icen
ses
*
Figure 19: Breakdown of the phone’s €546 pre-tax retail price circa 2007
Note: * Includes protocols, the operating system, pre-installed software, etc.: ** Nokia outsources only 20% of assembly. N95 was assembled in Beijing (China) and Salo (Finland) by Nokia Employees.
3.3.2. Smiles and good jobs
Smile curve economics suggests that the fabrication stages in manufacturing may not be the development panacea as they once were. Global supply chains made industrialisation faster and easier (the supply chain made industry less lumpy). Industrialisation became less meaningful for the same reasons. For example, that Korea could export domestically-designed car engines was testimony to its rich-nation status. Now, exporting sophisticated manufactured goods is no longer the hallmark of having arrived. It may simply reflect a nation’s position in a global supply chain.
This observation calls for a good deal more thinking on the role of manufacturing in
development strategies (Baldwin 2011b). After all, the originator of the smile-curve concept used it to argue for a need to diversify away from fabrication.
As far as the evolution of GSCs is concerned, it is important to note that the pre- and post-fabrication stages consist primarily of services rather than goods. As such, shifting the location of such stages will have a first-order impact on the pattern of transmission, not transportation. Of course a second order impact (location of fabrication influenced by location of design etc) is likely, but determinants of comparative advantage in pre- and post-fabrication service are quite different from post-fabrication, and the cost of transmitting these services is quite low. This suggests that shifts in the pre- and post-fabrication stages will not have a major impact on supply-chain trade patterns when it comes to goods.
4.
W
HAT IT MEANS FOR POLICYAs mentioned above, 21st century trade – or more precisely 21st century international commerce – is a richer, more complex, more interconnected set of cross-border flows of goods, investment, technology, services, technicians, managers and capital. This transformed policy making globally, first by creating new supply and new demand for deeper disciplines, and second by creating a bond among various strands of policy making – some of which were always viewed as international but many are traditionally viewed as domestic policy issues. This section considers the implications of global supply chains for global economic policy.
4.1. The nexus: More interconnected policy
The quantum leap in complexity and interconnectedness has had momentous implications for world trade governance – shifting it sharply towards regionalism and eroding WTO
centrality. Before turning to these points, it is worth pointing out that there is nothing really new here. The basic challenge of supply-chain trade and the basic response of deeper, regional disciplines has been a feature of global governance for a half century.
Before the 2nd unbundling really got going in the late 1980s, most trade was simple. It could be governed by simple regulations like the GATT 1947 (less than 100 pages long). The GATT rules, however, were not sufficient for the cross-border relations where supply chains were an issue in the 1960s and 1970s. As Figure 4 shows, some trade relations back then were marked by supply-chain trade and so was the need for deeper-than-GATT disciplines. In response, North Atlantic nations set up deeper disciplines. Since the trade was regional rather than multilateral, the deeper disciplines were placed in regional trade agreements. The 1965 US-Canada Auto Pact, which regulated trade and investment in the auto sector, is a classic example.
The Auto Pact was a clear violation of GATT rules (Article XXIV) but US officials argued that the Pact “was designed to promote trade and economic efficiency within this single industry by bringing about such reallocation of production between the two countries as would permit Canada to achieve substantial economies of scale on some components and some models, while abandoning others.”15 It is hard to think of a clearer statement of the goals of North-North trade-investment nexus.
The European Economic Community (as the EU was known at the time) similarly sought much deeper disciplines. This, however, was not aimed at underpinning existing, complex cross-border activity. It was aimed at creating it. The European founders viewed an ever closer economic integration as the only sure-fire means of avoiding another European war.16 As Figure 6 shows, it worked.
The history lesson here is simple. Complex cross-border flows demand complex rules. Since most complex trade is regional, there is a strong tendency to establish the necessary complex rules at a regional rather than multilateral level. Multilateral rules would almost surely have been more efficient, but negotiating them in the GATT would have been too cumbersome and slow; most GATT members were not involved in this type of international commerce.
4.1.1. Which new disciplines are needed?
The trade-investment-services-IP nexus creates a need for two new types of disciplines.
15
Patterson (1966), page 356. 16
These correspond to the two new elements of the associated international commerce.
• First, supply-chain trade often involves producing abroad, either directly or via long-term relationships with independent suppliers.
This is basically the investment and intellectual property part – setting up business abroad is an essential part of 21st century trade. This means that barriers to doing business abroad are now trade barriers. Likewise, much of the internationalisation of supply chains involves overseas application of a firm’s advanced know-how. A lack of IP protection therefore becomes a barrier to trade.
• Second, production among the facilities must be coordinated and this involves the two-way flow of goods, services, people, capital, and training.
Barriers to these flows are now barriers to trade. Note that traditional trade barriers are part of this, but the list is much longer as the cross-border flows are more complex (express mail, air cargo, trade financing and insurance, business mobility, etc.).
Table 2: Selected deeper than GATT provision in RTAs WTO-plus areas
Technical barriers to trade
Affirmation of rights and obligations under WTO Agreement on TBT; provision of information; harmonization of regulations; mutual recognition agreements
State trading enterprises
Establishment or maintenance of an independent competition authority; non-discrimination regarding production and marketing condition; provision of information; affirmation of Art XVII GATT provision
Trade-related investment measures
Provisions concerning requirements for local content and export performance of FDI
Services Liberalisation of trade in services WTO-X areas
Competition Policy Maintenance of measures to proscribe anticompetitive business conduct; harmonisation of competition laws; establishment or maintenance of an independent competition authority
IPR Accession to international treaties not referenced in the TRIPs Agreement Investment Information exchange; Development of legal frameworks; Harmonisation
and simplification of procedures; National treatment; establishment of mechanism for the settlement of disputes
Movement of Capital Liberalisation of capital movement; prohibition of new restrictions Regional Cooperation Promotion of regional cooperation; technical assistance programmes Source: WTO’s Anatomy of PTAs database, http://www.wto.org
On good source of the necessary disciplines is the deep regional trade agreements that have been signed among nations where the trade-investment-services-IP nexus trade is important. Following a procedure established by Horn, Mavroidis and Sapir (2009), the WTO recently created a database of deeper disciplines in all the RTAs announced to the WTO by 2010. While the data covers over 50 measures, few of these occur frequently enough to be
important. Table 2 shows a selection of deeper-than-GATT disciplines that appear frequently in modern trade agreements. The term ‘WTO-plus’ applies to issues that are covered by WTO discipline but where the RTA involves commitments that go further. The ‘WTO-X’
term applies to disciplines that are not mentioned in WTO agreements, so the RTA provisions are creating new rules rather than extending or deepening existing disciplines.
4.2. 21st century regionalism and the WTO’s erosion
Globalisation’s 2nd unbundling created a new type of win-win situation in international commerce. The old type was ‘my market for yours’; the new type is ‘my factories for your reform’. This spawned massive demand for new disciplines from ‘headquarter economy’ firms and a massive supply of new disciplines from ‘factory economy’ governments. As the WTO was occupied with the Doha Round and its emphasis on 20th century issues (tariffs and agriculture), supply met demand in regional trade agreements – just as it did in the 1960s. More precisely, the supply-chain governance gap was filled by uncoordinated developments in deep regional trade agreements, bilateral investment treaties, and
autonomous reforms in emerging economies. The resulting package of deeper disciplines is what I have called 21st century regionalism (Baldwin 2011a) – a theme taken up in the WTO’s 2011 World Trade Report (WTO 2011).
21st century regionalism is a threat to the WTO’s centrality in multilateral trade governance, but not in the way that 20th century bilateralism was. It is not useful to think of 21st century regionalism using the analytic frameworks establish by last-century thinkers like Jagdish Bhagwati when regionalism was mostly about tariff preferences. 21st century regionalism is not primarily about preferential market access as WTO (2011 Chapter B) demonstrates convincingly. 21st century regionalism is about disciplines that underpin the trade-investment-service-IP nexus. Because of this, 21st century regionalism is a threat to the WTO’s role as a rule writer, not as a tariff cutter.
Stepping away from what is towards what should be, it is absolutely clear that the optimal governance solution for global supply chains would be global, not regional. Indeed the firms conducting much of this 21st century trade find themselves faced with a spaghetti bowl of disciplines – although this is tamed by the fact that the US, Japan and the EU have
established a system of hub-and-spoke bilateral agreements that tends to reduce conflicts for firms located in a hub. The real problem is for the spokes like Mexico which has deep agreements with the US, EU and Japan.
5.
F
UTURE OFGSC
SThe future of global supply chains will be moulded by the answers to three questions:
• Will supply chains become more fractionalised?
• Will stages of production become more polarised in terms of skill-, capital- and technology-intensity?
• Will stages of production be further dispersed and interconnected internationally? Fractionalisation of the supply chain is determined by the interplay between the gains from specialisation and cost of coordination and risk (see Section 3). The specialisation gains come from scale economies and learning-by-doing as well as a heightened ability to place each stage in a nation with the most appropriate wage structure. Coordination and risk costs come from the extra difficulty and expense of managing spatially distributed stages. Unbundling along the functional dimension will be directed by changes in these costs and benefits of fractionalisation.
Polarisation of stages is determined by the costs and benefits of computerisation and robotisation of manufacturing. The future course on this issue is largely governed by advances in information technology broadly interpreted.
Today’s situation
IT improves faster than CT CT improves faster than IT
Less complex supply chain: fewer but more polarised stages (in terms of capital-and skill-intensity); fewer low-skilled stages More complex supply chains: number of stages and nations
Today’s situation
Trade & transportation costs fall Trade & transportation costs rise
More global sourcing, global supply chains More ‘nearshoring’, regional supply chains
Today’s situation
Wage gap widens Wage gap narrows
More intermediates trade of vertical type More intermediates trade of horizontal type
Figure 20: Future of international supply chains
The geographic spread and international complexity of supply chain stages are determined by the costs and benefits of scattering stages of production. The cost of dispersion falls as
coordination technology improves and transportation and travel costs fall. The gain from dispersion rises with the diversity of production conditions in various nations – most notably the size of wage gaps. Unbundling along the geographic dimension will be directed by changes in these costs and benefits of dispersion.
It is impossible to know what the future path will be for these four determinants. This section considers various combinations and their likely impact on GSCs. Figure 20 helps organise ideas.
5.1. Information vs coordination technology
Rapid improvement in coordination/communication technology – such as important advances in telepresence technology, workflow organisation and communications software – favours supply chain unbundling functionally and geographically (Section 3). The resulting finer division of labour will allow firms to sort stages geographically according to the cost of the relevant productivity factors (labour, capital, technology, etc.). Other things equal, this will result in more, and longer-distance, trade in parts and components. Thus rapid advances in coordination/communication technology will lead to more complex supply chains. This is illustrated in the top of the leftmost panel of Figure 20. Box 1 discusses a number of radical technological breakthroughs that might have important implications for the future of global supply chains.
Better information technology, by contrast, favours bundling of many tasks into the ambit of individual workers. This will typically result broader occupations and few separate stages of production. Other things equal, this would tend to reduce international trade in parts and components.
Box 1: Extreme CT: Telepresence, remote surgery and the death of meetings Another revolution development would radically reduce the need for technician and managers to travel to remote factories. Products such as Cisco’s Telepresence already reduce the need for face-to-face meetings in the service sector. If such technology were combined with human controlled robots of the type used today in operating room (e.g. Intuitive Surgical’s da Vinci Surgical System), technicians could conduct inspections or undertake repairs from remote locations.
This is not science fiction. The US military already operates many of its drone aircraft in Western Asia from bases in the US. A company called Remote Presences does underwater survey, inspection and recovery using Remotely Operated Vehicles. And some US hospitals are using remote presence robots to leverage the time of doctors across hospitals (see video http://www.youtube.com/watch?v=qRx7CdseGsQ).
The implications of this would be to de-regionalise supply chains – at least to the extent that the time-cost of travel was a significant consideration in offshoring locations.
Better information technology also tends to polarise stages of production. As routine, low-skilled, and repetitive tasks are easier to computerise and robotise, the
information-technology-led bundling will typically eliminate occupations that involve such tasks. At the same time, the more intensive use of sophisticated production machines will make the remaining jobs more skill-, capital- and technology-intensive. This leads to a polarisation of stages in terms of skill-content. Routine low-skill tasks are bundled into high-skill
occupations while the remaining low-skilled tasks will typically be highly labour intensive but less routine. The resulting, broader stages will involve more capital-intensive, more technology-intensive and more skill-intensive processes. This tends to favour production in high-wage nations (see bottom of the leftmost panel in the figure).
Box 2 discusses some futuristic IT developments that might have a large impact on supply chains.
Box 2: Extreme IT: ‘Compufacturing’ or taking the man out of manufacturing When thinking about the future of global supply chains, it is worth speculating on truly revolutionary technological developments. One such possible development concerns Computer Integrated Manufacturing (CIM). This has already produced a tectonic shift
in manufacturing in high-wage nations – moving from a situation where machines helped workers make things to a situation where workers help machines make things. Perhaps manufacturing will be called “compufacturing” in the future.
Figure 21: Schematic illustration of computer integrated manufacturing
The integration and automation of tasks, however, does not stop at the factory gate. Many design, engineering, and management tasks have been computerised (Alavudeen and Venkateshwaran 2010). Computers have greatly boosted the productivity and speed of product design as well as greatly reduced the need for prototyping. Once designed, the production process can be outlined using computer-aided process planning systems and design programmes can create instructions for numerical-control machines. Models of the manufacturing system can be simulated before they are built. The basic
manufacturing functions – machining, forming, joining, assembly, and inspection – are supported and integrated by computer-aided manufacturing systems and automated materials-handling systems. Inventory control is automated, tracking inventory movement, forecasting requirements and even initiating procurement orders. The key economic effects of CIM are:
• A radical reduction in the fixed cost and time delays associated with new models and new products;
• A shift away from mass production of identical goods to mass production of customised goods;
• An heightened possibility for spatial unbundling of certain segments of the value chain as digitized information makes coordination at distance less complicated;
• A bundling of many tasks previously undertaken by individual workers of varying skill levels into advanced machinery and computers;
• A polarisation of the shop floor.
The polarisation, as Autor et al (2003) pointed out, stemmed from the fact that
computers were substitutes for some workers but complements for others. Demand for routine, low-skill tasks dropped as they were easy to computerise and robotise. By contrast, computers boosted labour productivity in tasks demanding flexibility, creativity, generalized problem-solving capabilities, and complex communications. Cheaper computers and robots lowered demand for low-skill labour fell and raised
demand for high-skill workers.17
A special report by the Economist Magazine extrapolates these trends even further. It notes that manufacturing may be going through a new industrial revolution due to the advent of ‘3D printing’ or additive manufacturing. This bundles virtually all stages of manufacturing into a single machine. Combined with the virtual designing made possible by Computer Aided Design systems, this would take manufacturing very close to the Star Trek replicators.
Supply chain unbundling is driven by a fundamental trade-off between the gains from specialisation and the costs of dispersal. This would be seriously undermined by radical advances in the direction of mass customisation and 3D printing by sophisticated machines. Whether these machines end up in high-wage, high-skill nations, or they are distributed to be near every large customer base, the impact would be a very substantial reduction in supply-chain trade.
To put it sharply, transmission of data would substitute for transportation of goods.
5.2. Wage gap convergence may increase supply-chain trade
One of the most remarkable trends in recent years has been a narrowing of wage differences between developed and developing nations. The implications for this trend are illustrated in the middle panel of Figure 20. This trend is having, and will continue to have, two distinct effects on international supply chains.
• First, wage convergence changes the nature of trade between the converging nations. Specifically, developing nations like China are producing sophisticated intermediate goods that previously were imported.
• Second, as wages rise in China, Mexico, Poland, etc, the geographically extent of supply chains widens to include new low-wage nations like Vietnam.
The view that global supply chains are driven mainly by large wage gaps is highly
misleading. The perfect illustration is the US auto industry where there is more US offshoring to high-wage Canada than there is to low-wage Mexico.
As Figure 4 shows, supply-chain trade was prevalent among nearby high-wage nations like Canada and the US, and within Western Europe even before the 2nd unbundling and it is still very high today. This is the ‘horizontal’ specialisation type discussed above – specialisation that is based on firm-level excellence rather than wage gaps. As such specialisation is not generally subject to local clustering effects, the result is massive two-way flows in similar goods.
Figure 21 shows a different measure of supply-chain trade that is more easily calculated for specific bilateral trade flows. The measure – intra-industry trade – gauges the overall between imports and exports at a finely defined sectoral level – say electrical machinery. This is an imperfect proxy since some of the intra-industry trade is in final goods, but a great deal is in intermediate goods.
17
Of course, this is not the first time automation has polarised the factory jobs. In the 19th century, mechanized looms replaced medium-skilled textile workers with low-skilled, low-wage workers. A process immortalised by the machine-wrecking tactics of Luddites.
France-Germany
NAFTA-NAFTA US-EU25
ASEAN-ASEAN
Japan-ASEAN
China-ASEAN
US-China 0%
10% 20% 30% 40% 50% 60% 70% 80%
1962 1965 1968 1971 1974 1977 1980 1983 1986 1989 1992 1995 1998 2001 2004 2007 2010
Figure 22: Indicator of supply-chain trade North-North vs North-South
The clear messages from these figures are:
• Despite the 2nd unbundling and rise of North-South supply-chain trade, such trade is substantially more prevalent among high income nations.
• North-South chain trade does not seem to substituting for North-North supply-chain trade (Japan is an exception as it assembles so much of its final goods in China). Both points suggest that income convergence will boost supply-chain trade in that it the extra horizontally specialisation will more than compensate any reduction in wage-driven, vertical specialisation.
As nations like China experience rapid income growth the volume of supply-chain trade may rise to a level more like level observed between the US and the EU. One of the best-known tenants of the ‘new trade theory’ is that countries trade more as the get larger and more similar in size. This suggests that the rapid growth of emerging markets will create more trade than it displaces. US-China intra-industry trade would have to increase sixfold to match the intensity of French-German trade.
The second trend is nothing new. In East Asia, it is known as the flying geese pattern. The industrialisation of first Japan and then Korea, Taipei, Hong Kong and Singapore raised local wages that in turn triggered offshoring to Thailand, the Philippines, Indonesia and Malaysia, and, China after 1990. As wages have begun to rise in this new set of ‘tigers’, low-skilled jobs are increasingly offshored to nations such as Bangladesh and Vietnam. Throughout this process, supply-chain trade volumes rose rapidly.
5.3. Per capital income and supply-chain trade
The discussion so far put to the side the issue of direction of trade. In a supply chain,
however, direction matters. Importing intermediates in order to export is quite different than exporting parts that help other nations export. Gonzales-Lopez (2012) calls the former ‘backward’ supply-chain trade (buying intermediates from GSCs) and the latter ‘forward’
supply-chain trade (selling intermediates into GSCs).18 As it turns out, there are some clear empirical regularities linking a nation’s level of development – as measure by per capita income – and its backwards and forwards supply-chain trade.
• As nations get richer up to a point, they use imported intermediates more intensively in their exports. Beyond a threshold – about $25,000 per year per person – the intensity diminishes (Figure 22 top panel).
• For forward supply-chain trade – i.e. the supply of intermediates to others – the relationship is flipped. It falls for low income levels but rises beyond a point near $15,000 (Figure 22 middle panel).
Combining the two measures, we get a nation’s total involvement in supply-chain (Figure 22 bottom panel).
While this research is very recent and thus not yet part of economists received wisdom, the top-line message is very much in line with the general view presented above. As China moved up from textiles and apparel to assembling electronics and machinery, the import content of its exports rose. At the other extreme, a nation like Finland has all but exited from the fabrication end of manufacturing, so domestic value added content of its exports tends to be higher. In some ways the top panel of Figure 22 can be thought of as a shadow of the smile curve.
Likewise, it is commonly known that advanced technology nations like Japan and Germany are increasingly focusing on sophisticated components that are exported for assembly elsewhere – an observation that is consistent with the middle panel of Figure 22.
Taking the fitted curves at face value gives an idea of how global supply-chain trade will develop as emerging market incomes rise. Figure 23 shows, for the nations that account for 90% of global manufacturing GDP, the size of manufacturing and the per capita income level. According to Gonzalez (2012), the backwards supply-chain trade intensity should increase for the nations below the threshold of $25,000. The forward trade should decrease for nations below $15,000. The numbers show that many important manufacturing nations are below $15,000, so further income growth in China and other factory economies will draw them more deeply into global supply chains.
While such calculations are conjectures at best, they suggest that supply-chain trade is likely to increase at least for China both on the import and export sides.
18