Nonlinear Photocurrent Spectroscopy of Layered 2D Perovskite
Quantum Wells
Ninghao Zhou, Jun Hu, Zhenyu Ouyang, Olivia F. Williams, Liang Yan, Wei You,
and Andrew M. Moran*
Department of Chemistry, University of North Carolina at Chapel Hill, Chapel Hill, North Carolina 27599, United States
ABSTRACT: Two-dimensional coherent photocurrent spectroscopies directly probe the
electronic states and processes that are relevant to the performance of a photovoltaic device. In this Letter, we apply two-pulse nonlinear photocurrent spectroscopy to a photovoltaic device based on layered perovskite quantum wells. The method effectively decomposes the photovoltaic response into contributions from separate quantum wells and excited-state species (i.e., either single excitons or biexcitons). Our experiments show that the efficiency of photocurrent generation increases with the size of the quantum well. Overall, the results suggest that energy funneling processes in layered perovskites, which are most prominent in transient absorption spectroscopies, are largely irrelevant to the function of a photovoltaic cell.
R
ecent years have seen the development of coherent two-dimensional (2D) photocurrent spectroscopies in which the nonlinear response of a photovoltaic cell is induced by a sequence of four laser pulses.1−7 In contrast to purely optical techniques, coherent 2D photocurrent spectroscopies provide information that is directly relevant to the performance of a photovoltaic cell as the signal components are weighted by the efficiency with which photocurrent is produced (i.e., an action spectrum). For example, signatures of multiple exciton generation have been observed in PbS photocells.2 Ultrafast decoherence and charge separation have also been detected in a polymer-based system.5Coherent 2D photocurrent spectros-copies differ from common optical techniques (e.g., transient absorption (TA) spectroscopy) in that they correspond to a fourth-order perturbative response.2 The order of the non-linearity is important because the interferences between terms in the fourth-order response function make the technique particularly sensitive to contributions from biexciton states.2 Thus, coherent photocurrent spectroscopies are specially equipped to provide information about the types of electronic excitations that are important for the function of a device (i.e., single excitons or biexcitons).In this Letter, we apply two-pulse nonlinear photocurrent (NLPC) spectroscopy to a “layered perovskite” photovoltaic device composed of a mixture of quantum wells. The quantum wells are described by the formula (BA)2(MA)n−1[PbnI3n+1], where MA is methylammonium and BA is n-butyl ammonium.8,9 As the value ofnincreases, the band gaps and resonance frequencies of the excitons decrease. For example, single-exciton resonances of then= 1, 2, and 3 quantum wells are found at 515, 570, and 600 nm, respectively. Moreover, smaller and larger quantum wells are primarily concentrated on
opposite faces of the film in this layered perovskite system, thereby promoting directional energy and/or charge transfer from smaller to larger quantum wells.10−13 While such dynamics have been observed with TA spectroscopies, it is not clear that the dissociation of excitons effectively out-competes radiative relaxation in these systems. That is, such a cascade of energy transfer transitions is not “useful” for a photovoltaic device if the excitons ultimately relax by spontaneous emission. The present application of NLPC spectroscopy to the layered perovskite photocell is motivated by knowledge of the types of interactions between quantum wells that lead to the production of photocurrent (e.g., exciton dissociation, energy transfer, electron transfer).
The NLPC experiment employed in this work is described by the schematic inFigure 1a. The experiment is conducted with two narrow-band laser beams (5 nm spectral widths) that are tunable in the visible spectral range. The nonlinear response of the photocurrent is isolated by chopping the beams at different frequencies, as described in the Experimental Methods section. Unlike coherent 2D photo-current spectroscopies,1,2,4,5 the waveforms of the coherences are not measured in the present approach. Thus, with respect to the sequence of field−matter interactions, the NLPC technique is more closely related to earlier two-pulse photocurrent spectroscopies.14−16 Four-pulse photon echo and two-pulse TA experiments are optical analogues of these two approaches to NLPC spectroscopies.17−21
Received: October 8, 2019
Accepted: November 12, 2019
Discrepancies between the linear absorbance and external quantum efficiency (EQE) spectra for the layered perovskite suggest that an all-optical technique may overestimate the importance of excitons to the production of photocurrent. In Figure 1b, the EQE spectrum, which is produced with a tungsten−halogen lamp, as described in the Experimental Methods section, exhibits a steep rise near 625 nm and is relatively flat at shorter wavelengths. In contrast, the linear absorbance spectrum possesses well-defined single-exciton resonances associated with the n = 2 and 3 quantum wells near 570 and 600 nm. The relatively small contributions of excitonic resonances to the EQE spectrum indicate that continuum states produce photocurrent with greater efficiency. In fact, it has previously been shown that excitation of continuum states is more likely to result in dissociated charges capable of producing photocurrent.22 The EQE spectrum suggests that the responses of the excitons are likely suppressed by radiative relaxation induced by their large transition dipoles.23
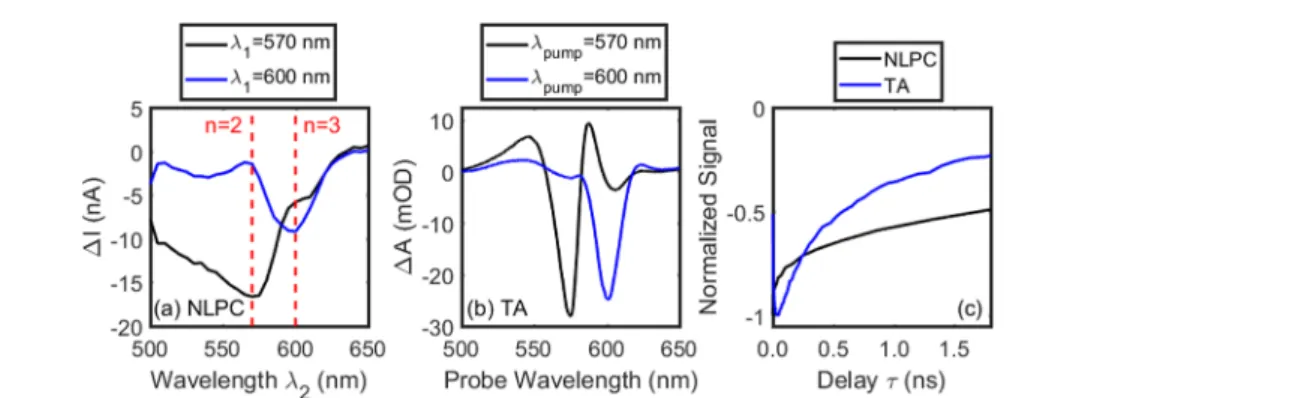
InFigure 2, NLPC and TA signals are compared to establish differences in the information provided by the two experimental methods. NLPC spectra acquired by scanning the wavelength of pulse 2 with pulse 1 tuned to 570 and 600 nm are displayed in Figure 2a. Unlike the linear spectra presented in Figure 1, the NLPC spectra exhibit narrow features at the single-exciton resonance wavelengths of 570 and 600 nm. The spectra show that the sign of the resonance associated with then= 2 quantum well changes when pulse 1 is tuned from 570 (negative sign) to 600 nm (positive sign); that is, minima and maxima are measured atλ2= 570 nm when
λ1 is equal to 570 and 600 nm, respectively. Although the phases of the coherences are not resolved in the present NLPC technique, the signs of the signal components are still apparent because of either constructive or destructive interference with the broad component of the response associated with continuum states. Similarly, the resonance of the n = 3 quantum well atλ2= 600 nm changes sign whenλ1is tuned from 570 to 600 nm. Notably, the signs of then= 3 resonance are opposite to those associated with then= 2 quantum well (i.e., maxima and minima are found withλ1tuned to 570 and 600 nm, respectively). The TA spectra presented inFigure 2b exhibit intense resonances at 570 and 600 nm in addition to excited-state absorption features induced by single-to-biexciton transitions. Unlike the NLPC spectra, the signs of the TA signals at 570 and 600 nm are independent of the wavelength of the pump pulse. Finally, the temporal profiles of TA and NLPC signals displayed inFigure 2c make clear that different processes are detected by the two techniques as the NLPC signal suggests sensitivity to slower relaxation dynamics. In previous work, we concluded that TA experiments are relatively insensitive to charge transfer processes that occur on time scales longer than energy transfer.12,24For this reason, we hypothesize that NLPC is more sensitive to such charge transfer dynamics.
We present 2D NLPC spectra at four delay times inFigure 3a−d. As in Figure 2a, the spectral line shapes suggest a superposition of signal components with broad and narrow line widths. Diagonal peaks corresponding to the n = 2 and 3 quantum wells are located at 570 and 600 nm. In addition, the spectra possess off-diagonal minima when the wavelengths of Figure 1.NLPC spectroscopy is motivated by access to information that is not available in conventional measurements. (a) The nonlinear response of the photocurrent is isolated by chopping two independently color-tunable laser pulses with an experimentally controlled delay time,τ. (b) The EQE (black) of the layered perovskite photovoltaic cell is overlaid with its transmission spectrum (blue). These spectra suggest that continuum states, rather than excitons, are most important for generating photocurrent.
Figure 2.Signals acquired with NLPC and TA techniques compared for a layered perovskite. (a) NLPC spectra at 1 ps delay with pulse 1,λ1, tuned
pulses 1 and 2, λ1 and λ2, correspond to the n = 2 and 3 resonances (i.e., the diagonal of the spectrum is “pinched” between the excitons). Contributions of the excitons to the 2D NLPC spectrum are obscured by the broad component of the NLPC signal inFigure 3a−d. For this reason, the spectra in Figure 3e−h have been processed with an algorithm designed to separate resonance Raman andfluorescence components of spontaneous emission spectra (i.e., a numerical method for separating narrow and broad components of a spectrum).25,26 This approach, which is outlined in the Supporting Information, is appropriate for the present application because (i) the excitons and continuum states possess different line widths and (ii) the broad line shape associated with the continuum states is not readily subtracted byfitting the spectra with phenomenological functions (e.g., sum of Gaussians, polynomials, etc.). At all delay times, the 2D spectra inFigure 3e−h possess diagonal and off-diagonal peaks at the wave-lengths associated with then = 2 and 3 quantum wells (i.e., noise induces weaker features at other wavelengths). We suggest that these four peaks decay on a shorter time scale than the broad signal component because of exciton dissociation; excitons that undergo radiative recombination do not contribute to the photocurrent. Because the off-diagonal peaks are already present at 1 ps delay, it is unlikely that these resonances are induced by either energy or electron transfer processes.12,24 In addition, these signal components have signs that are opposite to those of the diagonal peaks, which suggests that excited-state absorption-like signal components are responsible for these cross peaks.
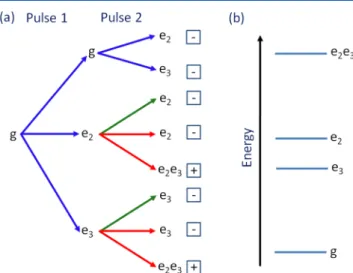
In Figure 4, we present a schematic that summarizes the exciton populations associated with various components of the NLPC signal. The interactions with pulses 1 and 2 are represented with the first and second sets of colored arrows, respectively. Thefirst type of pathway, which involves two blue arrows, is an analogue of the ground-state bleach in TA spectroscopy; this nonlinearity contributes to the diagonal peaks inFigure 3e−h. In the GSB-like signal component, the
system evolves in a ground-state population during the delay between pulses. The second pulse then promotes the system to an excited state capable of producing photocurrent. The second class of pathways (blue and green arrows) resembles excited-state emission-like terms in TA spectroscopy in that the system evolves in an excited-state population in the interval between pulses. The two field−matter interactions with the second pulses do not change the excited state (see Feynman diagrams in the Supporting Information). Again, these pathways result in diagonal peaks under the assumption that the NLPC signals do not carry signatures of energy transfer. We consider this a good assumption as the accumulation of Figure 3.2D NLPC spectra at (a,e) 1 ps, (b,f) 1 ns, (c,g) 2 ns, and (d,h) 3 ns. The directly detected spectra presented in panels (a−d) combine signal components associated with the quantum wells and continuum states. The broad-band components (i.e., the continuum response) of the spectrum have been subtracted in panels (e−h) using the algorithm described in theSupporting Information. The 570 and 600 nm diagonal peaks associated with then= 2 and 3 quantum wells decay on the nanosecond time scale due to exciton dissociation. The continuum states support longer-lived signal components.
signal intensity is not observed above the diagonal of the 2D spectra in Figure 3 with increasing delay times. Finally, the third type of signal component is the analogue of excited-state absorption in TA spectroscopy; however, the NLPC response function differs in that either single excitons or biexcitons may be populated after interacting with the second laser pulse.2 Formally, the sign of the term depends on whether an even (negative) or odd (positive) number of field−matter interactions occurs with the bra and ket in the perturbative expansion of the density operator.2 As these two pathways destructively interfere, the detection of an off-diagonal peak with a positive sign indicates that the biexciton produces a greater amount of photocurrent than does the single exciton, which is similar to thefinding reported for biexcitons in a PbS photovoltaic device.2
The decomposition of the signal outlined in Figure 4 suggests that biexcitons composed of single excitons in then= 2 and 3 quantum wells are responsible for the cross peaks in the 2D NLPC spectra. For example, a transition from single exciton, e2, to biexciton, e2e3, is predicted to produce resonances at λ1 = 570 nm and λ2 = 600 nm. Moreover, biexcitons delocalized between n = 2 and 3 quantum wells, e2e3, were detected in a similar layered perovskite using a four-wave mixing technique in previous work.27This is physically interesting because such delocalization requires significant interactions between neighboring quantum wells. For refer-ence, a pair of coplanar transition dipoles with magnitudes of 10 D have a coupling of approximately 495 cm−1/d3, wheredis the distance between dipoles.12 A coupling of 62 cm−1 is obtained for a distance of 2 nm between the n = 2 and 3 quantum wells.12 Of course, it should also be noted that a distribution of couplings and distances,d, will be found in a heterogeneousfilm.
The dependence of NLPC signals on the action spectrum of a photovoltaic cell has been discussed in previous work.2 In effect, each of the pathways in the NLPC response function, summarized inFigure 4a,b, is weighted by the efficiency with which a particular exciton produces photocurrent. In the Supporting Information, we outline an approach for estimating the relative efficiencies of then= 2 and 3 quantum wells based on the linear absorbance and NLPC responses. Briefly, this approach recognizes that both signals scale linearly in the concentrations of the quantum wells but have different dependences on the transition dipoles. Under the assumption that then= 2 and 3 systems possess the same transition dipole magnitudes, the ratio of their efficiencies, ϕ2 and ϕ3, can be expressed as ϕ ϕ · = S S S S 3 NLPC 3 Abs 2Abs 2NLPC 3 2 (1)
where SnAbs and S
n
NLPC represent the linear absorbance and
NLPC signal strengths, respectively. We obtain a ratio,ϕ3/ϕ2, of 8.9 using the fitting parameters summarized in the Supporting Information. Qualitatively, the greater efficiency associated with then = 3 quantum well is clear based on its disproportionate contribution to the NLPC response as compared to the linear absorbance spectrum (see Figures 1 and 3); however, the information derived from the NLPC signals is required to compute the ratioϕ3/ϕ2. We suggest that the difference in efficiencies originates from the discrepancy between exciton binding energies, which are 260 and 150 meV for then= 2 and 3 quantum wells, respectively.28The present
results indicate that excitons in then= 2 system are more likely to decay radiatively before photocurrent can be produced by way of exciton dissociation.
In summary, we have used a two-pulse NLPC experiment to measure the nonlinear response of a photovoltaic device based on layered 2D perovskite quantum wells. The NLPC technique targets the same nonlinearity probed in coherent 2D photocurrent spectroscopies but does not resolve the electronic coherences. Nonetheless, narrow-band laser pulses can be tuned to construct a 2D spectrum that provides similar information. In the present application, the NLPC technique reveals signatures of biexciton states shared between then= 2 and 3 quantum wells. This observation is interesting because it is not obvious that such delocalization should take hold with modest couplings (50−100 cm−1) at room temperature.27
The signs of the signals suggest that the biexciton, e2e3, produces a greater amount of photocurrent than do the individual e2and e3single excitons. In addition, we have estimated the relative efficiencies for photocurrent generation by comparing the linear absorbance and NLPC signal strengths. This analysis indicates that the n = 3 quantum well is 8.9 times more efficient in generating photocurrent than is then= 2 system, presumably because of the smaller exciton binding energy found in then = 3 quantum well. Overall, these data suggest that the energy funneling processes detected in earlier TA experiments conducted on these systems have little relevance for the function of a photovoltaic device. This conclusion is supported by the dominance of continuum states in the NLPC signals and the lack of energy transfer-induced cross peaks above the diagonal in the 2D spectrum.
■
EXPERIMENTAL METHODSMethylammonium iodide (MAI) was synthesized by the reaction of a stoichiometric ratio of unstabilized HI solution (57 wt % in water, Sigma-Aldrich, purified by 0.36 M tributyl phosphate solution in chloroform) and methylamine solution (40 wt % in water, Sigma-Aldrich) in an ice bath.24The crude MAI was precipitated by adding plenty of ethyl ether followed by recrystallization in ethanol to produce pure MAI. Butylammonium iodide (BAI) was synthesized by the reaction of a stoichiometric ratio of unstabilized HI solution (57 wt % in water, Sigma-Aldrich, purified by 0.36 M tributyl phosphate solution in chloroform) andn-butylamine (Sigma-Aldrich) in an ice bath.13The crude BAI was obtained by evaporating the solvent under reduced pressure. Pure BAI was produced by recrystallization of the crude product in ethanol.
was heated at 70°C and the substrate was heated at 150°C for 15 min. Then, the precursor solution was quickly spun-cast on the substrate at 5000 rpm for 20 s to form the 2D perovskite layer. The precursor solution was heated at 70°C for 15 min and then quickly spun-cast on the substrate at 5000 rpm for 20 s. Thefilm was quickly transferred to a hot plate at 80 °C for 10 s to form the 2D perovskite layer. After the deposition of the 2D perovskite layer, the [6,6]-phenyl C61 butyric acid methyl ester (PCBM) was spin-coated on top at 2000 rpm for 30 s from a PCBM solution in chloroform with a concentration of 13 mg/mL. Then a bathophenanthroline solution in ethanol with a concentration of 0.7 mg mL−1was spin-coated on the PCBM layer at 4000 rpm for 30 s. Then, 100 nm of Cu was finally deposited on thefilm as the top contact through thermal evaporation at a base pressure of 2×10⁻⁶mbar or lower. The active area of the device was 0.13 cm2.
Solar cell performance was carried out under AM 1.5G irradiation with an intensity of 100 mW cm−2 (Oriel 91160, 300 W) calibrated by an NREL-certified standard silicon cell in a nitrogen-filled glovebox. A Keithley 2400 digital source meter was used to record current density versus voltage (J−V) curves. The scan rate was 50 mV s−1, and the dwell time was 0.1 s. EQE was detected under monochromatic illumination (Oriel Cornerstone 260 1/4 m monochromator equipped with an Oriel 70613NS QTH lamp), and calibration of the incident light was performed with a monocrystalline silicon diode (Model No.: Newport 71580). The intensity of the light source used for EQE measurements was 3.55 and 3.80 μW/ cm2at 570 and 640 nm, respectively.
TA experiments were conducted using the instrument described in previous work.12 Briefly, all experiments were conducted with a 45 fs, 4 mJ Coherent Libra laser system. To begin, 1.5 mJ of the 800 nm fundamental was focused into a 4 m long tube filled with argon gas to generate a visible continuum. The pump pulses were produced byfiltering 5 nm wide portions of this continuum. The probe pulse was a visible continuum generated by focusing a 2μJ portion of the 800 nm laser beam into a 3 mm thick sapphire plate. The pump and probe had 200 μm spot sizes at the surface of the film. The pump fluence was 10 μJ/cm2, unless indicated otherwise below. Signal detection was accomplished with a CMOS array detector that was synchronized to the 1 kHz repetition rate of the laser system. The signal was averaged over 20 scans of the delay line, and a total of 20 000 differences was collected at each delay point.
NLPC experiments were conducted using a pair of independently color-tunable laser beams, each with spectral widths of 5 nm. The two beams were produced using replica 4F spectralfilters.12The two laser pulses had 115 pJ energies and 82μm spot sizes. The laserfluence of 2.2μJ/cm2was on the same order of magnitude as those employed in earlier NLPC-like experiments.1,7,16The photocurrent was amplified at 500 nA/V using a Stanford Research 570 current preamplifier. This particular amplification factor maximized the dynamic range of the detection system. The two laser beams were chopped at 500 and 250 Hz, respectively. Thus, signals were acquired under four conditions: pulse 1 only (S1), pulse 2 only (S2), pulses 1 and 2 (S1+2), and both pulses blocked (S0). As in previous work,
2
the NLPC signal was defined asSNLPC = S1+2 − S1 − S2 + S0. Each photocurrent difference was averaged over a total of 800 laser shots (0.8 s).
■
ASSOCIATED CONTENT*
S Supporting InformationThe Supporting Information is available free of charge on the ACS Publications website at DOI: 10.1021/acs.jp-clett.9b02959.
NLPC measurement conducted with displaced laser beams, the model used to obtain eq 1, the algorithm used to separate signal components with broad and narrow line widths, a current−voltage measurement for the device, a SEM cross section of the device, fluence dependence of the NLPC signal strengths, a discussion of reproducible features in NLPC data, and double-sided Feynman diagrams (PDF)
■
AUTHOR INFORMATION Corresponding Author*E-mail:[email protected]. ORCID
Jun Hu:0000-0002-6997-0174
Liang Yan: 0000-0003-4122-7466
Wei You:0000-0003-0354-1948
Andrew M. Moran:0000-0001-7761-7613
Notes
The authors declare no competingfinancial interest.
■
ACKNOWLEDGMENTSThis work is supported by the National Science Foundation under CHE-1763207 (O.W., N.Z., Z.O., and A.M.). J.H., L.Y., and W.Y. acknowledge support from the UNC Research Opportunities Initiative (ROI) through the Center of Hybrid Materials Enabled Electronic Technology. Research of 2D perovskite fabrication was supported by the Center for Hybrid Organic Inorganic Semiconductors for Energy (CHOISE), an Energy Frontier Research Center funded by the U.S. Department of Energy (DOE), Office of Science, Office of Basic Energy Sciences (BES). SEM images were obtained at the Chapel Hill Analytical and Nanofabrication Laboratory, CHANL, a member of the North Carolina Research Triangle Nanotechnology Network, RTNN, which is supported by the National Science Foundation, Grant ECCS-1542015, as part of the National Nanotechnology Coordinated Infrastructure, NNCI.
■
REFERENCES(1) Nardin, G.; Autry, T. M.; Silverman, K. L.; Cundiff, S. T. Multidimensional Coherent Photocurrent Spectroscopy of a Semi-conductor Nanostructure.Opt. Express2013,21, 28617−28627.
(2) Karki, K. J.; Widom, J. R.; Seibt, J.; Moody, I.; Lonergan, M. C.; Pullerits, T.; Marcus, A. H. Coherent Two-Dimensional Photocurrent Spectroscopy in a PbS Quantum Dot Photocell.Nat. Commun.2014,
5, 5869.
(3) Damtie, F. A.; Wacker, A.; Pullerits, T.; Karki, K. J. Two-Dimensional Action Spectroscopy of Excitonic Systems: Explicit Simulation Using a Phase-Modulation Technique.Phys. Rev. A: At., Mol., Opt. Phys.2017,96, 053830.
(4) Bakulin, A. A.; Silva, C.; Vella, E. Ultrafast Spectroscopy with Photocurrent Detection: Watching Excitonic Optoelectronic Systems at Work.J. Phys. Chem. Lett.2016,7, 250−258.
(6) Petti, M. K.; Lomont, J. P.; Maj, M.; Zanni, M. T. Two-Dimensional Spectroscopy Is Being Used to Address Core Scientific Questions in Biology and Materials Science.J. Phys. Chem. B2018,
122, 1771−1780.
(7) Gregoire, P.; Srimath Kandada, A. R.; Vella, E.; Tao, C.; Leonelli, R.; Silva, C. Incoherent Population Mixing Contributions to Phase-Modulation Two-Dimensional Coherent Excitation Spectra.J. Chem. Phys.2017,147, 114201.
(8) Stoumpos, C. C.; Cao, D. H.; Clark, D. J.; Young, J.; Rondinelli, J. M.; Jang, J. I.; Hupp, J. T.; Kanatzidis, M. G. Ruddlesden−Popper Hybrid Lead Iodide Perovskite 2D Homologous Semiconductors.
Chem. Mater.2016,28, 2852−2867.
(9) Cao, D. H.; Stoumpos, C. C.; Farha, O. K.; Hupp, J. T.; Kanatzidis, M. G. 2D Homologous Perovskites as Light-Absorbing Materials for Solar Cell Applications.J. Am. Chem. Soc. 2015, 137, 7843−7850.
(10) Smith, I. C.; Hoke, E. T.; Solis-Ibarra, D.; McGehee, M. D.; Karunadasa, H. I. A Layered Hybrid Perovskite Solar-Cell Absorber with Enhanced Moisture Stability.Angew. Chem., Int. Ed.2014,53, 11232−11235.
(11) Liu, B.; Soe, C. M. M.; Stoumpos, C. C.; Nie, W.; Tsai, H.; Lim, K.; Mohite, A. D.; Kanatzidis, M. G.; Marks, T. J.; Singer, K. D. Optical Properties and Modeling of 2D Perovskite Solar Cells.Sol. RRL2017,1, 1700062.
(12) Williams, O. F.; Guo, Z.; Hu, J.; Yan, L.; You, W.; Moran, A. M. Energy Transfer Mechanisms in Layered 2D Perovskites. J. Chem. Phys.2018,148, 134706.
(13) Yan, L.; Hu, J.; Guo, Z.; Chen, H.; Toney, M. F.; Moran, A. M.; You, W. General Post-Annealing Method Enables High-Efficiency Two-Dimensional Perovskite Solar Cells.ACS Appl. Mater. Interfaces
2018,10, 33187−33197.
(14) Lukin, L. V.; Tolmachev, A. V.; Yakovlev, B. S. The Photoexcitation of Trapped Electrons Produced in the Photo-ionization of Anthracene in Liquid n-Hexane. Chem. Phys. Lett.
1981,81, 595−598.
(15) Müller, J. G.; Lemmer, U.; Feldmann, J.; Scherf, U. Precursor States for Charge Carrier Generation in Conjugated Polymers Probed by Ultrafast Spectroscopy.Phys. Rev. Lett.2002,88, 147401.
(16) Bakulin, A. A.; Rao, A.; Pavelyev, V. G.; van Loosdrecht, P. H. M.; Pshenichnikov, M. S.; Niedzialek, D.; Cornil, J.; Beljonne, D.; Friend, R. H. The Role of Driving Energy and Delocalized States for Charge Separation in Organic Semiconductors. Science 2012, 335, 1340−1344.
(17) Mukamel, S. Multidimensional Femtosecond Correlation Spectroscopies of Electronic and Vibrational Excitations.Annu. Rev. Phys. Chem.2000,51, 691−729.
(18) Jonas, D. M. Two-Dimensional Femtosecond Spectroscopy.
Annu. Rev. Phys. Chem.2003,54, 425−463.
(19) Brixner, T.; Mancal, T.; Stiopkin, I. V.; Fleming, G. R. Phase-Stabilized Two-Dimensional Electronic Spectroscopy.J. Chem. Phys.
2004,121, 4221−4236.
(20) Ogilvie, J. P.; Kubarych, K. J. Multidimensional Electronic and Vibrational Spectroscopy: An Ultrafast Probe of Molecular Relaxation and Reaction Dynamics.Adv. At., Mol., Opt. Phys.2009,57, 249−321. (21) Hamm, P.; Zanni, M. T.Concepts and Methods of 2D Infrared Spectroscopy; Cambridge University Press: Cambridge, 2011.
(22) Trinh, M. T.; Wu, X.; Niesner, D.; Zhu, X.-Y. Many-Body Interactions in Photo-Excited Lead Iodide Perovskite.J. Mater. Chem. A2015,3, 9285−9290.
(23) Hong, X.; Ishihara, T.; Nurmikko, A. V. Dielectric Confinement Effect on Excitons in PbI4-Based Layered Semiconductors.Phys. Rev. B: Condens. Matter Mater. Phys.1992,45, 6961−6964.
(24) Hu, J.; Oswald, I. W. H.; Stuard, S. J.; Nahid, M. M.; Zhou, N.; Williams, O. F.; Guo, Z.; Yan, L.; Hu, H.; Chen, Z.; et al. Synthetic Control over Orientational Degeneracy of Spacer Cations Enhances Solar Cell Efficiency in Two-Dimensional Perovskites.Nat. Commun.
2019,10, 1276.
(25) Grumstrup, E. M.; Chen, Z.; Vary, R. P.; Moran, A. M.; Schanze, K. S.; Papanikolas, J. P. Frequency Modulated Femtosecond
Stimulated Raman Spectroscopy of Ultrafast Energy Transfer in a Donor−Acceptor Copolymer. J. Phys. Chem. B 2013, 117, 8245− 8255.
(26) Guo, Z.; Giokas, P. G.; Cheshire, T. P.; Williams, O. F.; Dirkes, D. J.; You, W.; Moran, A. M. Ultrafast Spectroscopic Signatures of Coherent Electron-Transfer Mechanisms in a Transition Metal Complex.J. Phys. Chem. A2016,120, 5773−5790.
(27) Elkins, M. H.; Pensack, R.; Proppe, A. H.; Voznyy, O.; Quan, L. N.; Kelley, S. O.; Sargent, E. H.; Scholes, G. D. Biexciton Resonances Reveal Exciton Localization in Stacked Perovskite Quantum Wells.J. Phys. Chem. Lett.2017,8, 3895−3901.