EVALUATION OF HYSTERECTOMY AS BOTH EXPOSURE AND OUTCOME: ASSOCIATION WITH EPITHELIAL OVARIAN CANCER AND PREDICTION OF
PREMENOPAUSAL HYSTERECTOMY WITH OVARIAN CONSERVATION
Rachel Palmieri Weber
A dissertation submitted to the faculty at the University of North Carolina at Chapel Hill in partial fulfillment of the requirements for the degree of Doctor of Philosophy in the Department of
Epidemiology in the Gillings School of Global Public Health.
Chapel Hill 2015
Approved by: Andrew F. Olshan Charles Poole
ii © 2015
iii ABSTRACT
Rachel Palmieri Weber: Evaluation of hysterectomy as both exposure and outcome: Association with epithelial ovarian cancer and prediction of premenopausal hysterectomy with ovarian conservation
(Under the direction of Andrew F. Olshan)
Hysterectomy is the most common non-obstetric, surgical procedure among women in the United States. Older studies have generally reported that hysterectomy is inversely associated with risk of epithelial ovarian cancer (EOC). One of the goals of this dissertation was to investigate this relationship, focusing on subtypes of EOC. Since a majority of ovarian-conserving hysterectomies occur prior to menopause, we also sought to develop a predictive model for premenopausal
hysterectomy with ovarian conservation as a way of identifying traits that may help identify women for clinical monitoring and potentially earlier and less invasive treatment than hysterectomy for their conditions.
We estimated study-specific odds ratios by conditional logistic regression for almost 30,000 EOC cases and controls from 15 studies in the Ovarian Cancer Association Consortium and pooled them using random-effects models. Hysterectomy was associated with an average relative increase of 19% in the odds for invasive EOC. The average odds ratios were above the null for all subtypes of EOC, except invasive clear cell. Hysterectomies prior to age 40 or 30 years or more in the past were also positively associated with invasive serous EOC.
iv
Our results, from the largest set of EOC cases and controls to date, do not support the long-held belief that hysterectomy is protective against EOC. Considerable heterogeneity of results, potential biases in previous and/or current studies, and/or a changing association between
hysterectomy and EOC may explain our results and should be explored further. Though we were able to predict premenopausal hysterectomy with ovarian conservation with very good discriminatory power, additional model development should be pursued in larger and more diverse populations of premenopausal women as we try to better understand premenopausal women who undergo
v
vi
ACKNOWLEDGEMENTS
I am very grateful to a number of people that provided me support and encouragement throughout my graduate education. My advisor, Charlie Poole, served as chair of my dissertation committee for a period of time but more importantly, offered me guidance and support as we negotiated unconventional methods and controversial results with a larger than normal group of investigators. Andy Olshan was a great voice of reason as the chair of my committee and a source of encouragement as I made my way to the finish line. I thank Joellen Schildkraut for the numerous opportunities she gave me as a project/data manager for the Ovarian Cancer Association Consortium and for her vast knowledge on the topic of ovarian cancer. Wendy Brewster offered excellent clinical insight and practical advice, always providing reasonable and constructive feedback. Ed Iversen provided me a different perspective on statistical methods but never squashed my interest in alternative methods that he was less familiar with. I thank Trish Moorman for her mentorship, her constructive feedback, and the chats we would have in our neighboring offices regarding my dissertation work. Finally, I wish to gratefully acknowledge the contribution Bob Millikan made to the early stages of my dissertation work and my epidemiology education as a whole; I hope my work going forward will honor his memory as an excellent epidemiologist, community-oriented researcher, and kind man.
vii
colleagues and friends at Duke for their encouragement and programming help: Margie Riggan, Katherine Zeph, Sydnee Crankshaw, Frances Wang, Karen Catoe, and Brian Calingaert.
I was lucky to have the never-wavering support of my extended epidemiology family over the years and could never have accomplished this without Nancy Colvin, Lizzi Torrone, Lisa Vinikoor-Imler, Stephanie Saddlemire, Mary Beth Ritchey, and Nikki Jarrett; they gave me strength to keep moving forward no matter how difficult classes or the dissertation became. I will never forget the teachings of my professors, both in and out of the classroom, including those from Michele Jonsson Funk, Jim Thomas, Kathie Hartmann, Jane Schroeder, and Steve Marshall. Their career paths, teaching styles, and general life philosophies continue to resonate with me as I begin my career.
I would like to acknowledge the sources of financial support that enabled me to complete this research: National Research Service Award Cancer Training Grant (T32CA009330, PI: Andrew F. Olshan, 9/1/2005-8/31/2008) and a grant from the National Institutes of Health (1R01CA136891, PI: Celeste Leigh Pearce) for "A pooled analysis to identify new ovarian cancer risk factors."
viii
TABLE OF CONTENTS
LIST OF TABLES ... xii
LIST OF FIGURES ... xiv
LIST OF ABBREVIATIONS ... xv
CHAPTER 1. INTRODUCTION ... 1
1.1 Motivation for dissertation ... 1
1.2 Dissertation layout ... 2
CHAPTER 2. REVIEW OF THE LITERATURE ... 3
2.1 Hysterectomy ... 3
2.1.1 Epidemiology of hysterectomy ... 3
2.1.2 Indications for hysterectomy ... 4
2.1.3 Role of family history in indications for hysterectomy ... 5
2.2 Epithelial ovarian cancer ... 6
2.2.1 Epidemiology of ovarian cancer ... 6
2.2.2 Heterogeneity of epithelial ovarian cancer ... 7
2.2.3 Ovarian cancer pathogenesis ... 8
2.3 Hysterectomy and ovarian cancer... 9
2.3.1 Association between hysterectomy and epithelial ovarian cancer... 9
2.3.2 Timing of hysterectomy and epithelial ovarian cancer ... 10
2.3.3 Age at hysterectomy and epithelial ovarian cancer ... 11
2.4 Conclusions ... 11
ix
3.1 Association between hysterectomy and epithelial ovarian cancer... 13
3.1.1 Specific aims ... 13
3.1.2 Overview of methods ... 13
3.1.3 Study populations and data sources ... 14
3.1.4 Statistical methods ... 15
3.1.4.1 Exposures ... 15
3.1.4.2 Outcomes ... 16
3.1.4.3 Control of confounding ... 16
3.1.4.4 Study-specific estimates of association ... 17
3.1.4.5 Pooling of data ... 17
3.1.4.6 Heterogeneity of results ... 18
3.2 Prediction of premenopausal hysterectomy ... 19
3.2.1 Specific aims ... 19
3.2.2 Overview of methods ... 19
3.2.3 Study populations and data sources ... 20
3.2.4 Statistical methods ... 22
3.2.4.1 Specific aim 1 ... 22
3.2.4.1.1 Predictors ... 22
3.2.4.1.2 Missing data ... 23
3.2.4.1.3 Model specification and estimation ... 23
3.2.4.1.4 Model performance... 24
3.2.4.1.5 Model validation ... 25
3.2.4.2 Specific aim 2 ... 26
x
4.1 Abstract ... 29
4.2 Introduction ... 30
4.3 Materials and methods ... 30
4.3.1 Data sources... 30
4.3.2 Statistical methods ... 31
4.4 Results ... 34
4.5 Discussion ... 36
CHAPTER 5. RISK PREDICTION FOR PREMENOPAUSAL HYSTERECTOMY WITH THE INTENTION OF OVARIAN CONSERVATION ... 50
5.1 Abstract ... 50
5.2 Introduction ... 51
5.3 Materials and methods ... 52
5.3.1 Study population and data sources ... 52
5.3.2 Predictors ... 54
5.3.3 Model specification, estimation, and performance ... 54
5.3.4 Model validation ... 55
5.3.5 Evaluation of family history’s contribution to the model ... 56
5.4 Results ... 56
5.5 Discussion ... 57
CHAPTER 6. DISCUSSION ... 67
6.1 Recapitulation of aims and results ... 67
6.2 Strengths ... 68
6.3 Limitations ... 69
6.4 Public health significance ... 70
xi
xii
LIST OF TABLES
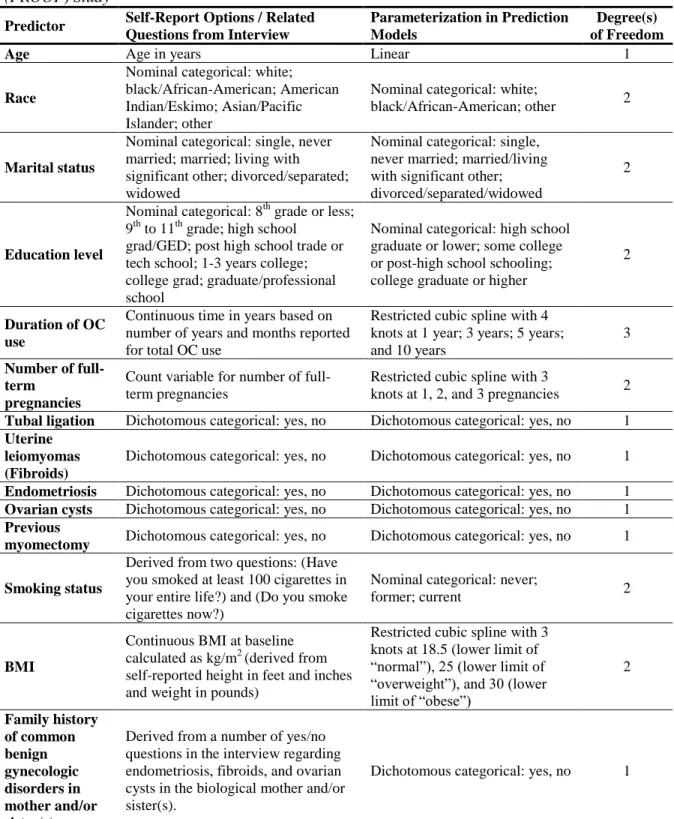
Table 1. Variables included in the prediction models for hysterectomy with the intention of ovarian conservation among pre-menopausal women in the Prospective Research on Ovarian Function (PROOF) Study ... 28 Table 2. Description of 15 case-control studies included in the analyses of hysterectomy and epithelial ovarian tumors from the Ovarian Cancer
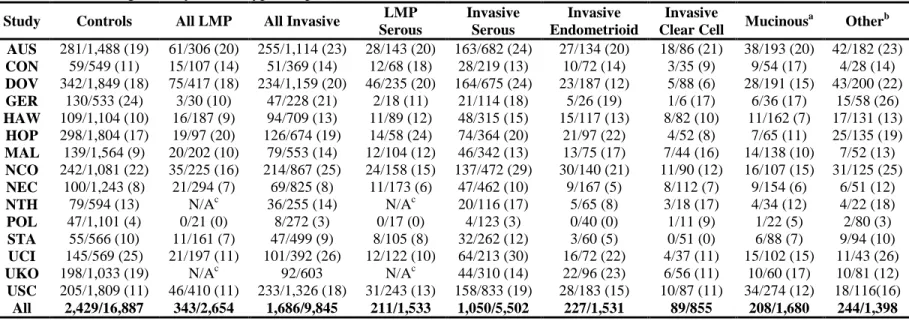
Association Consortium ... 42 Table 3. Counts of cases and controls with hysterectomy more than two years prior to diagnosis (cases) or interview/reference date (controls) according to study and subtype of epithelial ovarian tumors for 15 studies from the Ovarian Cancer
Association Consortium ... 43 Table 4. Association between hysterectomy more than two years prior to diagnosis (cases) or interview/reference date (controls) and subtypes of epithelial ovarian tumors in 15 studies from the Ovarian Cancer Association Consortium ... 44 Table 5. Association between age at hysterectomy and invasive serous epithelial ovarian cancer in 15 studies from the Ovarian Cancer Association Consortium ... 46 Table 6. Association between time since hysterectomy and invasive serous epithelial ovarian cancer in 15 studies from the Ovarian Cancer Association
Consortium ... 47 Table 7. Baseline characteristics of premenopausal women undergoing hysterectomy with ovarian conservation and control women in the Prospective Research on Ovarian Function (PROOF) Study, 2004-2007a ... 60 Table 8. Summary of model performance for the prediction models for hysterectomy with ovarian conservation among premenopausal women, without and with family history of common, benign gynecologic conditions ... 62 Table 9. Reclassification among all baseline Prospective Research on Ovarian Function (PROOF) participants, cases only, and controls only after including family history of common, benign gynecologic conditions in the prediction model for hysterectomy with ovarian conservation among premenopausal women ... 63 Appendix Table 1. Association between hysterectomy more than two years prior to diagnosis (cases) or interview/reference date (controls) and subtypes of invasive serous and mucinous epithelial ovarian tumors ... 73 Appendix Table 2. Characteristics related to study validity and time/place evaluated as potential sources for heterogeneity of results ... 74 Appendix Table 3. Counts of hysterectomies that occurred at or prior to
xiii
xiv
LIST OF FIGURES
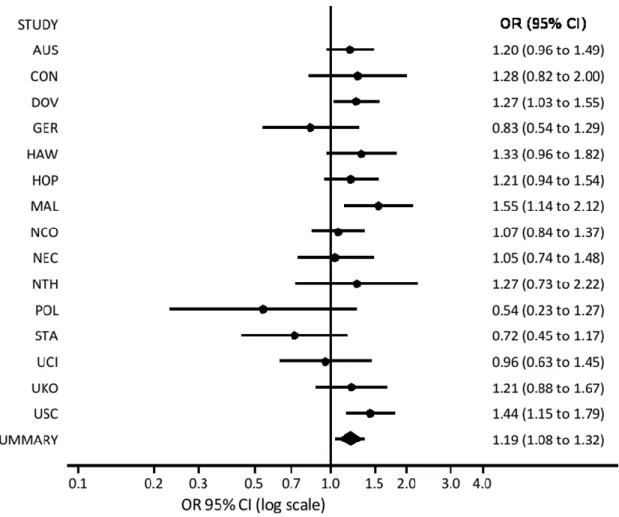
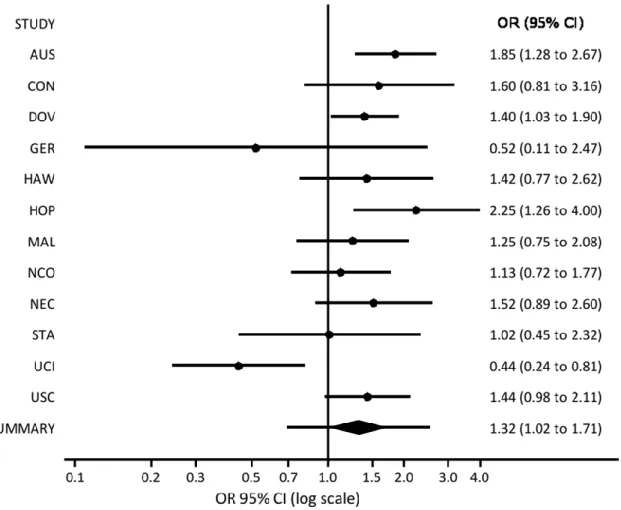
Figure 1. Results from a random-effects analysis of hysterectomy more than two years prior to diagnosis (cases) or interview/reference date (controls) and invasive epithelial ovarian cancer in 15 studies in the Ovarian Cancer Association Consortium ... 48 Figure 2. Results from a random-effects analysis of hysterectomy more than two years prior to diagnosis (cases) or interview/reference date (controls) and low malignant potential epithelial ovarian tumors in 12 studies in the Ovarian CancerAssociation Consortium ... 49 Figure 3. Discrimination of the prediction models for hysterectomy with ovarian
conservation among premenopausal women, without and with family history of common, benign gynecologic conditions. ... 64
Figure 4. Calibration of the prediction models for hysterectomy with ovarian
conservation among premenopausal women, without and with family history of common, benign gynecologic conditions. ... 65
xv
LIST OF ABBREVIATIONS
AUC Area under the curve
BMI Body mass index
BSO Bilateral salpingo-oophorectomy CI Confidence interval
DAG Directed acyclic graph EOC Epithelial ovarian cancer EPV Events per variable
ERT Estrogen replacement therapy FSH Follicle stimulating hormone GOF Goodness-of-fit
HGSC High-grade serous carcinoma HRT Hormonal replacement therapy IU/L International units per liter LGSC Low-grade serous carcinoma LMP Low malignant potential LOH Loss of heterozygosity
MSAS Minimally sufficient adjustment set NRI Net reclassification index
OC Oral contraceptive
OCAC Ovarian Cancer Association Consortium OEP Opposite effects proportion
OR Odds ratio
PI Prediction interval
xvi
RR Risk ratio
RSME Root mean square error
SE Standard error
UK United Kingdom
1
CHAPTER 1. INTRODUCTION
1.1 Motivation for dissertation
The Ovarian Cancer Association Consortium (OCAC) was originally formed in 2005 to combine data from multiple, established studies of ovarian cancer, primarily of case-control design, in an effort to validate ovarian cancer susceptibility polymorphisms. These large-scale, collaborative efforts include centralized high-throughput genotyping and functional biology experiments, data management, and analysis. Because of the wealth of data on known and suspected epidemiological risk factors for ovarian cancer that is available from numerous member studies, the OCAC is also in the position to evaluate known and suspected epidemiological risk factors for histopathological subtypes of ovarian cancer. These subtype-specific analyses were previously difficult to do because of small sample sizes within any one given study and within specific ovarian cancer subtypes.
Though the long-established literature has reported an inverse association between hysterectomy and epithelial ovarian cancer, epidemiologists within the OCAC were not finding a higher prevalence of hysterectomy among controls in their respective studies as they analyzed other exposures of interest. Additionally, there were no evaluations of the association between
hysterectomy and histopathological subtypes of epithelial ovarian due to the rarity of ovarian cancer overall and even smaller frequencies of certain subtypes. To that end, we proposed an evaluation of hysterectomy in 15 case-control studies in the OCAC that would be the largest analysis of individual-level data, to date, of the association between hysterectomy and subtypes of epithelial ovarian cancer.
2
hysterectomy with ovarian conservation among premenopausal women in Prospective Research on Ovarian Function (PROOF): A Study of Hormonal Changes in Premenopausal Women.
1.2 Dissertation layout
3
CHAPTER 2. REVIEW OF THE LITERATURE
2.1 Hysterectomy
2.1.1 Epidemiology of hysterectomy
Hysterectomy is the most common non-obstetric, surgical procedure among women in the
United States (US).1 Approximately 600,000 hysterectomies are performed each year in the US and
more than one-third of women will have a hysterectomy by age 60.2,3 The hysterectomy rate in the US
peaked in 1975, when more than 725,000 were performed, declined through the 1980s, leveled off in
the 1990s, and decreased only slightly each year between 1997 and 2005;2-6 the incidence of
age-adjusted hysterectomy was 6 per 1000 women in 1997 and by 2005, 5 per 1000 women.2
Hysterectomy rates and prevalence appear to be lower across the globe than they are in the US. In Australia, 20% of women have a hysterectomy by age 50. The prevalence of hysterectomy is between 10% and 22% based on Australian surveys7 and 30,000 hysterectomies are performed annually.8 The prevalence of hysterectomy is less in the United Kingdom (UK) than in the US or Australia and has not changed since 1996.9 Rates are even lower in Denmark. The incidence rate of hysterectomy in 1988 in Denmark was 193 per 100,000 women and dropped to 170 per 100,000 women by 1998. Gimbel et al. compared those rates to those of England (292 per 100,000) and the US (425 per 100,000) during the same time period, noting the overall lower incidence in Denmark.10
4
frequently abdominal while those for uterine prolapse were more frequently vaginal;11 this coincides with the reported mean ages at hysterectomy since younger women are more likely to undergo hysterectomy for fibroids or endometriosis and older women are more likely to undergo hysterectomy for prolapse or cancer.5 Concomitant bilateral salpingo-oophorectomy (BSO) was undertaken in roughly half of hysterectomies in the US in the late 1990s, up from 25% in 1965; however, this rate varies by age.1,5 The American College of Obstetricians and Gynecologists recommended in 199912 and 200813 that BSO be avoided in premenopausal women because negative outcomes associated with premature loss of ovarian function outweigh the potential benefits of avoiding future ovarian pathology including ovarian cancer.14 Thus, during the years 2000-2004, only 37% of hysterectomies among women aged 15-44 years included concomitant BSO versus 78% of hysterectomies among women aged 50-54 years.3,15,16
Hysterectomy rates vary by a number of factors, including geographic region, demographics, and reproductive characteristics. Women in the US South undergo hysterectomy at higher rates (5.92 per 1000 women-years) than women in the US Northeast (3.33 per 1000 women-years).1,11 Though not all studies have shown different hysterectomy rates among racial/ethnic groups,17,18 many have reported higher rates and/or higher prevalence of hysterectomy among African American women, who more often than not undergo abdominal hysterectomy.1,17,19-21 Women undergoing hysterectomy are also more likely to have had fewer years of education, lower income, be parous, or have had their first birth at an early age.22-24
2.1.2 Indications for hysterectomy
Most hysterectomies (90%) are performed for benign gynecologic conditions such as
fibroids; menstrual disorders such as excessive bleeding; uterine prolapse; and endometriosis8,11,16,25,26 but the reasons differ by race/ethnicity. In an analysis of hospital discharge data from the 2003
Nationwide Inpatient Sample, representing a 20% stratified sample of US hospitals, the most frequent
5
were predominantly performed to treat fibroids (70%) rather than menstrual disorders (12%), uterine
prolapse (4%), or endometriosis (6%).11
Uterine fibroids are very common in women and typically appear during a woman’s
reproductive years.27,28Although they are often symptomatic, fibroids can cause considerable
morbidity related to pelvic pain, excessive bleeding, and other symptoms. It has been estimated that
fibroids cost the US billions of dollars per year29 and that worldwide, they account for approximately
40% of all hysterectomies.8Fibroids are positively associated with age during the reproductive years,
African American race/ethnicity, earlier menarche, obesity, diabetes, hypertension, and polycystic
ovarian syndrome.27,28,30-33 African American women are also more likely to experience more
numerous and larger fibroids at earlier ages, which may partially explain why they are more likely to
undergo hysterectomy than white women.20,34
The true prevalence of endometriosis, the presence of endometrial tissue outside of the uterus,
is unknown due to a lack of non-invasive diagnostic tests but is thought to be around 10%.35-37It has
been estimated from surgical studies that the prevalence of endometriosis among fertile women
undergoing tubal ligation is 3-6% while it is much higher (30-50%) among women with infertility or
pelvic pain.38 Women with endometriosis typically present with symptoms of dysmenorrhea; chronic
pelvic pain; infertility; bladder and bowel pressure/discomfort; and dyspareunia.39,40A higher
prevalence of endometriosis has been associated with earlier age at menarche; shorter menstrual
cycles; nulliparity; lower body mass index (BMI) levels; alcohol and caffeine use; prior pelvic
surgery; infertility; and family history of endometriosis38,39,41,42 however, the etiology remains unclear.
2.1.3 Role of family history in indications for hysterectomy
Women with fibroids who have a family history of fibroids may be more likely than women
without a family history to present with more severe symptoms, and thus be more likely to undergo
hysterectomy43,44and at an earlier age.45 In fact, twin studies indicate that as many as 50-70% of
6
hydratase gene mutations, which are seen in rare familial syndromes.46 It may be that an apparent
increase in risk for fibroids among women with a family history could be attributed to women with a
family history being more likely to inquire about symptoms when consulting with their doctor. Similarly, one recent study reported no association between family history of fibroids and a fibroids
diagnosis when cases were limited to women who reported their family history prior to their own
diagnosis.47
Though researchers have suggested that “controlling for family history of uterine leiomyomas
as a proxy for elevated genetic risk could reduce the racial difference in uterine leiomyoma disease
outcomes,”43 it is clear that the role of family history in fibroids diagnosis requires additional research. Broadly defined, family history is a proxy for both inherited factors and shared family
environment; it is not simply a proxy for genetic risk.
A study of twins in Australia reported that the incidence of endometriosis among
monozygotic twins was twice the incidence among dizygotic twins;48 early studies of family history
of endometriosis among mothers and sisters have reported up to a 6-fold increase in prevalence.49 A
more recent study reported an increase in risk of endometriosis with family history among
first-degree relatives, though of a lower magnitude than in previous studies (odds ratio (OR) =2.03; 95%
confidence interval (CI): 0.54, 8.25).40 Interestingly, the investigators did not find differences in the characteristics of the cases, with or without family history, or their symptoms; earlier reports have
suggested that the severity of endometriosis is higher among women with a family history.49 As with
fibroids, the role of family history of endometriosis with respect to risk, severity of symptoms, and
outcome requires additional study.
2.2 Epithelial ovarian cancer
2.2.1 Epidemiology of ovarian cancer
7
cancer and 14,180 deaths due to ovarian cancer.50 Worldwide, the incidence of and death due to ovarian cancer is approximately equal between developed and developing countries.51 Ovarian cancer is a highly fatal disease, in part because reliable screening methods do not exist and most patients present with advanced disease. In the US, the five-year survival rate for all stages of disease is 45%; patients with localized disease have a five-year survival rate of 92% but only 19% of ovarian cancers are diagnosed at this stage. Patients with regional and distant ovarian cancer have five-year survival rates of 72% and 27%, respectively.50
2.2.2 Heterogeneity of epithelial ovarian cancer
Ovarian cancer is an etiologic heterogeneous collection of tumors. Sex cord-stromal and germ cell tumors are rare, accounting for 5-10% and <5%, respectively, of all ovarian tumors. Sex cord-stromal tumors arise in the connective tissue holding the ovary together and germ cell tumors originate in the cells that are destined to form eggs within the ovaries.52 Epithelial ovarian cancer (EOC), occurring within the cells of the ovarian surface, accounts for over 90% of all ovarian cancers and is the focus of our research.
Low malignant potential (LMP), or borderline tumors, and invasive tumors are the two main types of EOC even though LMP tumors are not considered to be cancerous. There are several histologic subtypes of both LMP tumors and invasive EOC: serous, mucinous, endometrioid, clear cell, mixed cell, and undifferentiated. Most LMP tumors are serous (50-60%) or mucinous (30%).53,54 Serous is the most common histologic subtype of invasive EOC, accounting for approximately 50% of EOC cases. Endometrioid (~20%), mucinous (~10-12%) and clear cell (~8-10%) are much less common.55 The mucinous subtype is thought to be over diagnosed due to misclassification of metastatic tumors from other sites;56 some studies have reported frequencies as low as 3% for mucinous invasive EOC in their populations.55
8
with younger age compared to non-mucinous tumors58,59 and may be associated with environmental exposures such as smoking more so than reproductive exposures such as number of children or oral contraceptive (OC) use.52,59-61 Likewise, the endometrioid and clear cell subtypes are thought to be very different from both serous and mucinous EOC, but are often lumped together, especially since both are associated with endometriosis.53,56,62
Most LMP tumors do not appear to progress to invasive EOC.53,57,63 LMP serous and invasive serous EOC have some molecular differences: p53 mutations in invasive serous, loss of
heterozygosity (LOH) on the long arm of the inactivated x chromosome in LMP serous and
microsatellite instability in LMP serous.57 If LMP serous tumors progressed to invasive serous EOC, we would expect to see the same kind of molecular profiles in both types of serous EOC.53 Mucinous EOC appears to be the only histologic subtype to follow a progression model whereby LMP tumors progress to invasive tumors.54,56,57 The LOH profiles of both LMP and invasive mucinous EOC are very similar.57
2.2.3 Ovarian cancer pathogenesis
Despite the high mortality from ovarian cancer and the burden of disease, the etiology is not clearly understood. Though the mechanisms underlying them are not fully described, reproductive factors such as parity, OC use, breast-feeding, endometriosis, and tubal ligation have been established as factors associated with EOC risk.64 Cases of ovarian cancer are primarily sporadic; however, 5-10% are familial, primarily due to germline mutations in the BRCA1 and BRCA2 tumor suppressor genes.65
In 1971, Fathalla postulated that “incessant ovulation” might play a role in the development of ovarian neoplasms due to recurrent repair and exposure of the epithelium of the ruptured follicles to estrogen-rich follicular fluid.66 The gonadotropin hypothesis suggests that high levels of pituitary gonadotropins, within normal cycles, increase cancer risk by stimulating the ovarian surface
9
transportation of contaminants or endogenous carcinogens,68,69 a pregnancy-dependent clearance of malignant cells from the ovaries,70 and hormonal imbalances resulting in excess androgen and deficiency in progesterone.71
2.3 Hysterectomy and ovarian cancer
2.3.1 Association between hysterectomy and epithelial ovarian cancer
In general, the literature suggests that hysterectomy is protective against EOC. In a large, pooled case-control study of invasive EOC72 hysterectomy was significantly protective for the hospital-based case-control studies (OR=0.66, 95% CI: 0.50, 0.86); the result was slightly attenuated for the population-based case-control studies (OR=0.88, 95% CI: 0.72, 1.1). Harris et al.73 also reported a decreased risk of LMP EOC (OR=0.87, 95% CI: 0.58, 1.3). Similar estimates have been reported in other case-control studies58,61,74-81 and in cohort studies.82-85
Several studies have looked at the effect of hysterectomy alone and hysterectomy with unilateral oophorectomy on EOC risk. One study reported that a non-significant decreased risk of EOC was limited to women who had hysterectomy without unilateral oophorectomy.86 Four studies report no substantial differences in the association with EOC between the hysterectomy alone and hysterectomy with unilateral oophorectomy groups; 75,85,87,88 however, these studies included very small numbers of participants exposed to hysterectomy.
Two studies reported an increased risk of LMP mucinous tumors. Jordan et al.60 reported that women with hysterectomy were twice as likely to have an LMP mucinous tumor than women without hysterectomy (OR=2.0, 95% CI: 1.3, 3.2); they found no association between hysterectomy and invasive mucinous tumors. Another case-control study also found an increased risk of LMP mucinous tumors among women with hysterectomy (OR=1.18, 95% CI: 0.53, 2.60).61 Other studies found no differences in association among the different histologic subgroups.58,61,80
10
CI: 0.68, 1.23, p for interaction=0.24).89 It is important to note that these findings were for EOC overall, rather than for the endometrioid or clear cell subtypes alone. The endometrioid and clear cell subtypes of invasive EOC are both associated with endometriosis56 so there is the possibility that the effect of hysterectomy on EOC risk among women with endometriosis might be different according to the different histologic subtypes. Hysterectomy was protective against EOC for both nulliparous women (OR=0.29, 95% CI: 0.10, 0.81) and parous women (OR=0.56, 95% CI: 0.39, 0.80, p for interaction=0.46) in another study.81
2.3.2 Timing of hysterectomy and epithelial ovarian cancer
A “healthy screenee” effect may explain the reported inverse association between hysterectomy and EOC. Some women who are undergoing surgery for hysterectomy have their ovaries visualized and checked for abnormalities during surgery, giving the doctor a chance to detect ovarian cancer or possible pre-cursors.90 If this were the case, only hysterectomies performed close in time to the diagnosis of EOC would show a protective effect. One study showed support for this “healthy screenee” hypothesis. Weiss and Harlow90
report protective odds ratios for hysterectomies less than five years prior to diagnosis or interview. However, hysterectomy appeared to be deleterious at six to ten years (OR=1.4, 95% CI: 0.83, 2.4) and at greater than ten years (OR=1.6, 95% CI: 1.1, 2.2).
The inconsistencies in the literature on this topic are likely due to insufficient power to detect associations due to very small sample size; however, most studies do not support the hypothesis.
72,76-78,81,83,86,88
11
since hysterectomy; RR=0.86, 95% CI: 0.63, 1.20 for 10-19 years; and RR=0.79, 95% CI: 0.53, 1.20 for 20+ years).72 Finally, in a large case-control study, women who reported hysterectomy more than 15 years prior to diagnosis/interview were at the lowest risk of invasive EOC (OR=0.6, 95% CI: 0.4, 0.9).76
2.3.3 Age at hysterectomy and epithelial ovarian cancer
Whittemore et al.91 asserted that hysterectomy might impair ovarian function by comprising blood flow to the ovaries, thereby resulting in anovulation. If this were the case, hysterectomy during a woman’s reproductive years would confer more protection than hysterectomy after menopause. Though the age at hysterectomy cut-point varied among the analyses (e.g., 40, 45, 55), most published reports suggest no difference between hysterectomy performed during the reproductive years and the post-menopausal years.76,78,81,82,86,88 There were, however, two reports that lend support to the hypothesis that hysterectomy in the reproductive years offers more protection against ovarian cancer. In a historical cohort study in Canada, there were significantly fewer ovarian cancers observed among women who had had a hysterectomy between the ages of 25 and 44
(Observed/Expected=0.55, p<0.001).83 Additionally, Whittemore and colleagues reported that women who had hysterectomy before age 40 were 42% less likely to have EOC (OR=0.58, 95% CI: 0.40, 0.86) than women who had not had a hysterectomy. Women who had hysterectomy after the age of 40 were only 27% less likely to have EOC than women who had not had a hysterectomy (OR=0.73, 95% CI: 0.51, 1.00). These pooled results were from six hospital-based case-control studies; the pooled results from six population-based case-control studies were attenuated and were more similar across age at hysterectomy strata.72
2.4 Conclusions
Currently, there are no known multivariate prediction models for premenopausal
12
gynecologic condition(s), we need to have a better understanding of other factors that may be related to their decision. Additional traits, including family history of common, benign gynecologic
conditions, may help identify women for clinical monitoring, and potentially less invasive treatment. Additionally, information about women who have hysterectomies may inform imputation models for missing hysterectomy status and future studies with respect to enrolling appropriate participants for studies of hysterectomies.
Related to the need for a better understanding of premenopausal hysterectomy is a need for more careful analyses of the association between hysterectomy and ovarian cancer. Both the exposure (hysterectomy) and outcome (EOC) have not been identified in a standardized way throughout the literature. While some studies specify EOC, and go further to distinguish between invasive and LMP tumors, other studies simply defined their outcome as ovarian cancer. Non-epithelial ovarian cancers are associated with different risk factors and should be analyzed separately. Additionally, while some studies analyze invasive and LMP tumors separately (or combine them after checking that the exclusion of LMP tumors didn’t appreciably change the results), other studies simply combine the two types of tumors. Since there is some evidence that hysterectomy may have a different association with LMP EOC 60,61, than with invasive EOC, it is important to describe any differences between them.
13
CHAPTER 3. METHODS
3.1 Association between hysterectomy and epithelial ovarian cancer
3.1.1 Specific aims
The specific aims of the study for the association between hysterectomy and epithelial ovarian cancer are as follows:
1) Specific aim 1: Determine the association between hysterectomy and epithelial ovarian cancer.
2) Specific aim 2: Determine the association between timing of hysterectomy (with regard to the time at diagnosis among cases and time at interview/reference point among controls) and epithelial ovarian cancer.
3) Specific aim 3: Determine the association between age at hysterectomy and epithelial ovarian cancer.
3.1.2 Overview of methods
We will conduct a pooled analysis of epithelial (EOC) cases and controls from 15 studies in the Ovarian Cancer Association Consortium (OCAC) to evaluate the association between
14 3.1.3 Study populations and data sources
The OCAC was formed to create an opportunity for researchers to evaluate genetic
associations with ovarian cancer with increased power due to larger sample size. While a major aim of the OCAC is to follow up on promising genetic associations while addressing the issues of multiple comparisons and false discoveries that are inherent to studies using high-throughput genotyping technologies,92-99 investigators are keen to take advantage of the rich epidemiologic data that is available. To date, there have been over 60 peer-reviewed manuscripts published that highlight the work of the OCAC to identify and validate genetic associations with EOC100-104 and to evaluate known and suspected risk factors for subtypes of EOC.62,105-108
Fifteen OCAC case-control studies agreed to participate in our proposed analyses of hysterectomy and EOC. One study is from Australia (AUS); one is from the UK (UKO); four are from Europe (GER, MAL, NTH, POL); and nine are from the United States (CON, DOV, HAW, HOP, NCO, NEC, STA, UCI, USC).
EOC cases were identified predominantly through cancer registries and hospital tumor or pathology boards; these cases are considered to be population-based. All but two of the studies (NTH, UKO) contributed both low malignant potential (LMP) and invasive EOC tumors to the OCAC database. Two of the studies (DOV and USC) received pathology information from their respective Surveillance, Epidemiology, and End Results cancer registries. A majority of the study sites centrally reviewed pathology information from patients' pathology reports and a subset of studies confirmed pathology, tumor behavior, and histology by examination of histopathological slides (CON, HAW, MAL, NCO, STA, and UCI). All but three studies (NTH, UCI, UKO) enrolled incident cases of ovarian cancer and collected epidemiologic data within one year of the ovarian cancer diagnosis, on average.
15
an age-stratified random sample of the population of Nijmegen. Controls from the UKO study were postmenopausal women participating in the United Kingdom Collaborative Trial of Ovarian Cancer Screening. All controls had to be at risk for ovarian cancer at the time of enrollment and therefore, had to have at least one intact ovary. Women reporting bilateral salpingo-oophorectomy (BSO) were not eligible for any of the studies. If a woman was unsure of her ovarian status (i.e., whether she had previously had a BSO), she was excluded from the following studies: CON, DOV, HAW, NEC, STA, and USC.
Participants from each of the studies completed questionnaires that ascertained demographic information on the known and suspected risk factors for ovarian cancer including: family history of breast and/or ovarian cancer; menstrual and reproductive histories; use of exogenous hormones such as oral contraceptive (OC) and hormone replacement therapy (HRT); medical and surgical histories; height and weight at various times in life; smoking history; and diet and medication use patterns. Not all studies collected information on the covariates of interest in this study: body mass index (BMI) in early adulthood and/or endometriosis were not collected by the NTH, POL, and STA studies.
3.1.4 Statistical methods
3.1.4.1 Exposures
The primary exposure of interest will be defined as hysterectomy that occurred more than 2 years prior to diagnosis (cases) or interview/reference data (controls). Women reporting hysterectomy within two years of diagnosis will be considered "unexposed" to avoid including cases whose
16
and will be considered unexposed. To evaluate the association between age at hysterectomy and EOC, and because a majority of hysterectomies will have occurred prior to menopause or before age 50 (a common proxy for age at menopause), we will dichotomize the hysterectomy groups (<40 and ≥40 years of age). To evaluate the association between time since hysterectomy and EOC, we will group the hysterectomies into three groups: 2- <15 years, 15- <30 years, and ≥30 years).
3.1.4.2 Outcomes
To facilitate comparisons with the published literature, we will analyze all invasive EOC cases combined and all LMP tumors combined. However, because invasive EOC is a heterogeneous disease, we will define the case groups by tumor behavior and histology as follows: LMP serous, invasive serous EOC, invasive endometrioid EOC, and invasive clear cell EOC. For mucinous tumors, we will evaluate LMP mucinous tumors and invasive mucinous EOC cases combined and separately. Because research has suggested that low-grade invasive serous EOC more closely resembles LMP serous tumors, and because low- and high-grade invasive serous EOC may arise via different pathways, we will also evaluate them separately.109,110
3.1.4.3 Control of confounding
All study-specific estimates will be adjusted for age (<40; 40- <45; 45- <50; 50- <55; 55- <60; 60- <65; 65- <70; 70- <75; and ≥75) and race/ethnicity (non-Hispanic white, Hispanic white, black, Asian, and other). All study-specific estimates for the associations between the different hysterectomy exposures and the different LMP and invasive EOC outcomes will also be adjusted for a set of covariates, identified a priori, by careful consideration of causal diagrams. We constructed DAGs111,112 to identify a MSAS for each of the different hysterectomy-outcome pairings using the DAG program v0.20 (http://epi.dife.de/dag/).113 Because the outcome groups share many risk factors, the MSAS are similar. For the overall LMP, LMP serous, overall invasive and invasive serous
models, the MSAS includes: BMI in early adulthood (<18.5; 18.5- <25; 25- <30; and ≥30); number of full-term births (0; 1; 2; 3; and ≥4); duration of OC use (0; <24, 24- <60; 60- <120; and ≥120
17
invasive endometrioid and clear cell ovarian cancer models additionally includes self-reported endometriosis. The MSAS for the mucinous ovarian cancer models includes only age and race. Variables that were included in the DAGs but not identified as part of the MSAS were: age at menarche; breastfeeding; estrogen replacement therapy; combination hormone replacement therapy; unilateral oophorectomy; smoking; uterine leiomyomata; lifetime number of ovulatory cycles;
premature ovarian failure; age at menopause; pelvic pain; abnormal uterine bleeding; and menopausal symptoms.
3.1.4.4 Study-specific estimates of association
We will estimate study-specific odds ratios (OR) and 95% confidence intervals (CI) for the associations between the different hysterectomy exposures and the different EOC outcomes using conditional logistic regression; the design variables of age and race/ethnicity will define the conditioning sets. We will produce both unadjusted estimates and estimates adjusted for the MSAS identified by the DAGs.
3.1.4.5 Pooling of data
We will obtain estimates of the mean and variance of random-effects distributions using the restricted maximum likelihood method of DerSimonian and Laird114,115 in meta-regression models without regressors (i.e., intercept-only) to get estimates of the mean and variance of random effects distributions. A random-effects model produces estimated values of the mean (𝜇) and variance (𝜏2) of a presumptively normal distribution of “true” values: in this case, a distribution of log odds ratios across different populations. The antilog of the distribution’s estimated mean, 𝜇̂, may be considered a point estimate of the average OR, which is reported along with a 95% CI to reflect the role of
sampling error. We will describe the estimated variance (spread) of the random-effects distribution by computing the opposite effects proportion (OEP) and 95% PI. The OEP is our name for the area under the curve on the opposite side of the null value from the estimated mean116. For instance, if
𝜇̂ > 0, the estimate of the average odds ratio is greater than 1, and the OEP estimates the proportion
18
scale) as 𝜇̂ ± 𝑡𝑘−2 √𝜏̂2+ 𝑆𝐸̂ (𝜇̂)2 , where 𝑘 is the number of studies in the meta-analysis, 𝑡𝑘−2 is the
2.5th percentile of the 𝑡 distribution with 𝑘 − 2 degrees of freedom, and 𝑆𝐸̂ (𝜇̂)2 is the estimated standard error of the sampling distribution for 𝜇̂117-119. Technically, in hypothetically endless repetitions of the entire ensemble of 𝑘 studies, 95% of the 95% PIs cover the “true” OR to be estimated in the “next” study (i.e., study number 𝑘 + 1). As a practical matter, the 95% PI is attractive because its width is determined not only by the estimated spread of the random-effects distribution, 𝜏̂2, but by the estimated degree of random error, in the form of 𝑆𝐸(𝜇̂)2. When 𝜏̂2 > 0, the 95% PI for the next odds ratio is wider than the 95% CI for the average OR. When 𝜏̂2 = 0, the random-effects model reduces to a fixed-effect model and the two intervals become identical. 3.1.4.6 Heterogeneity of results
We will evaluate a list of study characteristics related to study validity and general characteristics of time and place, one at a time in a series of meta-regressions, to identify potential sources of heterogeneity of results. Regarding study validity, we will consider: case type (population-based/hospital- or clinic-based); prevalence of cases defined by mean time between diagnosis and interview (≤1 year/>1 year); control sampling (concurrent with cases/after cases were enrolled); and enrollment of controls unsure of oophorectomy status (explicitly not enrolled because of
indeterminate eligibility/included). We will evaluate the following characteristics related to time and place: location (United States (US)/non-US); median year of diagnosis (≤2000/2000- );
age-standardized prevalence of hysterectomy among controls (<15%/≥15%) as a surrogate for how common hysterectomy is in the source populations; and median year hysterectomies were performed among controls (<1980/1980- ). To address multiple testing in our evaluation of these study
19 3.2 Prediction of premenopausal hysterectomy
3.2.1 Specific aims
The specific aims of the prediction of premenopausal hysterectomy study are as follows:
1) Specific aim 1: Develop and internally validate a predictive model for hysterectomy with the intention of ovarian conservation among premenopausal women.
2) Specific aim 2: Evaluate the contribution (i.e., incremental value) of family history of common, benign gynecologic conditions among mothers and sisters to the predictive model for hysterectomy with intention of ovarian conservation among premenopausal women. 3.2.2 Overview of methods
We will use unconditional logistic regression to predict hysterectomy with the intention of
ovarian conservation among pre-menopausal women enrolled in Prospective Research on Ovarian
Function (PROOF): A Study of Hormonal Changes in Premenopausal Women. By review of the scientific literature, we have selected, a priori, the following variables to be included in the model: age; self-identified race; marital status; education level; duration of OC, number of full-term
pregnancies; tubal ligation; uterine leiomyoma (fibroids); endometriosis; ovarian cysts; previous myomectomy; smoking status; and BMI. The model’s discriminatory power (i.e., ability to classify
correctly) will be evaluated using the concordance statistic (i.e., c statistic), which is equivalent to the receiver operating characteristic (ROC) area under the curve (AUC) in a logistic regression model.
Model calibration (i.e., correspondence between the model-predicted probabilities and the observed
probabilities) will be evaluated with a goodness-of-fit test and visual inspection of the observed
versus predicted probabilities plots. Internal validation of the model will be performed by correcting
the AUC for optimism/overfit by using bootstrap methods.
We will evaluate the incremental value of adding information regarding family history of
common, benign gynecologic conditions in the mother and/or sister(s) to the prediction model by
20 3.2.3 Study populations and data sources
PROOF: A Study of Hormonal Changes in Premenopausal Women was a cohort study of premenopausal women conducted in Durham, North Carolina from April 1, 2004 through December
2007.34,121-123 Women between the ages of 30 and 47 years undergoing hysterectomy at Duke
University Medical Center or Durham Regional Hospital, both part of the Duke University Health
System and located in Durham, North Carolina, were enrolled. Women with intact uteri attending
general gynecology practices in Durham, North Carolina were frequency matched to the women
undergoing hysterectomy on age and race. The aims of the original study were to prospectively
determine whether women undergoing hysterectomy were more likely to experience ovarian failure
during the four years after hysterectomy than the women with intact uteri and to identify medical,
reproductive, and lifestyle characteristics that may be associated with earlier ovarian failure.121 This analysis will only include baseline data for the women who underwent hysterectomy, hereafter
identified as cases, and the women with intact uteri, hereafter identified as controls.
Cases were women, aged 30 to 47 years, who were scheduled to undergo hysterectomy for
benign gynecologic conditions. Prior to their scheduled hysterectomy, potentially eligible women
received a letter from their physician describing the study and alerting them that study personnel
would be contacting them to request their participation. In addition to being aged 30 to 47 years and
not pregnant, women had to be premenopausal as evidenced by at least one menstrual period in the
previous 3 months, had to have at least one intact ovary prior to and following the hysterectomy, had
to have no personal history of cancer (except nonmelanoma skin cancer), and had to be able to
complete the interview in English. Premenopausal status was confirmed by a pre-operative blood
level of follicle-stimulating hormone (FSH) less than 40 international units per liter (IU/L).
Seventy-seven percent of the women identified as scheduled to undergo a hysterectomy remained eligible for
21
undergo hysterectomy, 6 were excluded due to pre-operative FSH levels ≥ 40 IU/L, and 41 were
excluded because they underwent a bilateral oophorectomy at the time of their hysterectomy. An
additional 7 women from the control group were also included as cases because they ended up undergoing hysterectomy within one year after enrollment. Though 47 cases did not complete follow
up in the prospective aspect of the original study, they are included in the proposed analysis of
baseline data; the final number of cases in this baseline analysis will be 457.
Controls were recruited using brochures and advertisements that were placed in gynecology
and family medicine clinics/practices in the Duke University Health System in Durham, North
Carolina. Controls were subject to the same eligibility criteria as the cases. Of the 523 potential
controls who completed the baseline interview, 15 were excluded due to pre-operative FSH levels ≥
40 IU/L and 2 were excluded due to no blood sample (i.e., inability to confirm premenopausal status
by FSH level). Though 32 controls did not complete follow up in the prospective aspect of the
original study, they are included in the proposed analysis of baseline data; the final number of
controls in this baseline analysis will be 506. The controls who remained eligible for the study after
the exclusions described above had a higher educational level and were less likely to smoke than the
controls who were excluded but were similar otherwise.
Participants enrolled in the study completed a baseline interview visit during which they
signed a consent form, completed an extensive questionnaire that was administered by a study
interviewer, provided a blood specimen, and had anthropometric measurements taken. For the cases,
the baseline interview occurred prior to their hysterectomies, most at the time of their pre-operative
visits. The questionnaire ascertained information on the following: demographics; menstrual cycle
history; reproductive history; medical and gynecologic condition history; family history; and lifestyle
22 3.2.4 Statistical methods
3.2.4.1 Specific aim 1
3.2.4.1.1 Predictors
Steyerberg et al.124 caution against basing the structure of prediction models solely on the data under study, especially when the dataset is small, and suggest that previously published or clinically practical parameterizations of variables are preferred over classifications that best fit the data. Based on a review of the scientific literature, we selected the following predictors, a priori, for inclusion in the prediction model for hysterectomy with intent of ovarian conservation among premenopausal women: age; self-identified race; marital status; education level; duration of OC use, number of full-term pregnancies; tubal ligation; fibroids; endometriosis; ovarian cysts, previous
myomectomy; smoking status; and BMI.
To avoid overfitting the model, the parameterizations of the predictors have also been
prespecified and are described in detail in Table 1. Briefly, dichotomous categorical variables (i.e.,
tubal ligation; fibroids; endometriosis; ovarian cysts; and previous myomectomy) will remain as such
in the model. Nominal categorical variables (i.e., race; marital status; education level; and smoking
status) will remain as such in the model with similar categories being grouped together to decrease
the degrees of freedom being used in the model. Age will remain a linear predictor in the model. It
has been reported that dichotomization of predictors results in a loss of discriminative ability124,125 and as such, the remaining continuous variables (i.e., duration of OC use, number of full-term
pregnancies, and BMI) will be included as more flexible restricted cubic splines with 3 or 4 knots.126
Tests for interaction generally require larger sample sizes to provide adequate statistical power.
Additionally, there are no known important interactions to consider a priori, based on review of the
literature. As such, we will only include main effects in the proposed prediction model.
Overall, we propose the inclusion of 13 predictors in the prediction model, with 21 degrees of
23
occurred when the EPV was greater than or equal to 10.127 Subsequent investigators have questioned
that guideline, especially in the presence of high regression coefficients and strong correlations
between predictors,128 while others argue that there are circumstances in which model performance is
acceptable even with less than 10 EPV.129
3.2.4.1.2 Missing data
In complete case analyses, any participant missing data on at least one predictor included in a regression model would be dropped from analyses, resulting in an inefficient analysis and potentially biased estimates, depending on the type of missing data. Using an indicator for missing data is also not recommended.130,131 First, we will assess the frequency of missing data for each of the variables included in the prediction models by case/control status. If the extent of missingness in the variables is low overall (i.e., <5%), and does not appear to be differential with respect to outcome, we will proceed with a complete case analysis. Because we anticipate a moderate percentage of participants to be missing data on family history of common, benign gynecologic conditions, we will review the distributions of the variables in the prediction model by data status (i.e., non-missing, missing) for family history. Additionally, we will perform a sensitivity analysis to evaluate the scope of impact the participants missing data might confer on the model's performance by fitting the logistic regression for the full model an additional two times: firstly, we will recode the missing family history observations as "no" family history and secondly, we will recode the observations as "yes" family history.
3.2.4.1.3 Model specification and estimation
I will use unconditional logistic regression to predict hysterectomy with the intention of
ovarian conservation coded as yes (cases) or no (controls), among pre-menopausal women enrolled in
the PROOF Study; coefficients will be estimated with maximum likelihood methods. The model will
include all predictors as described above and in Table 1, with the exception of the dichotomous
24
Though the practice is common, several studies have concluded that stepwise selection methods for inclusion (or exclusion) of predictors in a model are deficient, often resulting in
overestimation of regression coefficients and loss of predictive power.124,132,133 In a simulation study, Steyerberg et al.124 evaluated a model that contained 8 true and 9 noise predictors that were randomly associated with the outcome. Compared to a model containing only the true predictors (AUC=0.802), the model with noise predictors was only marginally less discriminative (AUC=0.785). When stepwise selection methods were applied to the full model of 17 predictors (α=0.05), all 9 noise predictors were eliminated from the model, but so were 5 of the 8 true predictors, resulting in an AUC of 0.749. Because of these reports, and the relatively small size of the PROOF dataset, we will not apply any selection methods to the prediction model in order to identify a final set of statistically significant predictors.
3.2.4.1.4 Model performance
The prediction model’s performance will be evaluated by both discrimination and calibration.134,135 Discrimination, the ability of the model to correctly classify women with and without hysterectomy, is most commonly assessed using the concordance statistic (c statistic), a rank-order statistic for predictions against actual outcomes. For a binary outcome, the c statistic is
equivalent to the AUC; the true positive rate (i.e., sensitivity) is plotted on the y-axis against the false positive rate (i.e., 1-specificity) on the x-axis. It is interpreted as the probability that a patient with a higher predicted probability has the outcome when two patients, one with and one without the outcome, are considered. We will present both the ROC curve and the AUC value (i.e., c statistic).
25
y-axis against the predicted probability of hysterectomy on the x-axis. We will also estimate the intercept and slope of the calibration line in a logistic regression by regressing the observed outcome on the predicted probabilities; perfect calibration, whereby the observed distributions of outcomes and predicted probabilities are in complete agreement, is indicated by an intercept of 0 and a slope of 1.136 3.2.4.1.5 Model validation
Internal validation, the validity of the model in the underlying population that the data came from, may address issues of stability in predictor selection (which we will not employ) and quality of the predictions. The apparent performance of a prediction model is always better in the
training/development set than it is in a validation set, even when the two datasets come from the same population; the magnitude of this “optimism” can be used to correct performance metrics such as the AUC.
Internal validation is commonly performed using a split-sample approach: a (usually random) percentage of the study population is included in the training/development stage of prediction and the remaining percentage of the study population is used for validation of the model. In simulation studies, this method resulted in underestimation of the model’s performance, unstable estimates, and a high root mean squared error (RMSE); large sample sizes are also required to make this method reasonable. In cross-validation, development occurs in a percentage of the population, validation occurs in the remaining percentage, and vice versa; this procedure is repeated numerous times and the average is taken as an estimate of performance. In simulation studies, this method was preferred over split-sample validation but it did not accurately estimate all of the performance measures.
Bootstrapping methods performed similarly to cross-validation methods in the simulation studies, resulting in stable and nearly unbiased estimates of performance; bootstrapping also resulted in the lowest RSME values across methods.137
26
among premenopausal women in each of the bootstrap datasets. The training/development sample will include 100% of the participants outlined above from the PROOF study. The bootstrap samples will also be drawn from 100% of the participants, resulting in bootstrap samples the same size as the training/development set; on average 63.2% of the participants will be included in at least one
bootstrap sample.138 The bootstrap is used to estimate optimism, the decrease in performance between the bootstrap sample and performance in the original sample. The optimism-corrected performance is then calculated by subtracting the optimism from the apparent performance of the model in the original training/development sample.134 The observed optimism will be used to correct the AUC. An independent study population has not been identified for this prediction model and thus, no external validation will be carried out. It has been suggested that even internal validation with bootstrapping methods is not sufficient in small datasets139 so external validation will need to eventually be carried out if this model is to be considered for clinical practice or other settings.
3.2.4.2 Specific aim 2
All of the methods described above will be repeated for a prediction model that includes one additional predictor variable with 1 degree of freedom. The variable regarding family history of common, benign gynecologic conditions in the biological mother or sisters will be a dichotomous
summary variable (yes/no) derived from multiple yes/no interview questions regarding endometriosis,
fibroids, and ovarian cysts in first-degree relatives (the biological mother or sisters). Daughters are
not considered because the premenopausal women included in this study will, on average, not have
daughters old enough to have had the opportunity to be diagnosed with these common, benign
gynecologic conditions.
Whether the addition of family history information substantially improves prediction will be tested by evaluating whether the difference between the two models’ AUC equals zero;140
27
describe the reclassification, we will calculate the percent of patients reclassified and the percent of reclassified patients that were reclassified correctly144 as well as the Net Reclassification
Improvement (NRI).143,145 The NRI is similar to the percent of patients reclassified, but it takes into account movements in the correct direction. In other words, the NRI reflects the movement of cases upward and the movement of controls downward, calculated in the following way:
28
Table 1. Variables included in the prediction models for hysterectomy with the intention of ovarian conservation among pre-menopausal women in the Prospective Research on Ovarian Function (PROOF) Study
Predictor Self-Report Options / Related Questions from Interview
Parameterization in Prediction Models
Degree(s) of Freedom
Age Age in years Linear 1
Race
Nominal categorical: white; black/African-American; American Indian/Eskimo; Asian/Pacific Islander; other
Nominal categorical: white;
black/African-American; other 2
Marital status
Nominal categorical: single, never married; married; living with significant other; divorced/separated; widowed
Nominal categorical: single, never married; married/living with significant other; divorced/separated/widowed
2
Education level
Nominal categorical: 8th grade or less; 9th to 11th grade; high school
grad/GED; post high school trade or tech school; 1-3 years college; college grad; graduate/professional school
Nominal categorical: high school graduate or lower; some college or post-high school schooling; college graduate or higher
2
Duration of OC use
Continuous time in years based on number of years and months reported for total OC use
Restricted cubic spline with 4 knots at 1 year; 3 years; 5 years; and 10 years
3
Number of full-term
pregnancies
Count variable for number of full-term pregnancies
Restricted cubic spline with 3
knots at 1, 2, and 3 pregnancies 2
Tubal ligation Dichotomous categorical: yes, no Dichotomous categorical: yes, no 1
Uterine leiomyomas (Fibroids)
Dichotomous categorical: yes, no Dichotomous categorical: yes, no 1
Endometriosis Dichotomous categorical: yes, no Dichotomous categorical: yes, no 1
Ovarian cysts Dichotomous categorical: yes, no Dichotomous categorical: yes, no 1
Previous
myomectomy Dichotomous categorical: yes, no Dichotomous categorical: yes, no 1
Smoking status
Derived from two questions: (Have you smoked at least 100 cigarettes in your entire life?) and (Do you smoke cigarettes now?)
Nominal categorical: never;
former; current 2
BMI
Continuous BMI at baseline calculated as kg/m2 (derived from self-reported height in feet and inches and weight in pounds)
Restricted cubic spline with 3 knots at 18.5 (lower limit of “normal”), 25 (lower limit of “overweight”), and 30 (lower limit of “obese”)
2 Family history of common benign gynecologic disorders in mother and/or sister(s)
Derived from a number of yes/no questions in the interview regarding endometriosis, fibroids, and ovarian cysts in the biological mother and/or sister(s).
29
CHAPTER 4. A POOLED ANALYSIS OF HYSTERECTOMY AND SUBTYPES OF EPITHELIAL OVARIAN CANCER
4.1 Abstract
Epidemiologic studies have generally reported inverse associations between hysterectomy and ovarian cancer. However, recent reports indicate that ovarian cancer is a heterogeneous disease with histologic subtype-specific risk factors and the association with hysterectomy may be changing. We conducted a pooled analysis of 12,499 epithelial ovarian cancer (EOC) cases and 16,887 controls from 15 studies in the Ovarian Cancer Association Consortium (OCAC) to evaluate the association between hysterectomy and subtypes of EOC. Study-specific odds ratios (OR) were calculated by conditional logistic regression conditioned on age and race/ethnicity and pooled using random-effects models; 95% prediction intervals (PI) were calculated when between-study variance was >0.
Hysterectomy was associated with an average relative increase of 19% in the odds (average OR =1.19, 95% PI: 1.05, 1.36) for invasive EOC. The average ORs for all low malignant potential (LMP) tumors and subtypes of LMP serous, invasive serous, invasive endometrioid, and mucinous EOC were above the null. There was an inverse association between hysterectomy and invasive clear cell EOC (average OR=0.75, 95% PI: 0.28, 2.00). Hysterectomies prior to age 40 (average OR=1.36, 95% PI: 1.15, 1.61) or ≥30 years in the past (average OR=1.85, 95% PI: 0.88, 3.90) were positively
30 4.2 Introduction
Older studies have generally reported that hysterectomy, with or without unilateral oophorectomy, is inversely associated with, and interpreted as causally reducing, risk of EOC.147 However, recent research showing that EOC is a heterogeneous disease, with risk factors differing by histologic subtypes,58,61,62,105,107,108,148-151 prompts a new examination of this hypothesis among
different histological types of EOC. Additionally, examination of a recent meta-analysis147 suggests that the relationship between hysterectomy and EOC may be changing, though the overall conclusion was that hysterectomy is associated with a decrease in risk.
Hysterectomy is common, with ~600,000 hysterectomies performed annually in the US. More than one-third of women will have a hysterectomy by age 60.2,3 The hysterectomy rate in the US peaked in 1975, when more than 725,000 were performed, declined through the 1980s, leveled off in the 1990s, and decreased approximately 1.9% per year between 1997 and 2005.2-6 Hysterectomy rates in Australia, Europe, and the United Kingdom have also been declining in recent years and are lower than in the US.9,10,152-157 Most hysterectomies are performed for benign gynecologic conditions such as uterine leiomyoma, excessive bleeding, uterine prolapse, and endometriosis.8,25 Given that it is a common procedure, having a better understanding of the relationship between hysterectomy and EOC is important. To that end, we conducted a pooled analysis of hysterectomy and EOC subtypes among nearly 30,000 women from 15 recent case-control studies in the Ovarian Cancer Association Consortium.
4.3 Materials and methods
4.3.1 Data sources
31
gynecological oncology centers and controls from an ovarian cancer screening trial. All studies had ethics board approval and obtained written informed consent from all participants.
Self-reported data for hysterectomy and other epidemiologic variables from each study were submitted to the OCAC data coordination center at Duke University where common coding schemes were applied. Non-epithelial ovarian cancer cases and epithelial cases with missing tumor behavior (i.e., LMP or invasive) or histology were excluded from the analysis (n=278). Additionally, women with missing ages at diagnosis (cases), interview/reference date (controls) or hysterectomy were excluded (n=669). Our analytic dataset included 2,654 women with LMP ovarian tumors, 9,845 women with invasive EOC, and 16,887 controls.
4.3.2 Statistical methods
The primary exposure was defined as hysterectomy that occurred >2 years prior to diagnosis (cases) or interview/reference date (controls). Women reporting hysterectomy within two years of diagnosis were considered ‘unexposed’ to avoid including cases whose hysterectomies were related to their (sub-clinical) ovarian cancer in the exposed group. We also analyzed age at hysterectomy (<40 and >40 years) and time since hysterectomy (2- <15 years, 15- <30 years, and >30 years).
For primary analyses, we analyzed five case groups: LMP serous; invasive serous; invasive endometrioid; invasive clear cell; and mucinous (LMP and invasive combined). We also evaluated cases with LMP and invasive mucinous tumors separately. Similarly, we evaluated low-grade (grade=1/well-differentiated) and high-grade (grade=2+/moderately, poorly, or undifferentiated) invasive serous cancers separately (LGSC and HGSC, respectively).109,110 Results were similar for both LGSC/HGSC and LMP/invasive mucinous (Appendix Table 1). To facilitate comparisons with the published literature, we also analyzed all invasive EOC cases combined and all LMP tumors combined.