Copyright © 2017 Vilnius Gediminas Technical University (VGTU) Press Technika http://www.bjrbe.vgtu.lt
OF ROAD AND BRIDGE ENGINEERING ISSN 1822-427X / eISSN 1822-4288
2017 Volume 12(3): 145–153
doi:10.3846/bjrbe.2017.17 1. Introduction
The pressure grouting is found to be one of the most sig-nificant factors determining pullout capacity of ground an-chors. Domes (2015) investigated the influence of pressure grouting in the non-cohesive soil. The impact of pressure grouting on the stress magnitudes on the anchor surface and the properties of the adjacent soil have been studied. Lee et al. (2012) analysed the influence of pressure grouting on the diameter enlargement and the pullout force of com-pression ground anchors. Post-grouting has been experi-mentally investigated by e.g. Littlejohn (1980) and Jones et al. (1980). Mišove (1984) carried out an extensive test-ing program on ground anchors, includtest-ing excavation and detailed examination of fixed length shapes and their in-creased diameters. Mecsi (1997) analysed radial stress acts on the surface of the fixed length of the anchor in detail.
This process is possible to modelling by numerical methods. Desai et al. (1986) analysed the interaction of a
ground anchor with surrounding soil by using a 3D mat-hematical model and the Finite Element Method (FEM). Kim et al. (2007) investigated a load transfer mechanism from a prestressed ground anchor to sandy clay by using the ABAQUS software. Tchuchnigg (2008), Ghosh and Kumar (2015) also applied FEM techniques for ground anchor behaviour analysis. Hu and Hsu (2012) applied FLAC software to simulate the anchor-soil interaction of load tests.
The anchor pullout capacity determined by the FEM needs to be validated by investigation tests. The number of investigation tests currently is very limited in the practice Duzceer et al. (2015), Ene et al. (2014), Jacquar Fondasol (2014). However, there is the relatively large amount of data available from acceptance tests (due to the requirements of standards for prestressed soil anchors, e.g. EN 1537 Execu-tion of Special Geotechnical Work - Ground Anchors in Eu-rope or PTI DC35.1-14: Recommendations for Prestressed
STATISTICAL-NUMERICAL ANALYSIS FOR PULLOUT TESTS
OF GROUND ANCHORS
Juraj Chalmovský1, Jan Štefaňák2, Lumír Miča3, Zdenek Kala4, Šarūnas Skuodis5,
Arnoldas Norkus6, Daiva Žilionienė7
1, 2, 3Dept of Geotechnics, Brno University of Technology, Veveří 331/95, 602 00 Brno, Czech Republic 4Institute of Structural Mechanics, Brno University of Technology, Veveří 331/95, 602 00 Brno, Czech Republic 5Dept of Geotechnical Engineering, Vilnius Gediminas Technical University, Saulėtekio al. 11, Vilnius 10223, Lithuania 6Geotechnical Research Laboratory, Vilnius Gediminas Technical University, Saulėtekio al. 11, Vilnius 10223, Lithuania
7Dept of Roads, Vilnius Gediminas Technical University, Saulėtekio al. 11, Vilnius 10223, Lithuania E-mails:1[email protected]; 2[email protected]; 3[email protected]; 4[email protected];
5[email protected]; 6[email protected]; 7[email protected]
Abstract. The paper presents an application of statistical and numerical methods for the determination of the force-displacement curves and that of pullout capacity of prestressed grouted ground anchors installed in Miocene clay. A re-gression analysis of data from a database of acceptance test records for ground anchors to create has been performed, the force-displacement curve of the tested anchor corresponding to the range of loads applied for acceptance tests has been created. A linear regression model, employing the weighted least squares method and robust standard errors techniques were concluded to serve as a reliable statistical method suitable for achieving this goal. The discovered linear regression dependence then served as a lower control limit for the displacement values calculated at the anchor head applying the numerical model. A finite element model has been created to predict the behaviour of ground anchors being installed in fine-grained soils. The developed numerical model that employs Mohr-Coulomb strength criterion constitutive model evaluates the influence of high-pressure grouting by development additional radial stresses and that of an increment of fixed length diameter.
Rock and Soil Anchors in the US, an acceptance test must be carried out on every system anchor).
Statistical analyses for measured pullout resistances have been conducted previously following procedures by Hegazy (2002). The correlation the forces of applied traction
versus the corresponding measured elongations of ground anchor tendon was analysed by Sciacca et al. (2014). Shahn (2014) used the evolutionary polynomial techniques to mo-del the pullout capacity of small ground anchors.
Hence, the authors decided to perform statistical ana-lysis procedures with available test data and subsequent-ly employ the obtained results as an alternative means of checking the FEM model. The combination of statistical method and FEM, including post-grouting effect, for the determining of the force-displacement curve and that of the pullout capacity of prestressed grouted ground an-chors is applied in the investigation.
2. Field load test
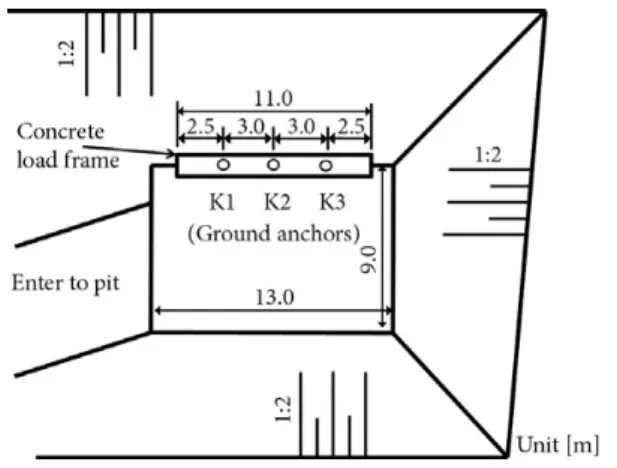
Full-scale anchor pullout load tests (ULS) have been per-formed for three high-pressure grouted anchors in the ex-perimental site in Czech Republic (Fig. 1) before the con-struction of a railway tunnel have been started by Velič, Mišove (2004). Tests were equipped for determining maxi-mum pullout forces magnitudes (Fig. 1). The results from this type of test have been employed for back-analysis pro-cedures. Sixty eight system anchors have been then used for supporting a diaphragm wall during the construction of a tunnel. The acceptance tests were set up via the same technical procedures and in the same geological conditions as those employed in the investigation tests. The character-istics of the tested anchors are summarized in Table 1.
The ground anchors have been installed in Miocene clay with very high, locally extreme, plasticity (symbol CV and CE according to the USCS). The clay was fully saturated. The index properties of Miocene clay are summarized in Table 2. 3. Construction of the stress-strain diagrams of anchors from acceptance test data using regression analysis Acceptance test reports of sixty eight above mentioned system anchors have been created during the loading ac-cording to EN 1537: 2001. The displacement uyand the force Fy (proof load) at the anchor head have been meas-ured at each loading cycle. The relationship between these two variables is described via stochastic dependence, that takes multiple uy values derived from a specific probability distribution for one particular Fy value (Fig. 2). The aims of the regression analysis are:
(i) to find the parameters of the linear relation of va-riables uy versus Fy and
(ii) to confirm the correctness and assumptions of the linear regression model.
One of the assumptions of linear regression model states that the mean values E(uy, 1), E(uy, 2), E(uy, 3) lie on the line. The mean values E(uy, i) are the means of prob-ability distributions of the displacement uy. Samples of uy come from measurement of displacement at a specific level of the force Fy for every system anchor. Assessment proce-dures resulted that the dependence the proof load versus displacement (measured at the anchor head) is almost lin-ear. Assumptions of the linear regression model are:
1) it is adopted a specified model, equation is correct-ly selected;
Table 1. Tested anchor description
Characteristic of anchor Investigation tests Acceptance tests Type of anchor* Temporary
8×Lp15.7–1770 8×TemporaryLp15.7–1770 Free anchor length Lfree 8.1 m 11.0 m Fixed anchor length Lfixed 11.5 m 11.5 m Inclination of the borehole 63.5o 22o
Note: * the tendon consists of eight cables with a diameter of 15.7 mm and a tensile strength of 1770 MPa.
Table 2. Properties of Miocene clay
Properties Symbol Unit Value Water content w % 30.6 Liquid limit wL % 62.0 Plasticity limit wP % 24.5 Particle density ρs kg⋅m–3 2692
Void ratio e – 0.67
Fig. 1. Schematic ground plan of the test site
2) mean error term is equal to zero;
3) an error has a constant variance component (Ho-moscedasticity condition);
4) the components of the error vector are uncorrelated; 5) the residual component has a normal distribution. Verification of these assumptions is carried out fur-ther in Sections 3.1–3.8. GRETL software has performed regression analysis. The chosen significance level of all tests was α = 0.05.
3.1. Measured data analysis
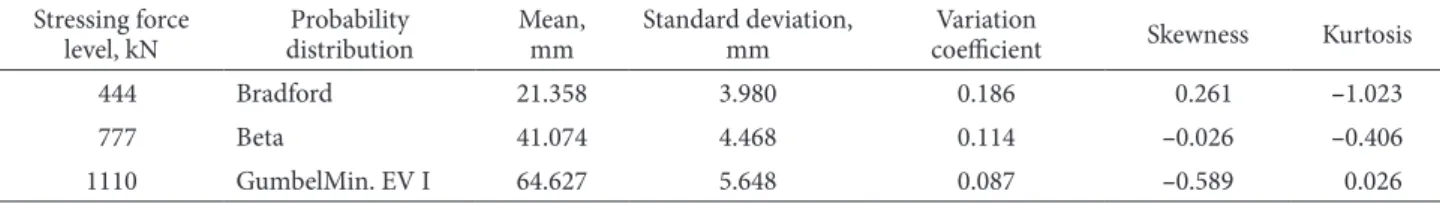
The data report results of acceptance tests have been em-ployed as the input data for the regression analysis. The displacements have been measured for each anchor for three load levels. Following the Anderson−Darling Good-ness-of-Fit test (Anderson, Darling 1952, 1954), the ap-propriate probability distribution is allocated to the dis-placement data set measured at each load level (Table 3).
For comparison, the stress-strain diagrams of the sys-tem anchors have been adjusted for elastic strains (corres-ponding to the free length difference of both anchor types (Table 1)).
3.2. Model quality evaluation
An estimation of regression parameters βi has been per-formed applying the least squares method (LSM). Sub-sequently, the regression diagnostic has been done. It in-cluded checking the LSM assumptions and evaluating the quality of the βicoefficients. The following Eq summarizes the obtained final result:
= −6.28 0.05+
y y
u F . (1)
A graph of the determined regression model is plot-ted in Fig. 3.
One must note, that an application of the linear re-gression model includes several additional assumptions, which should always be verified using appropriate dia-gnostic methods.
3.3. Variance analysis
The variance analysis (ANOVA) has been carried out for quantifying the variability of the created regression model. The residual sum of squares (RSS) and the determination coefficient R2 were calculated via this analysis.
The Pearson correlation coefficient R and the stan-dard error of the regression σˆ were also quantified. The data of variance analysis results of the linear regression model are presented in Table 5.
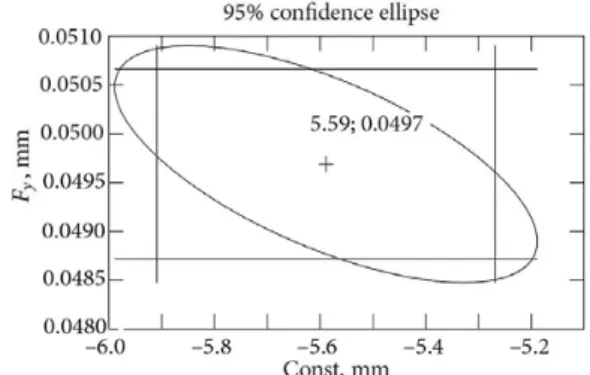
3.4. Confidence interval for regression coefficient The p-value of the t-statistics, calculated for the βi coeffi-cients indicates the maximal possible level of trust for which the null hypothesis H0: βi = 0 is acceptable. Confidence in-tervals with 95% probability have been constructed for both parameters (Table 5). The confidence ellipse serves as point estimate of the regression parameters (Fig. 6).
3.5. Testing of LSM assumptions
There are some assumptions behind the LSM:
−regression coefficients βi can take arbitrary magni-tudes,
−the regression coefficients are linear, the additive model of measuring is valid.
There is an assumption for the vector of residuals ε, stating that its elements are independent. The verification of linear regression (1) includes verification of normality of the value ε. They correspond a normal distribution with null mean and finite variance E (ε2) = σ2 (homoscedastici-ty) (Meloun, Militký 2011).
3.6. Heteroscedasticity testing
Heteroscedasticity term states that variance is parameter-dependent. The White and Breusch−Pagan (Yurekli, Ku-runc 2005) tests of null hypothesis H0: checking if data are homoscedastic were carried out. The summarized results of those tests are presented in Table 4. In analysed case the processed data result in heteroscedasticity. Subsequently, the LSM analysis requires modification procedures for the next step. It is evident also from Fig. 4 that the variance in the analysed case is variable for all data.
3.7. Testing the normality of the error distribution The assumption of the standard distribution of errors in-troduces the null hypothesis H0: the vector of errors is usu-ally distributed and has null mean value. If the distribu-tion is normal, the points on normal quantile plots of the
Table 3. Probability distribution parameters of measured displacements for the particular stressing force level Stressing force
level, kN distributionProbability Mean, mm Standard deviation, mm coefficientVariation Skewness Kurtosis 444 Bradford 21.358 3.980 0.186 0.261 –1.023 777 Beta 41.074 4.468 0.114 –0.026 –0.406 1110 GumbelMin. EV I 64.627 5.648 0.087 –0.589 0.026
residuals Q-Q fall close to the diagonal reference line y = x. The S-shaped pattern of deviations indicates excessive kur-tosis of residuals (Fig. 6).
The Chi-square Goodness-of-Fittest (Pearson 1900) with the final p-value = 0.075 has been carried out for verification of the error distribution normality. Because of the trial, one can state that the normality of the error
assumption of the considered linear regression model is valid. Figure 6 presents the graphical output of the Chi -square Goodness-of-Fit test (the skewness of the distribu-tion of residuals is 0.173, and the kurtosis is 0.311). 3.8. Weighted Least Squares Method
It is possible to correct the estimates of the βicoefficients of the model by using the weighted least squares method (WLSM). Instead of finding the minimum of the function
(
)
(
)
=
∑
− β + β1 2 21
n
i i
RSS y x , (2)
the minimum weighted sum of squared residuals
(
)
(
)
=
∑
− β + β1 2 21
n
w i i i
RSS w y x (3)
is determined. The latter gives more efficient estimation of βicoefficients. Here wiis a non-negative constant, referred to as weight. The weight was determined using the heter-oscedasticity-corrected linear regression model. Equation (4) defines weight wi:
( ) =
*
1
i u
w
e , (4)
where u* are output values, obtained from the auxiliary re-gression function considering the dependence of quadrate logarithms of residuum (from the model constructed us-ing the LSM) and interpretus-ing the variable xiand its quad-rate magnitudes
ε = β2 1, + β2, + β3, 2+ ε
log aux aux ix aux ix aux. (5)
3.9. Summary of the regression analysis and discussion of results
Two model variants describing the dependence of uy ver-sus Fy have been developed, following the procedures de-scribed above:
LSM: uy= −6.28292 0.0504999+ Fy+ ε, (6)
WLSM:
uy= −5.58890 0.0496875+ Fy+ ε. (7) It was found that the WLSM yields higher accuracy de-pendence of uy versus Fy comparing with the one obtained by LSM having performed the regression diagnostic. The p-values of the βicoefficients are lower the ones obtained by the WLSM. The confidence intervals of the βi coeffi-cients are narrower for WLSM (Table 6, Figs 7 and 8). The determined residual sum of squares RSS and Akaike In-formation Criterion (AIC) values are less in the case of the second model. The higher R2 indicates the higher explana-tory power of the WLSM (Table 5).
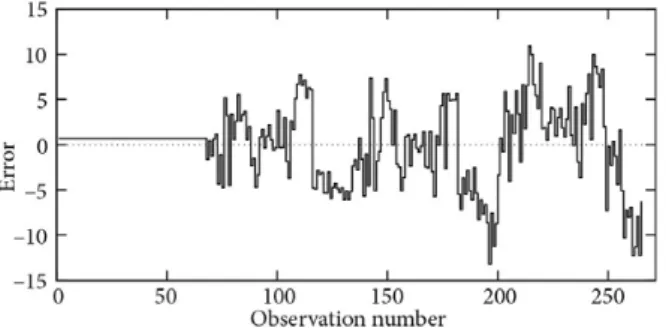
Fig. 4. Graph of residuals by observation number
Table 4. Results of the heteroscedasticity tests
Heteroscedasticity Test Test statistic value p-value White 47.754 4.269e–011 Breusch-Pagan 55.783 8.092e–014
Fig. 5. Graph of residuals by observation number
A branch of the stress-strain diagram for the anchor is constructed as a base for the regression model (7) and is plotted in Fig. 11.
The verification analysis of the assumptions of lin-ear regression model confirmed the linlin-ear dependence of the proof load versus displacement. The correctness of the specified model and him assumptions of mean error term equal to zero have been met. The hypothesis of the nor-mal distribution of residual components is also valid. The assumptions of the constant error of variance component was not met, which led to an adjustment of the LSM. The obtained results are valid for the loading intervals of per-formed acceptance tests.
4. Finite element analysis
The Plaxis software 2D (Brinkgreve et al. 2012) have been employed for numerical (FEM) modelling of the pullout resistance for ground anchor. An axisymmetric model, a width of 12 m and a height of 24 m has been created. The anchor has been modelled vertically positioned to achieve the condition of axisymmetry. The latter is a certain sim-plification compared with reality (Table 1).
4.1. Description of the 2D mathematical model
The mesh of 2D 15-nodded triangular finite elements with fourth order interpolation of displacement and twelve Gauss points for the numerical integration have been em-ployed along anchor length. An additional mesh refine-ment has been set close to the fixed length of the anchor (Fig. 10). Figure 10a presents meshes (optimized and ini-tial) and Fig. 10b the transition from the free to the fixed length. Displacement controlled loading at the anchor head has been adopted. The interface anchor body and surrounding soil have been modelled by the interface of finite elements, which is implemented in software Plaxis.
The total influence of post-grouting is done by two aspects:
(i) increasing of diameter of the fixed body of the an-chor,
(ii) increasing of a radial stress caused by its volume-tric expansion due to the post-grouting.
Prescribed volumetric strain values of the relevant fi-nite elements have been assigned to introduce the effect of the post-grouting (Fig. 9).
Similar procedures have been applied in, e.g. for the mathematical modelling of compensation grouting (Kum-merer 2003). The volume of elements change ∆V0e is a function of the given volumetric strain and that of the ori-ginal volume V0e:
∆V0e = εT vol, V0e. (8)
Table 6. Confidence intervals of the parameters for the LSM Model Coefficient p-value 95% confidence interval
LSM β1–const 1.59e–028 –7.2709700 –5.2948600 β2–Fy 7.56e–175 0.0491156 0.0518843
WLSM β1–const 3.30e–099 –5.9092800 –5.2685300
β2–Fy 3.52e–212 0.0487170 0.0506581
Table 5. Qualitycomparison of estimated models
Model RSS F p-value F R2 R σˆ AIC
LSM 4789 5159 7.6e–175 0.9515 0.975 4.26 1523 WLSM 628 10161 3.5e–212 0.9748 0.9873 1.55 984
Fig. 7. Confidence ellipse of regression coefficients for the LSM
Fig. 8. Confidence ellipse of regression coefficients for the WLSM
The components of the volumetric strain vector εt
are as follow (in the case of the isotropic volumetric strain):
{
}
ε = εt T xx, ; εT yy, ; εT zz, ; εT xy, ; εT yz, ; εT zx, T, (9)
ε ε , = ε , = ε , = ,
3
T vol
T xx T yy T zz , (10)
εT xy, = εT yz, = εT zx, =0. (11)
The Mohr-Coulomb (M-C) model was chosen for si-mulation of soil behaviour Brinkgreve et al. (2012). Input parameters have been determined for the available geolo-gical survey; relevant technical reports have been produ-ced by company Amberg Engineering Brno a.s. (Table 7).
During the loading of a grouted ground anchor, the grout in the fixed length have been stressed by gradual tension up to the tensile strength limit magnitude. Tensile cracks occurred during the process. When using the line-ar elastic model, the tensile stress magnitude is unlimited. Due to the M-C model, tensile stress limitation has also been applied to the grout material. An additional plasticity function is available (Eq 12), where is the maximum allo-wable tensile stress (tensile strength) magnitude. The grou-ting material has strength in tension σt = 2000 kPa, so:
′ = σ − σ1
t t
f . (12)
4.2. Methodology of the performed analysis
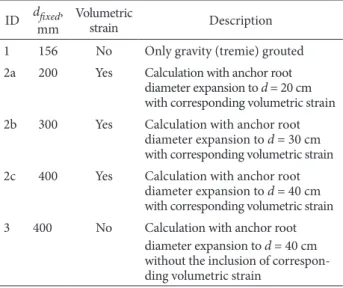
According to Mišove (1984), the grouted ground anchor final diameter of anchor root varies within the range of 20 cm to 40 cm, depending on geological conditions. By this assumption, one can determine the available values of the volumetric strains, that serve as input data for the calculation procedures. A parametric study has been per-formed to investigate the influence of the diameter, which varied within the interval mentioned above range (Table 8, steps 2a, 2b, and 2c). In the final step 3 (Table 8), the in-crease in the diameter of the fixed length of the anchor (dfixed = 40 cm) has been considered in combination with neglecting the corresponding volumetric strain being in-duced actually. By combining the separate initial data, one can investigate the relative influence of both factors (of di-ameter and that of radial stress) for anchor behaviour. The performed modelling cases are presented in Table 8.
Fig. 10. Finite element mesh of model
Table 8. Methodology of the performed analysis
ID dfixed,
mm Volumetric strain Description 1 156 No Only gravity (tremie) grouted 2a 200 Yes Calculation with anchor root
diameter expansion to d = 20 cm with corresponding volumetric strain 2b 300 Yes Calculation with anchor root
diameter expansion to d = 30 cm with corresponding volumetric strain 2c 400 Yes Calculation with anchor root
diameter expansion to d = 40 cm with corresponding volumetric strain 3 400 No Calculation with anchor root
diameter expansion to d = 40 cm without the inclusion of correspon-ding volumetric strain
Table 7. Input parameter values for the M-C model Input parameter
Value Name Symbol Unit
Unit weight γ kN/m3 20.5
Young's modulus Eref kPa 5000
Puasson's coef. νref – 0.3 Cohession c´ref kN/m2 8.0
Angle of internal friction φ´ o 0
4.3. Summary of the FEM analysis and discussion of results
Force versus deformation diagrams has been plotted for each case (Figs 11 and 12). Besides the FEM calculation results, the regression dependence found using the WLSM (Chapter 3) and the measurements from three investi-gation load tests (anchors K1 to K3) have been added to Figs 12 and 13.
The alternative analysis case ID 1, which ignores the post-grouting influence, significantly underestimates the anchor pullout capacity. In the case ID 2a, the theoretical pullout capacity has been reached prematurely. For case ID 2b a better prediction has been obtained comparing with that of for ID 2a case, though the calculated pullout capacity was still lower than the measured capacity by experiments one. For the last considered alternative ID 2c, the satisfactory agreement of measured versus computed displacements has been reached even at the highest load increment stages. One must emphasize that final state has been not reached during the investigation test despite a substantial increase in anchor permanent displacements. The latter situation conforms to the ID 2c prediction. The linear regression provides a sufficient match with the mea-sured and computed displacements for several first loading stages (lower than 500 kN magnitude). For larger load ma-gnitude stages, the regression analysis underestimates the anchor head displacement. The latter finding confirms the significant contribution of permanent soil plastic defor-mations developed on the soil – anchor interface.
The limit state in case ID 3 has been achieved fore-most comparing with remaining simulation cases (Fig. 12); the calculated ultimate (pullout) force magnitude was even lowered the one determined by ID 2b one. The larger com-puted ultimate force magnitude has been obtained for the case ID 2c. In this case, the factor of effective radial stress increment, and consequently, the shear strength incre-ment has been taken into account. The distributions of the mobilized shear stress and the radial stress in the horizon-tal cut at the middle of the fixed length for the final stage are presented in Fig. 13.
Mobilised relative shear stress distribution around the fixed anchor length that of for vertical displacement are plotted for case ID 2c (Fig. 14).
5. Conclusions
The paper summarized a set of pullout testing data for ground anchors in concern with performed numerical simulations of appropriate behaviour. Comparative analy-sis of testing and simulation results yield proper linear re-sponse for anchor soil base versus applied load. The paper focused on the prediction of force-displacement curves, rather than on the determination of the pullout capacity of ground anchors. Depending on the results of this study, the following conclusions are drawn:
1. Statistical analysis – the process of constructing the force-displacement curves of anchors from a set of accep-tance tests via the use of the Weighted Least Square Method
Fig. 11. Comparison of the results of investigation load tests, regression analysis, and numerical analysis
Fig. 12. Influence of the applied volumetric strain
with an appropriately chosen weighted coefficient is descri-bed. The Weighted Least Square Method has been selected as the optimal method for this investigation via the regres-sion diagnostic (of the qualitative evaluating criteria for two alternative models). When compared to the curve from the investigation test, the statistically determined force-displa-cement curve diverges from the certain prestressing force value. This result has been obtained despite the fact that de-termination coefficient magnitudes are large. The following result is conditioned by an application of the linear trend in the Weighted Least Square Method, regression model. This model is unconcerned with the nonlinear strain increase at the anchor bond (the permanent/plastic part of the displa-cement). The use of the linear trend is nevertheless justified because the force-displacement curve is almost linear in the range of considered load variation bounds, which are usually applied for acceptance tests. The importance of the constructed linear regression dependence lies in the deter-mination of the lower control limit of the displacement va-lues at the anchor head for the evaluation of the developed numerical model.
2. Numerical analysis – the Finite Element Method techniques have been employed to predict the force-dis-placement behaviour of the grouted ground anchor. The Finite Element Method analysis focused on considering the impact of high-pressure grouting. Soil-structure inte-raction has been simulated by using zero thickness inter-face elements. The Mohr-Coulomb constitutive model has been employed both for the surrounding soil and of the grout material with the aim to limit grout tensile strength.
The final analysis using the Finite Element Met-hod proved that high-pressure grouting is the significant
Fig. 14. Distribution of the relative shear stresses (a) and vertical displacement (b)
influence predetermining behaviour of the anchor (both on the shape of the force-displacement curve and the ulti-mate carrying capacity). Five different analysis cases have been performed. The high-pressure grouting has been si-mulated via an increasing the diameter of the ground an-chor body and by the additional application of volumetric strain to the relevant finite elements. The best fit has been reached for the simulation with a diameter expansion to 40 cm and with the corresponding volumetric strain de-velopment. The reasonable match has been achieved when comparing the force-displacement curves of the ground anchor, constructed by using the mathematical model des-cribed above and the load-displacement curve obtained from the investigation tests.
The presented study confirmed that considering the influence of high-pressure grouting via the Finite Element Method techniques and the combination of the diameter increment for the fixed length of the anchor and that of the corresponding volumetric strain introduction ensures the important increase of accuracy for prediction of the load-displacement curve and subsequently for determining the proper ultimate pullout capacity magnitude.
One must emphasize that these proposed models have been used for the particular type of anchors, simi-lar to analysed in paper ones, namely: prestressed grouted ground anchors with steel strand tendon placed in clays of very high plasticity. The latter limitation is conditioned by the fact that relative anchor-soil stiffness significantly inf-luences the behaviour of structures like ground anchors. For different as to analysed conditions, namely for various type of pressure grouting, confining stress, soil type, and anchor type, the developed analysis models, have to be appropriately adjusted.
Acknowledgements
This research was financially supported by the Ministry of Industry and Trade of the Czech Republic under research project No. FR-TI4/329 and Centrum AdMaS “Advanced Materials, Structures, and Technologies” Regional Centre (grant No. CZ.1.05/2.1.00/03.0097). The authors thank the companies Amberg Engineering, VUIS-Zakladanie Stavieb, s.r.o. and SŽDC for providing the documentation. References
Anderson, T. W.; Darling, D. A. 1952. Asymptotic Theory of Cer-tain ”Goodness of-Fit” Criteria Based on Stochastic Process-es, Annals of Mathematical Statistics 23(2): 193−212.
https://doi.org/10.1214/aoms/1177729437
Anderson, T. W.; Darling, D. A. 1954. A Test of Goodness-of-Fit, Journal of the American Statistical Association 49(268): 765−769. https://doi.org/10.1080/01621459.1954.10501232
Desai, C.; Muqtadir, A.; Scheele, F. 1986. Interaction Analysis of Anchor‐Soil Systems, Journal of Geotechnical Engineering
112(5): 537–553.
https://doi.org/10.1061/(ASCE)0733-9410(1986)112:5(537)
Duzceer, R.; Mothersille, D.; Okumusoglu, B.; Gokalp, A. 2015. Support of 25 m Deep Excavation Using Ground Anchors in Russia, in Proc. of the ICE − Geotechnical Engineering. 168(4): 281−295. https://doi.org/10.1680/geng.14.00043
Ene, A.; Marcu, D.; Popa, H. 2014. Testing of Ground Anchorages for a Deep Excavation Retaining System in Bucharest, in Proc. XV Danube − European Conference on Geotechnical Engineer-ing (DECGE 2014), 9−11 September 2014, Vienna, Austria, Paper No. 176. 6 p.
Ghosh, P.; Kumar, R. 2015. Numerical Study on Static Interaction of Closely Spaced Horizontal Square or Rectangular Ground Anchors in c-ϕ Soil, International Journal of Geosynthetics and Ground Engineering 1(4):1−7.
https://doi.org/10.1007/s40891-015-0037-z
Hegazy, Y. A. 2002. Reliability of Estimated Anchor Pullout Re-sistance, Grouting and Ground Treatment. Reston, VA: Amer-ican Society of Civil Engineers, 772−779.
Hu, W. C.; Hsu, S. T. 2012. Numerical Modelingof Earth Struc-tures: Frictional Anchors in Sand, Advanced Materials Re-search (486): 214–220.
https://doi.org/10.4028/www.scientific.net/AMR.486.214
Jacquar Fondasol, F. C. 2014. Foundations by Prestressing An-chors of the “Villa Méditerranée” in Marseille from Design to Monitoring, in Proc. of the ISSMGE Technical Committee 207 International Conference on Geotechnical Engineering − Soil-Structure Interaction, Underground Soil-Structures and Retain-ing Walls, 16−18 June 2014, St Petersburg, Russia. 127−131.
http://doi.org/10.3233/978-1-61499-464-0-127
Jones, D. A.; Turner, M. J. 1980. Load Tests on Post-Grouted Mi-cropiles in London Clay, Ground Engineering 13(6): 47–53. Kim, N. K.; Park, J. S.; Kim S. K. 2007. Numerical Simulation of
Ground Anchors, Computers and Geotechnics 34(6): 498–507.
https://doi.org/10.1016/j.compgeo.2006.09.002
Kummerer, C. 2003. Numerical Modelling of Displacement Grout-ing and Application to Case Histories. PhD thesis. Gratz, Tech-nische Universität Graz.
Littlejohn, G. S. 1980. Design Estimation of the Ultimate Load-Holding Capacity of Ground Anchors, Ground Engineering
13(8): 25–39.
Lee, S. W.; Kim, T. S.; Sim, B. K.; Kim, J. S.; Lee, I. M. 2012. Effect of Pressurized Grouting on Pullout Resistance and Group Effi-ciency of Compression Ground Anchor, Canadian Geotechni-cal Journal 49(8): 939−953. https://doi.org/10.1139/t2012-059
Meloun, M.; Militký, J. 2011. Statistical Data Analysis: a Practical Guide: Complete with 1250 Exercises and Answer Key on CD. Woodhead Publishing India. 773 p.
Mecsi, J. 1997. Some Practical and Theoretical Aspects of Grout-ed Soil Anchors, in Proc. of the ICE Conference on Ground Anchors and Anchored Structures, 20–21 March 1997, Lon-don, United Kingdom. 119–130.
https://doi.org/10.1680/gaaas.26070.0012
Mišove, P. 1984. Konštrukcia predpätých horninových kotiev a ich únosnosť. Doktorská práce (PhD thesis). Bratislava, TU Bratislava (in Slovak).
Pearson, K. 1900. On the Criterion That a Given System of De-viations from the Probable in the Case of a Correlated System of Variables is Such That It Can be Reasonably Supposed to Have Arisen from Random Sampling, Philosophical Magazine Series 5 50(302): 157−175.
https://doi.org/10.1080/14786440009463897
Sciacca, L.; Valmori, F.; Melegari, C.; Maletti, F.; Lenzi, M.; Cam-pana, P.; Padovani, V. 2014. Theoretical and Experimental Investigation on Underwater Ground Anchors, DFI Journal-The Journal of the Deep Foundations Institute 5(1): 15−26.
https://doi.org/10.1179/dfi.2011.002
Velič, P.; Mišove, P. 2004. Typové skúšky dočasných horninových kotev. Česká Třebová. Zpráva (Final Report), VUIS Zak-ladanie stavieb. (in Slovak)
Yurekli, K.; Kurunc. A. 2005. Testing the Residuals of an ARIMA Model on the Cekerek Stream Watershed in Turkey, Turkish Journal of Engineering and Environmental Sciences 29(2): 61−74.