Lucrări ştiinŃifice Zootehnie şi Biotehnologii, vol. 41 (2) (2008), Timişoara
VARIATION IN MEAT COMPOSITION VISCOSITY DURING
THE MIXING PROCESS
VARIA
ł
IA VÂSCOZIT
Ăł
II COMPOZI
ł
IILOR DE CARNE
LA MALAXARE
IANIłCHI DANIELA*, DIACONESCU CRISTIANA*, URDEŞ LAURA*, NICOLAE CARMEN* , MALOŞ I. G*.
*Faculty of Animal Sciences, Bucharest, Romania
Animal raw material processing is directly influenced by the physical and chemical characteristics of the materials which also influence their water holding capacity. The various combinations and status of the raw materials used in the food industry determine specific behaviours that may influence the processing equipment performance and construction. The study on meat composition viscosity depending upon the added components, temperature and mixing time length, has shown that viscosity is increasing with lower added water percentage, lower mixing temperature and higher mixing time length.
Key words: meat composition, viscosity, pork haunch, mixing,
Introduction
In order to study the behaviour of meat under the action of external forces, it is important to know its initial structure. From a physical point of view, meat structure is predominantly aggregate, and has two phases: solid and liquid. The solid phase consists in the proteins that are the basis for the muscle fibers and fascicles; the liquid phase consists in the cell juice while the fibers and fascicles make up a multiple-phase system.
The solid-liquid meat system is not stable as it is influenced by external conditions. Thus, the water in the meat freezes at low temperatures and the meat has the characteristics of a solid body. When minced, it turns into a colloidal system which, macroscopicall speaking, partially behaves like a liquid.
constant at a certain level in the condensed structure. These forces influence the meat composition viscosity and their behaviour under the action of external forces.
Materials and Methods
The study made use of a composition consisting in pork haunch, fatness, water, salt, and polyphosphates. Gammon, bacon and cooled water were finely minced and mixed with the other components. Mixtures were based on the muscle tissue and water as variation factors (15%, 18% and 20% water, and 55%, 53%, 50% meat, respectively), whereas the other components remained constant (30% fat tissue, 2.4% salt and 0.5% polyphosphates).
The parameters that varied during processing were: mixing temperature (5°C, 10°C, 15 °C) and mixing time (5 min., 10 min., 15 min.).
For the laboratory measurements, a Brookfield DVII equipment was used, and viscosity was expressed in Pas.
The experiments led to different behaviours in the dynamic viscosity of the meat compositions.
Results and Discussions
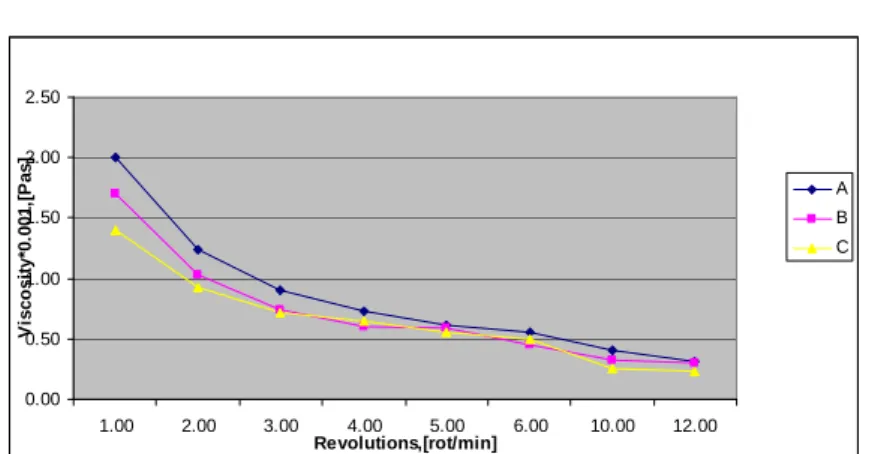
To measure viscosity, in the first stage of the study, chemical composition was constant while the technological parameters, i.e. mixing temperature, varied. The compositions consisting in 55% muscle tissue and 30% fat tissue were finely minced and mixed with 15 % water; after the addition of sodium chloride and polyphosphates, they were mixed for 5 minutes at temperatures of 5°C, 10°C, 15 °C. Figure 1 shows that the dynamic viscosity of the compositions varies inversely proportional with the mixing temperature and revolutions of the viscosimeter axle. Thus, for the same chemical composition and mixing time length, the following results were obtained: 553 Pas for a mixing temperature of 5°C and axle revolution of 6 rot/min, 427 Pas for t = 10°C and rpm = 6, and 412 Pas for t = 15°C and rpm = 6.
Figure 1. Vicosity variation depending upon mixing temperature A- Viscosity variation at 5°C
B- Viscosity variation at 10°C C- Viscosity variation at 15°C
0.00 0.50 1.00 1.50 2.00 2.50
1.00 2.00 3.00 4.00 5.00 6.00 10.00 12.00 Revolutions,[rot/min] V is c o s it y *0 .0 0 1 ,[ P a s ] A B C
Figure 2. Viscosity variation depending upon the water content of the composition A- Composition of 15% added water
B- Composition of 18% added water C- Composition of 20% added water
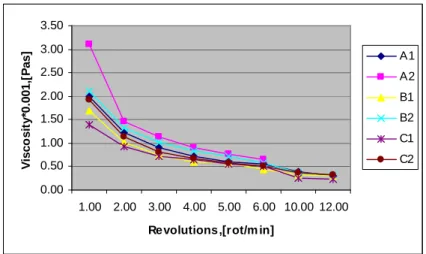
For the same chemical composition (15% added water) and varied mixing time length, figure 3 shows that viscosity is increasing together with
0.00 0.50 1.00 1.50 2.00 2.50
1.00 2.00 3.00 4.00 5.00 6.00 10.00 12.00
viscosity is increasing from 487 Pas for 5 minutes of mixing , to 515 Pas for 10 minutes of mixing and .
Figure 3. Viscosity variation depending upon mixing time length A1 Composition of 15% added water, mixed for 5 mins A2 Composition of 15% added water, mixed for 10 mins B1 Composition of 18% added water, mixed for 5 mins
B2 Composition of 18% added water, mixed for 10 mins C1 Composition of 20% added water, mixed for 5 mins C2 Composition of 20% added water, mixed for 10 mins
Conclusions
Research shows that the variation in chemical composition results in changes of the structural and mechanic characteristics, while more water added leads to lower viscosity of the meat mixtures.
The variation in the forces operating on the materials generates changes in their behaviour, the increased number of revolutions of the viscosimeter leading to lower viscosity.
Also, the technical parameters applied have their own influence, as higher mixing temperature results in lower viscosity whereas longer mixing time length leads to higher viscosity of the meat compositions.
0.00 0.50 1.00 1.50 2.00 2.50 3.00 3.50
1.00 2.00 3.00 4.00 5.00 6.00 10.00 12.00
Revolutions,[rot/m in]
V
is
c
o
s
it
y
*0
.0
0
1
,[
P
a
s
] A1
Bibliography
1. Amarfi, Rodica (1989)- Fenomene de transfer. Universitatea Dunărea de Jos, GalaŃi
2. Banu,C.coord. (2002)- Calitatea şi controlul calităŃii produselor alimentare.Editura Agir, Bucureşti
3. Diaconu,N. ş.a.(2003)- Bazele reologiei, Editura Evrika, Brăila
4. Geană,M. ş.a.(1993)- ProprietăŃile fizice ale fluidelor.Metode de calcul. Editura Tehnica, Bucureşti
5. Muller,H.G. (1973)- An introduction to food rheology, London