Hungarian Association of Agricultural Informatics European Federation for Information Technology in Agriculture, Food and the Environment
Journal of Agricultural Informatics. Vol. 7, No. 2 journal.magisz.org
Data Quality and Information Validity – the Case of the Negative Prognosis
Plant Protection Model
Andrzej Stanisław Zaliwski1, Anna Nieróbca2
I N F O
Received 05 May 2016 Accepted 01 Aug. 2016 Available on-line 15 Aug. 2016 Responsible Editor: M-Herdon
Keywords:
negative prognosis, plant protection model, data quality, information quality.
A B S T R A C T
The Negative Prognosis model (NPM) is a meteorological plant protection model that has been used in the farming practice for a long time now for controlling potato late blight, caused by Phytophthora infestans. NPM takes hourly air temperature, relative humidity (RH) and precipitation sums as input, generating recommendations on the first protective treatment date. The objective of the present work was to determine the impact of weather data quality on the NPM recommendations quality. Sensitivity analysis was conducted through inspection of source code and simulation. Data for simulation were prepared so as to measure a possible delay of the recommended date of the first treatment. Simulation experiments were performed to assess the recommendations quality for the direct-measurement data and the prepared data. It was established that the recommendations depend on the measurement precision of the RH near the value of 87% and the air temperature near the values of 10, 12, 14, 16, 18 and 24 °C. The decisive factor is RH measurement precision. Small variations of RH of 2–3% may cause a serious miscalculation of the recommended date of the first treatment of 8-11 days.
1. Introduction
Farming is one of those domains, in which decisions are made routinely based on the intuition. Yet, due to globalization, the circle of producers using comparable production technologies and offering similar products is growing continually. Consequently, competitive advantage can be achieved nowadays more easily through peak performance ensured by wise decisions than through technology improvement. Better decisions can arise from comprehensive information coming from data analysis (Davenport & Harris 2010). On the other hand, the analytical methods are justified only if they can bring about a significant upturn of the decision efficiency, which cannot be achieved without quality assurance of the data. High quality data have to be used in order to produce high quality information essential for thorough understanding of the decision situation. Basing the decisions on facts allows for the optimization of actions to maximize competitive advantage.
One the most common decision situations in farming is determining the need for a protection treatment. Yet, these decisions can be very demanding if the principles of the integrated pest management (IPM) are to be followed as stated in the EC 1107/2009 regulation (Regulation (EC) No 1107/2009). The rational selection of a plant protection product has to be preceded by a thorough analysis of the crop cultivation status. In the analysis numerous factors should be considered like crop variety disease resistance, host and pest developmental phases, source of inocula, infection abundance, weather conditions, pesticide properties, applied pesticide rotation based on different action modes, presence of resistant pest forms, etc. The necessity to take numerous factors into consideration makes the IPM difficult to apply in practice, especially so if a simultaneous protection against a number of
1Andrzej Stanisław Zaliwski
Department of Agrometeorology and Applied Informatics, Institute of Soil Science and Plant Cultivation – State
Research Institute, ul. Czartoryskich 8, 24-100 Puławy, Poland
2Anna Nieróbca
Department of Agrometeorology and Applied Informatics, Institute of Soil Science and Plant Cultivation – State
Research Institute, ul. Czartoryskich 8, 24-100 Puławy, Poland
diseases is required. This is one of the reasons that decision support systems (DSS) are being used more and more universally on farm to facilitate decision making in plant protection.
Figure 1. Production of potato in Poland in the years 1961-2014 [Mt]. Record production (over 50 Mt) marked by bars of brown colour. Source of data: Faostat 2016.
In Poland one of the staple crops is the potato. The production of potatoes achieved in 1963-1990 stood Poland in second place after the Soviet Union (Faostat 2016), but in the later years it began to wane considerably (Figure 1). However, with around 750 000 farms growing potatoes in Poland still it is an important crop (Nowacki 2014).
Vegetative propagation of potato is the cause of particular exposure to diseases, the most serious of which is potato late blight. The causal agent of late blight is Phytophthora infestans, an Oomycete of a worldwide distribution (Henfling 1987, Fry 1998, Mizubuti & Fry 2006, Kapsa 2011b). Its prevalence and variability entails a problem not solved even to date. According to CIP Annual Report (1997), yield losses due to late blight are estimated at 15% throughout the world. In growing season, the disease incidence and development are especially intensified by lengthy spells of precipitation and elevated air humidity accompanied by moderate temperature. At temperature around 20 °C the potato field might be damaged totally in just a few days (Kapsa 2011b). The most effective management strategy of late blight combines three procedures: removing pathogen sources, using resistant cultivars and applying appropriate programme of chemical protection. The efficacy of chemical protection is determined by three major factors: date of starting the protection (date of the first treatment), dates of subsequent treatments and the selection of fungicides in order to match their mode of action to the field conditions. Chemical protection against late blight may consist in routine, intensive application of fungicides in the growing season, starting with potato emergence. However, going by the recommendations of the DSS is far more cost-effective. For instance, Kapsa, Bernat & Kasprzak (2007) report a 33% reduction of the number of protective treatments when aided by the NegFry DSS in comparison to the routine application of fungicides. With regard to the date of the first treatment, the practice shows that the farmers who apply fungicides routinely start the protection either too early, which exacerbates its effectiveness, or too late, risking penetration of the pathogen into the plant tissues (Rysak 2009). Conformance to the DSS recommendations improves discipline in regard to the treatment date and reins in the risk.
(Negative Prognosis 2015), since it requires a minimal contribution from the user in terms of data input. On the other hand, it is data-intensive on part of the provider of the system. Additionally, since the only source of information for generating recommendations is the weather data (apart from potato emergence date supplied by the user), the dependence of the information quality on the data quality is very tight.
The name of the application, “Negative Prognosis”, is derived from the name of the Negative Prognosis Model (2015), which it implements. The model is a meteorological plant protection model that has been used in the farming practice for a long time now for forecasting the date of the first protection treatment in controlling potato late blight (Schrödter & Ullrich 1967, Schöber 1992, Hardwick 2006). The most common way of potato late blight control is applications of fungicide treatments. Fungicides should be applied before the infection can occur, otherwise their efficacy is diminished (Nærstad et al. 2008).
2. Materials and methods
As a rule, the quality of information is determined with regard to decision situations of users. It is essential therefore to develop criteria for assessing the information quality with reference to its use (Redman & Godfrey 1997). In our case the information quality is reflected in the soundness of recommendations.
The Negative Prognosis Model utilizes the dependence of late blight epidemic development on weather conditions. It takes as input hourly weather data: air temperature, relative humidity and precipitation. The model calculates for each day (starting with the date of potato emergence) daily risk values (DRV) and accumulated risk values (ARV) - sum of daily risk values. The recommendation of the first treatment is generated when the DRV exceeds 7 points, while the ARV is over 130 points. These thresholds were adopted in the Polish IPM DSS (Kapsa 2011a). The algorithm for DRV calculation takes into account asexual reproduction of Phytophthora infestans. Different stages of reproduction require different weather conditions, which the model algorithm takers into account. Germination of sporangia requires a minimum of 4 consecutive hours with high relative humidity (over “the high humidity threshold” assumed to be 87% in the Polish IPM DSS) and temperature 10-24 °C. Production of spores (sporulation) requires a minimum of 10 consecutive hours with high relative humidity at temperature 10-24 °C.
Figure 2. Results of the calculation of the first treatment date conducted with the aid of 'NegFry online' (fragment of risk values table)
Figure 3. Accumulated risk values (ARV), 'NegFry online' (Negative Prognosis graph). Green and orange horizontal lines correspond to the values in Figure 2.
German Information System for Integrated Plant Production (ISIP), where the computer program AgmedaWin is used (Keil & Kleinhenz 2007).
Intensive use of the 'editweatherdb' editor which began in 2014 showed some gaps in the data and also a number of vague (imprecise) data. This raised the question how well the Negative Prognosis Model can cope with the problem of data quality – what is the impact of weather data quality on the recommendations validity.
In order to find an answer to this question a sensitivity analysis was carried out on the Negative Prognosis model. A sensitivity analysis is generally made in order to reveal how model parameters influence its results (Hamby 1994, Turner et al. 2001). There exist a number of methods to study model sensitivity. In general, the criteria for selecting the method are the usefulness of results and the ease of calculation (Hamby 1994). For the purpose of the present paper the method was proposed based on the analysis of the NPM2 source code (Zaliwski 2015) and the measurement tolerance of RH sensors installed in the IUNG-PIB’s agrometeorological stations. The Negative Prognosis model source code was analysed in order to pick out the weather data thresholds for risk values calculation. Model results computation depends on the comparison of these thresholds with the weather element values (Zaliwski 2010, Negative Prognosis Model 2015). In accordance with the proposed method of sensitivity analysis data sets were prepared and simulation experiments were conducted on the model. The results obtained made it possible to gain an insight into the model requirements in terms of weather data quality.
2.1. Source code analysis
'NegFry online' is patterned after NegFry 2002, written in C++ by Poul Lassen (2003). It is written in C#, in ASP.Net environment. Analysis of the code included inspection of the source, as well as running the application in the debugging mode in order to check the values of variables. These tasks were conducted using Microsoft Visual C# 2008 Express Edition and Microsoft Visual Web Developer 2008 Express Edition (Microsoft Visual Studio 2008).
2.2. Simulations on specially prepared and direct-measurement data sets
Simulation experiments were conducted in order to obtain information how NPM results are influenced by imprecise RH measurements. Nieróbca (2014) reported that the RH measurement error of worn out sensors may be as high as 5%. However, the measurement tolerance range of RH sensors of the type used in the IUNG PIB’s agrometeorological stations is ±3%. The measurement tolerance range of temperature sensors is ±0.1°C. This information, together with the findings of the code analysis, served as a hint to determine how to prepare the weather data for the simulation experiments.
To avoid “messing around” in the 'NegFry online' system, an additional station was added to the Central Weather Module and named 'NPM Testing'. Then all the experiments were performed only on that station. The original data (from 2014) were taken from two of the IUNG–PIB’s agrometeorological stations. In order to find which two stations to consider, the data of 27 agrometeorological stations were analysed for the period from potato emergence (May 15) to the end of June. The date of potato emergence was established from the results of potato variety trials (COBORU 2006-2012). In the years 2006-2012 the earliest potato planting dates in Poland were between 6-19 April. Since the period from planting to emergence is about one month (Kalbarczyk & Kalbarczyk 2004), the average date of potato emergence was assumed to be 15 May.
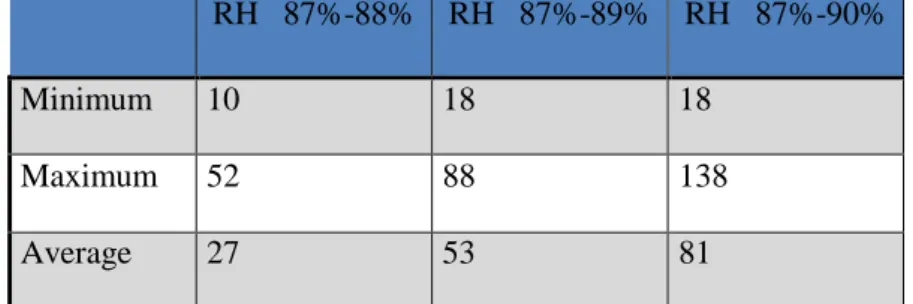
Table 1.Numbers of hours of relative humidity close to threshold 87% in the period from potato emergence (May 15) to the end of June, obtained from 27 stations
RH 87%-88% RH 87%-89% RH 87%-90%
Minimum 10 18 18
Maximum 52 88 138
Average 27 53 81
The data of the two selected stations were than copied (sequentially) to the weather database to create data records for the 'NPM Testing' station. To find a possible influence of the RH measurement errors on the Negative Prognosis model results the RH values above threshold of 87% were changed (also sequentially) to 86.99%, to create a simulated error of 1, 2 and 3%, respectively. This was done in order to create a delay of the first treatment. A preliminary analysis of the prepared datasets was conducted (in a spreadsheet) which showed that only the relative humidity data had to be taken into account when determining a delay of the first treatment. Measurement errors of temperature (±0.1°C) did not exert any influence on the recommendations, since no values equal to the established thresholds for germination of sporangia or sporulation occurred simultaneously with the RH values of 86.99%. The speed-up of the first treatment was not investigated, since it is not so critical to the recommendation quality.
Altogether eight sets of data were produced for the simulation experiments, two original (unchanged) and six prepared. The data preparation was conducted in the Microsoft SQL Server 2008 R2 database using Microsoft SQL Server Management Studio (Mendrala et al. 2009). The 'NegFry online' application was run eight times to get the results, each time with changed input.
3. Results and discussion
The results obtained are of two kinds. Firstly, thresholds for calculation of risk values were determined from the source code analysis. Secondly, model requirements in terms of weather data quality were established in simulation. These two kinds of results are shown separately below.
3.1. Source code analysis results
It has been found that the following conditions for high daily risk values apply:
- temperatures 10-12 °C or 14-16 °C along with relative humidity above threshold 87% for at least 4 consecutive hours (germination of sporangia),
- temperatures 12-14 °C or 18-24 °C along with relative humidity above threshold 87% for at least 10 consecutive hours (sporulation).
The decisive weather data quality factors for Negative Prognosis model are therefore:
- precision of measurements of RH near value of 87%,
- precision of measurements of temperature near values of: 10, 12, 14, 16, 18 and 24 °C.
3.2. Results from simulation experiments
1% did not change the date of the first treatment – the results for original data are the same as for the data with simulated error of 1%.
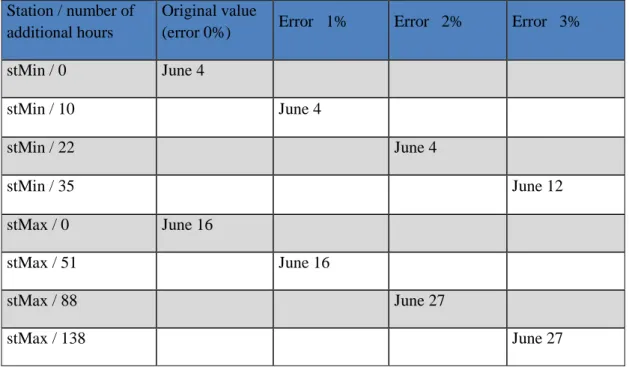
Table 2.Date of first treatment as influenced by simulated RH measurement error of 0%, 1%, 2% and 3% for two stations; stMin, stMax – stations with the lowest and and the highest number of
measurements proximate to threshold of 87% Station / number of
additional hours
Original value
(error 0%) Error 1% Error 2% Error 3%
stMin / 0 June 4
stMin / 10 June 4
stMin / 22 June 4
stMin / 35 June 12
stMax / 0 June 16
stMax / 51 June 16
stMax / 88 June 27
stMax / 138 June 27
However, error of 2% and 3% changed the date of the first treatment by 8 days and 11 days, respectively. Generally, the date of the first treatment is likely to be the more delayed the less high RH values (i.e. values between 87-100%) are input in the NPM model. This is because from less numerous high RH values lower daily risk values are likely to be computed. And then the accumulated risk values grow slower and the treatment is delayed. Station stMax had 289 high RH values compared to station stMin with 459 high RH values. That difference resulted in a delay of the first treatment date equal to 12 days (June 4 and June 16 in the column “Original value” in Table 2). These result are consistent with the findings of the source code analysis, because the less numerous high RH values are, the less the likelihood of occurrence of continuous series of 4 and 10 consecutive high RH values is.
The results obtained in the simulation experiments, i.e. the possible delays of the first treatment date, compare well with the results achieved by Nieróbca (2014). She investigated two RH sensors: a new one and a worn-out one and showed that for a 5% RH error the delay can be as many as 17 days. In the present study the RH error was less (i.e. 2-3%) and consequently the delay was less (8-11 days).
4. Conlusions
From the simulation results it follows that a repeated error falling within the range of an RH sensor measurement tolerance (2-3%) may cause a serious delay of the date of the first treatment recommended by the Negative Prognosis model. The delay established in the simulation experiments was 8-11 days. These results correlate well with the results achieved by Nieróbca (2014), who compared a new RH sensor with worn-out one and showed the delay can be as many as 17 days.
stated that the present study results give a justification to the decision made at the IPM DSS deployment.
Notwithstanding all that, missing data and measuring errors do occur, and high data quality must be a priority consideration in the DSS implementation.
Acknowledgments
Study was supported and financed from project 4.1 of the Multi-year Research Program of IUNG-PIB.
References
CIP, 1997, The International Potato Center Annual Report1996. Available from: <http://pdf.usaid.gov/pdf_docs/pnacd208.pdf>. [18 May 2015].
COBORU, 2006-2012, Results of the post-registration variety trials – Potato (in Polish), vol. 43, 51, 63, 68, 77, 84 & 94. COBORU, Słupia Wielka.
Davenport, TH & Harris, JG 2010, Competing on Analytics: The New Science of Winning (in Polish), trans. A Sobolewska, MT Biznes, www.mtbiznes.pl. ISBN: 978-83-61732-37-2.
Faostat, 2016. Available from: <http://faostat3.fao.org>. [15 July 2016].
Fry, WE, 1998, Late Blight of Potatoes and Tomatoes. Available from:
<http://vegetablemdonline.ppath.cornell.edu/factsheets/Potato_LateBlt.htm>. [18 May 2015].
Hamby, DM 1994, 'A review of techniques for parameter sensitivity analysis of environmental models', Environmental Monitoring and Assessment, vol. 32, no. 2, pp. 135-154. doi: 10.1007/BF00547132
Hardwick, NV 2006, 'Disease forecasting' in The Epidemiology of Plant Diseases, 2nd edn, eds BM Cooke, D Gareth Jones & B Kaye, Springer, Dordrecht, The Netherlands, pp. 239-267. doi: 10.1007/1-4020-4581-6_9
Henfling, JW 1987, Late blight of potato: Phytophthora infestans, 2nd edn, Technical Information Bulletin 4, International Potato Center, Lima, Peru.
IPM-DSS, 2015, Internet decision support system in the integrated plant protection (in Polish). Available from: <http://www.ipm.iung.pulawy.pl >. [13 May 2015].
Kapsa, J 2011a, 'Decision support systems used in plant protection' (in Polish), Wieś Jutra, year 2011, no. 1/2, pp. 1-3.
Kapsa, J 2011b, 'The problem of protecting potato fields against late blight in Poland' (in Polish), Ziemniak Polski, year 2011, no. 3, pp. 23-29.
Kapsa, J, Bernat, E & Kasprzak, M 2007, 'The usefulness of NegFry decision support system in potato protection against late blight under different meteorological conditions' (in Polish), Biuletyn IHAR, vol. XXVII, no. 2, pp. 307-313.
Keil, B & Kleinhenz, B 2007, 'AgmedaWin – a tool for easy and flexible management of meteorological data', Bulletin OEPP/EPPO, vol. 37, pp. 335-338.
Kalbarczyk, E & Kalbarczyk, R 2004, 'Influence of thermal and precipitation conditions on agrophenology of medium early potato in Poland' (in Polish), Acta Agrophysica, 2004, vol. 3(1), pp. 65-74.
Lassen, P 2003, C++ source code of NegFry2002.exe program. Danish Institute of Agricultural Sciences.
Mendrala, D, Potasiński, P, Szeliga, M, Widera, D 2009, SQL Server 2008. Administration and programming (in Polish), Helion, Gliwice. ISBN: 978-83-246-2033-3.
Microsoft Visual Studio 2008 Express Edition, computer software 2008.
Mizubuti, ESG & Fry, WE 2006, 'Potato late blight' in The Epidemiology of Plant Diseases, 2nd edn, eds BM Cooke, DG Jones & B Kaye, Springer, Dordrecht, The Netherlands, pp. 445-471. ISBN: 978-1-4020-4581-3. doi: 10.1007/1-4020-4581-6_17
Negative Prognosis (in Polish), 2015. Available from: <http://www.ipm.iung.pulawy.pl/NegProg/NegProg.asp>. [13 May 2015].
Negative Prognosis Model, 2015. Available from:
<http://www.ipm.ucdavis.edu/DISEASE/DATABASE/potatolateblight.html#ullrich>. [15 April 2015].
NegFry online (in Polish), 2015. Available from: <http://www.ipm.iung.pulawy.pl>. [18 May 2015].
Nieróbca, A 2014, 'Significance of meteorological data quality in decision support systems for plant protection' (in Polish). Paper presented at the 54. Scientific Session IPP-NRI. Poznań, Poland.
Nieróbca, A & Zaliwski, AS 2014, 'Expert systems as a tool for decision support in integrated pest management'.
(in Polish), Inżynieria Rolnicza, vol. 152, no. 4, pp. 185-193.
Nieróbca, A, Zaliwski, AS & Horoszkiewicz – Janka, J 2010, 'The development of an internet decision support system for crop protection' (in Polish), Inżynieria Rolnicza, vol. 125, no. 7, pp. 167-173.
Nowacki , W (ed.) 2014, Methodology of integrated potato production (in Polish), 3rd edn, PIORIN, Warszawa. Available from:
<http://piorin.gov.pl/download/gfx/piorin/pl/defaultstronaopisowa/1328/1/1/ip_ziemniaka_3_ed.pdf>. [15 July 2016].
Redman, TC & Godfrey, AB 1997, Data Quality for the Information Age, Artech House Publishers.
Regulation (EC) No 1107/2009.
Rysak, W, 2009, 'Practical application of decision support system for the potato protection in the Lublin voivodship region' (in Polish), Studia i Raporty IUNG-PIB, vol. 16, pp. 59-68.
Schöber, B 1992, 'Control of late blight, Phytophthora infestans, in integrated crop management', Netherlands Journal of Plant Pathology, vol. 98, Supplement 2, pp. 251-256. doi: 10.1007/BF01974492
Schrödter, H & Ullrich, J 1967, 'A mathematical-statistical solution to the problem of epidemics forecast with the aid of weather parameters, exemplified by potato late blight (Phytophthora infestans) ', Agricultural Meteorology, vol. 4, pp. 119-135. doi: 10.1016/0002-1571(67)90016-7
Turner, MG, Gardner, RH & O’Neill, RV 2001, 'Introduction to Models' in Landscape Ecology in Theory and Practice. Pattern and Process, Springer-Verlag, New York, pp. 47-69. Available from: Springer Link. [22 May 2015].
Zaliwski, AS, 2009, 'Organization of the weather module of the national advisory system in the sustainable crop production' (in Polish), Studia i Raporty IUNG-PIB, vol. 16, pp. 107-117.
Zaliwski, AS, 2010, 'Acquisition and use of weather data in the national system of decision support in plant production' (in Polish), Inżynieria Rolnicza, vol. 123, no. 5, pp. 311-317.
Zaliwski, AS, 2014, 'Back office software of the IPO portal' (in Polish), Studia i Raporty IUNG-PIB, vol. 38(12), pp. 89-114.
![Figure 1. Production of potato in Poland in the years 1961-2014 [Mt]. Record production (over 50 Mt) marked by bars of brown colour](https://thumb-us.123doks.com/thumbv2/123dok_us/8063513.2135506/2.892.132.795.199.462/figure-production-potato-poland-record-production-marked-colour.webp)