Browse Title Index
20
0
0
Full text
(2) Nelza Lynna Abdul Rahim & Abdul Azeez Kadar Hamsa Analysis of Factors Influencing Use of Motorcars in International Islamic University Malaysia. to facilitate walking and cycling on-campus and strict enforcement on the use of illegal motorcars on-campus. Keywords: motorcar, travel mode, travel behaviour, sustainable transport, University campus.. INTRODUCTION The car is popular among commuters because it generally provides high levels of mobility and convenience. As many studies had shown, car ownership and its use have risen rapidly with increased income. The increasing affordability of cars is the most important explanation for the worldwide growth in motorisation in recent decades (Ingram and Liu, 1999, Schafer and Victor, 2000, Downs, 2004). Cars, being one of the means of transport, have significant impact and ability to affect the quality of environment in a place, as in most cases, transport is the main source of pollution (World Bank, 1996). According to Norsyuhadah Norzalwi and Amiruddin Ismail (2011), University campuses can be defined as a small "city" because they commonly have their own communities, typical daily activities such as working, studying, businesses and own independent infrastructure facilities. However, they also experiencing the same problems as major cities are experiencing such as increase in the use of private transport, traffic congestions, noise pollutions, and also environmental problems. The motorization trends in University campuses are also similar with that of cities in terms of high use of private cars (Norsyuhadah Norzalwi and Amiruddin Ismail, 2011). Therefore, a sustainable transportation planning is in great need for University campuses to encourage the use of non-motorized travel modes, public transportation and other sustainable transportation modes in campuses. This research discusses on the analysis of factors affecting use of motorcars as travel mode choice among on-campus University students. Because of the growing number of motorcars on-campus especially by student community, it is imperative to ascertain the likely reasons for the use of motorcars on campus. On-campus student population who own motorcars and travel to Kulliyyah (faculty) from Mahallah (hostel) by their motorcars either regularly or occasionally for attending classes was targeted. Regular users of the motorcars are the individuals who use motorcars all the time of their trips oncampus and occasional users are those who use motorcars only during some time of their trips.. © 2013 by MIP. 140.
(3) PLANNING MALAYSIA: Journal of the Malaysia Institute of Planners (2013). LITERATURE REVIEW ON FACTORS INFLUENCING MOTORCARS AS TRAVEL MODE CHOICE According to Hjorthol (1999) and Forward (1998b), there are several reasons why motorcars are so popular. It is mentioned that the use of motorcar provides a convenient and comfortable way to travel. The driver and passengers can travel undisturbed and feel secure, and a car journey is more time-saving. In addition, the motorcars also have cultural and symbolic values. Jensen (1997) arrives at the conclusion that the motorcar is not only a convenient mode of transport but also satisfies other needs, for example feeling that one is in control of one’s journey. Normal transport-economic models assume that people are rational beings and choose the mode of travel that gives the most benefit. Many researchers, however, had considered that people choose their mode of transport according to their feelings and habits. This manifests itself, in fact, that people do not change their behaviours just because conditions change, for example, improved public transport, since people weigh in more values on feelings and personal habits than time and cost when they choose their mode of transport (Goodwin, 1998 and Ben-Akiva et.al., 1999). Meanwhile, Goodwin (1991) also mentioned that the motorcar is an important part of people’s lives from an early age. Even when they are very young, children learn that the motorcar is a status symbol. It is also considered that taking one’s driving licence as an important ritual in their early age. The motorcar is spotlighted in the films and made to symbolise freedom and strength. The car is implemented early in children’s lives and becomes part of their everyday life together with feed bottles, comforters, and mom and dad. This is why methods of persuasion and other measures in the form of incentives and threats have largely proved ineffectual other than in just a few per cent of cases (Goodwin, 1991). According to Lindström Olsson (2003), the choice of travel mode is affected by many factors, everything from transport-specific factors (describing the various components of the transport system) to individual-related factors such as a person’s attitudes and habits. The choice of travel mode are influenced by the factors such as speed, journey length, comfort, convenience, cost, reliability of alternative modes, the availability of specific travel modes, town size, age, and composition; and the socio-economic status of the persons making the journeys. These factors are classified in many different ways in the literatures (Lindström Olsson, 2003). The measures of competitiveness between. 141. © 2013 by MIP.
(4) Nelza Lynna Abdul Rahim & Abdul Azeez Kadar Hamsa Analysis of Factors Influencing Use of Motorcars in International Islamic University Malaysia. different travel modes are usually derived from an analysis of three sets of factors: a) Characteristics of the journey to be made (length, time of the day the journey is made, purpose of the journey, etc.) b) Characteristics of the persons making the journey (car ownership, income, social standing, gender, age, etc.) c) Characteristics of the transportation system (travel time involved, cost, accessibility, comfort, etc.) Many studies showed that the travel time and cost are crucial to the choice of travel mode and the decision to travel (Algers et al., 1995). Kottenhoff (1999) showed that the level of comfort and services provided by travel modes are also very important. A study in Gothenburg on motorists’ choice of trackbound taxis as a hypothetical travel mode, the car drivers had indicated that the following factors were important: low fare, maximum 300m walking distance, substantial time gain, enjoyable, comfortable, clean, tidy and hygienic. Motorists want short distances to public transport, up to 3 minutes, as compared to public transport passengers who can accept up to 10 minutes walking distance (Loncar-Lucassi, 1998). In an attempt to encourage the use of alternative mode of transport other than motorcars, the University of Bradford applies travel plan to its community in order to reduce not only the amount of traffic but also to promote a wide range of more environment friendly and healthy transport options (University of Bradford Smart Move Travel Plan, 2004-2009). Some of the initiatives that are introduced as part of travel plan at the University of Bradford include: measures to encourage flexible work practices, walking, cycling, greater use of public transport, car sharing and car parking management (University of Bradford Smart Move Travel Plan, 2004-2009). The University of Manchester in UK has recognized the need to ensure the use of sustainable mode of transportation by the University’s population. The University has developed the first Green travel plan initiatives to support its commitment on the use of sustainable transportation modes to address the growing transport and car parking issues (University of Manchester Green Travel Plan, 2006-2011). Some of the significant components in the University’s Green travel plan include: additional facilities for cyclist and pedestrians; introduction of new parking charges to encourage car sharing; further development of the discounted public transport ticketing scheme; producing a student travel plan; and working with city council to integrate the. © 2013 by MIP. 142.
(5) PLANNING MALAYSIA: Journal of the Malaysia Institute of Planners (2013). newly formed cycling routes as part of the public realm into the wider city cycle network (University of Manchester Green Travel Plan, 2006-2011).. BACKGROUND OF STUDY AREA This study was carried out in IIUM Main Campus that is nestled in a valley in the district of Gombak in the state of Selangor. IIUM was selected because of the growing number of motorcar use among the student population. The number of registered cars on-campus has been increasing at 1.8% annually from 2007 to 2010 (Farah Diyanah Ismail et.al. 2012). Additionally, the increase in the use of motorcars by students has been inducing tremendous pressure on the limited road and related infrastructure especially parking both at the Kulliyyahs and Mahallahs The parking spaces at the Kulliyyahs were highly utilized at an average of 83.55% indicating high parking demand (Farah Diyanah Ismail et.al. 2012). IIUM is located approximately 10 kilometres at the north-east direction from Kuala Lumpur at the foot of the Gombak Hillside.The campus is also greatly accessible via Middle Ring Road 2 (MRR2), Karak Highway or via Gombak Road. The University was established on 23rd May 1983. This Garden of Knowledge and Virtue campus covers approximately 700 acres of land area accommodating 17 hostels for students housing or known as Mahallah and 8 faculties or known as Kulliyyah. At present, the University accommodates 2,708 employees (IIUM Management Services Division, 2011) and 15,068 students (IIUM, Security Management Unit, 2012). The campus is also provided with 8,618 parking spaces (IIUM, Security Management Unit, 2012). As of March 2012, there were 1,961 students registered with Security Management Unit for the legal use of motorcars on-campus. According to Security Management Unit, the number of vehicle registration applications among students in the 2011/2012 academic session has decreased by 6.41% from 2010/2011 academic session. It is obviously due to change in policy by the University management allowing only 3rd year students, 4th year students and above to apply for vehicle stickers for the use of motorcars on-campus. However, there was slight increase in the number of vehicle registration application, 0.78% from 2007/2008 to 2008/2009 academic session and 1.27% from 2008/2009 to 2009/2010 academic session. The main buildings that include masjid, administration buildings and Kulliyyahs are placed at the central area and Mahallahs and other facilities for students are located surrounding the main buildings (Refer to Fig. 1). The 143. © 2013 by MIP.
(6) Nelza Lynna Abdul Rahim & Abdul Azeez Kadar Hamsa Analysis of Factors Influencing Use of Motorcars in International Islamic University Malaysia. students of IIUM are free to choose any travel modes that they prefer to go to Kulliyyahs from their Mahallahs for attending classes. The available travel modes for the students within the campus are walking, cycling, public transportation and private vehicle. The campus also provides intra-campus bus services for the IIUM community. However, these services are limited and provided only to those students staying at the selected Mahallahs. LEGENDS. Qibla. Mahallah / Students Housing Kulliyyah & Administration Buildings Water Bodies. Not to Scale. Highway Road Parking. Figure 1: Main Campus of International Islamic University Malaysia Source: www.iium.edu.my. Retrieved March 23, 2012. © 2013 by MIP. 144.
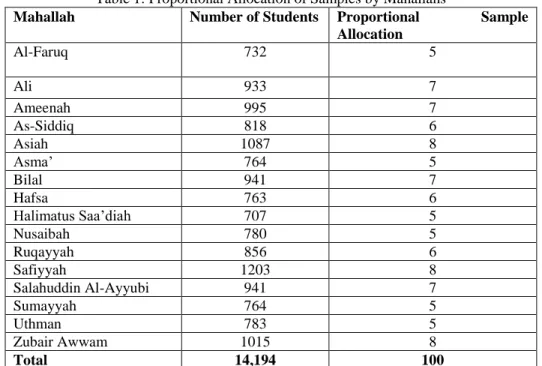
(7) PLANNING MALAYSIA: Journal of the Malaysia Institute of Planners (2013). RESEARCH APPROACH The data for this study was collected by using two data sources, which are primary data and secondary data. The primary data collection methods include self-administered questionnaire survey, observational survey, and structured interview. The secondary data was collected mainly from the related agencies and through other literary sources. The primary and secondary data were then analysed by using analysis methods which include univariate analysis, Relative Importance Index (RII), bivariate and t-test analysis. Data collection A self-administered questionnaire was designed to collect data on "trip-makers" and "trip-making" characteristics and "preference to use motorcars as their main travel mode choice" on-campus. Data on motorcar users’ willingness to travel by sustainable transportation modes such as walking, bicycling and public transport were also collected. Both Revealed-Preference (RP) and Stated Preference (SP) approach were applied to collect data on trips which were made and trips which will be made by using sustainable transportation modes. A self-administered questionnaire survey was conducted targeting 100 on-campus students having immediate access to their motorcars for use oncampus either regularly or occasionally. The targeted population was divided into subpopulations or strata according to Mahallahs (hostel) for the selection of samples. Upon dividing the population into subpopulation, samples were selected from each subpopulation by using stratified random sampling procedures. The sample size from each stratum was selected by using proportional allocation approach. MugoFridah W. (2002) mentioned that, in stratified sampling, a population can be divided into different groups which may be based on some characteristics or variables, and in this research, the population was subdivided according to Mahallahs before selecting samples from each Mahallah. Table 1 shows the proportional allocation of samples by Mahallah. The questionnaire includes three main parts namely "trip-makers characteristics", "trip-making characteristics" and "preference of motorcars as travel mode choice". The frequency of using motorcars, reasons for using motorcars, willingness to shift from using motorcars to walking, cycling and public transport and preferences on the application of measures which encourages to use sustainable mode of transportation are some of the questions asked under the "preference of motorcars as travel mode choice" section.. 145. © 2013 by MIP.
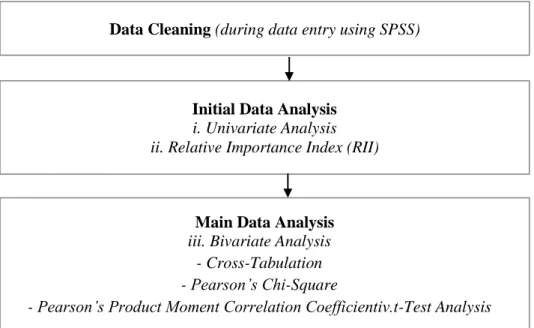
(8) Nelza Lynna Abdul Rahim & Abdul Azeez Kadar Hamsa Analysis of Factors Influencing Use of Motorcars in International Islamic University Malaysia. The students were asked about their willingness to shift from using motorcars to sustainable travel modes and also their preferences on measures that should be taken to induce shift from motorcars to other transportation modes. The preferences of the students on the use of various sustainable transportation modes other than motorcars were measured by using the Likert Scale. The scale used ranges from the “most preferred” to the “least preferred” for the purpose of identifying the measures to allow shift from using motorcars to sustainable travel modes in the future. The other applications of Likert-Scale technique which were used in this study include perceptions of the students on the level of agreement on the use of motorcars on-campus (Colburn, 2003). Table 1: Proportional Allocation of Samples by Mahallahs Number of Students Proportional Allocation 732 5. Mahallah Al-Faruq. Ali Ameenah As-Siddiq Asiah Asma’ Bilal Hafsa Halimatus Saa’diah Nusaibah Ruqayyah Safiyyah Salahuddin Al-Ayyubi Sumayyah Uthman Zubair Awwam Total. 933 995 818 1087 764 941 763 707 780 856 1203 941 764 783 1015 14,194. Sample. 7 7 6 8 5 7 6 5 5 6 8 7 5 5 8 100. Source: Student Affairs and Development Division of IIUM, 2012 & Primary Calculation, 2012. Data analysis This research conducts its analysis in several phases. According to Herman Adèr (2008), data analysis is a process, within which several phases can be distinguished. The phases include data cleaning, initial data analysis and main data analysis. The structure for data analysis which was applied in this research is shown in Figure 2.. © 2013 by MIP. 146.
(9) PLANNING MALAYSIA: Journal of the Malaysia Institute of Planners (2013). Data cleaning was carried out during the data entry stage. It is a procedure in which data were closely inspected and incorrect data were corrected. The guiding principles, as provided by Adèr (2008) are that during subsequent manipulations of the data, it should always be possible to undo any data set alterations. All information and all alterations to the data set were carefully and clearly documented. For this research, the data cleaning and data entry was carried out using SPSS. The initial data analysis describes the collected data in an organized and summarized form. In the main analysis phase, the method of analysis was applied in aiming to answer the research questions. In this research, the methods of analysis which were applied include univariate analysis, bivariate analysis and independent t-test. Data Cleaning (during data entry using SPSS). Initial Data Analysis i. Univariate Analysis ii. Relative Importance Index (RII). Main Data Analysis iii. Bivariate Analysis - Cross-Tabulation - Pearson’s Chi-Square - Pearson’s Product Moment Correlation Coefficientiv.t-Test Analysis Figure 2: Structure of Data Analysis Source: Herman Adèr, 2008 & Primary Survey, 2012. ANALYSIS AND FINDINGS The findings of this research are mainly help to answer research questions and to achieve the goal and objectives of the research. The analyses that were applied in this research include describing single variable, relationships or associations between variables, and finding differences between two groups. 147. © 2013 by MIP.
(10) Nelza Lynna Abdul Rahim & Abdul Azeez Kadar Hamsa Analysis of Factors Influencing Use of Motorcars in International Islamic University Malaysia. within a sample. The summary of the data analysis which was applied in this research includes: . Initial data analysis, describing single variable by using univariate analysis and identifying ranking of the variables using Relative Importance Index (RII) Main data analysis, describing relationships between two variables by using cross-tabulation, finding associations between variables using Pearson’s Chi-Square and Product-Moment Correlation Coefficient and finding differences between two groups in a sample using Independent t-Test. Characteristics of the trip-makers The sample consists of 55% female students and 45% male students. 27% of the students were in the 2nd year and 1st year whereas 63% were in the 3rd year and above. 96% of the total samples were studying bachelor degree programmes and only 4% were in the postgraduate programmes. The average age of the respondents is 23 years. The source of funding to support the students’ degree programmes was found to be mainly from the government scholarship. Characteristics of trip-making About 75% of the samples have registered their vehicles with the IIUM security office. Most of the vehicles (68%) driven on-campus was single occupancy (only the driver). The average delay time being experienced during their trips by motorcars from the Mahallah to the Kulliyyah was 10 minutes (one-way). The choices of travel modes (other than motorcar) available to the students as expressed by the respondents include: 100% walking, 38% public transportation, 19% bicycles and 7% motorcycles. The frequency of using travel modes other than motorcars was generally low among the respondents. Relationship between trip-makers and frequency of using motorcars oncampus The analysis of data using Chi-Square and Person Product Moment Correlation Coefficient has showed that, among the characteristics of trip-makers (gender, source of finance, and year of study), the relationship between “year of study” and “frequency of using motorcars on-campus” was statistically significant both at 95% and 99% confidence interval [Chi-Square value = 13.868; p = 0.008]. However, the Cramer’s V on this relationship only indicates a value of 0.372, a moderate strength of association between these variables. Surprisingly, it was © 2013 by MIP. 148.
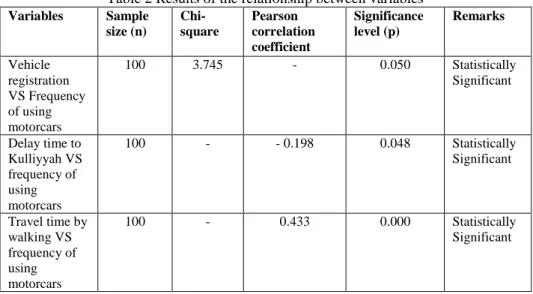
(11) PLANNING MALAYSIA: Journal of the Malaysia Institute of Planners (2013). found that the 1st and 2nd year students were highly dependent on using motorcars for performing activities on-campus regularly. Though 1st and 2nd year students are not allowed to use motorcars on-campus, it can be noted that lack of enforcement, setting precedence by the previous batch students, lack of pedestrian, bicycle and public transport infrastructure are the likely reasons for this trend. This study includes 1st and 2nd year students as samples because of the growing number of these students using motorcars on-campus. Therefore, it can be concluded that “year of study” factor does influences use of motorcars on-campus. The students from lower level of study were highly dependent on motorcars than students from higher level of study. Relationship between trip-making and frequency of using motorcars oncampus This study showed that the vehicle registration status, travel time by walking to Kulliyyah from Mahallah and delay time to Kulliyyah from Mahallah were statistically related with frequency of using motorcars to the Kulliyyah either regularly or occasionally. The chi-square test on the relationship between “vehicle registration status” and “frequency of using motorcars to Kulliyyah” showed a Chi-Square value = 3.745; p = 0.05. Nearly 33% of the regular motorcar users and 16% of the occasional users were not registered their vehicles with the IIUM Security Unit to use their vehicles legally on-campus. The Pearson Product-Moment Correlation on the relationship between “delay time to Kulliyyah” and “frequency of using motorcars” was found to be statistically related [r(98) = -0.198, p = 0.048]. However, the relationship between these variables showed a negative correlation, which indicates as the delay time to the Kulliyyah increases, frequency of using motorcars decreases. Nearly 45% of the respondents who were regular motorcar users to the Kulliyyah were experienced a delay time of 10 to 15 minutes. Nearly 26% of the respondents who were regular motorcar users were experienced no delay during their trips to the Kulliyyah. About 26% of the respondents were experienced a delay time of less than 10 minutes when searching for a parking space near their Kulliyyahs. Only 3.3% of the respondents who are regular motorcar users were experienced a delay time of 15 to 20 minutes.. 149. © 2013 by MIP.
(12) Nelza Lynna Abdul Rahim & Abdul Azeez Kadar Hamsa Analysis of Factors Influencing Use of Motorcars in International Islamic University Malaysia. Table 2 Results of the relationship between variables Variables. Vehicle registration VS Frequency of using motorcars Delay time to Kulliyyah VS frequency of using motorcars Travel time by walking VS frequency of using motorcars. Sample size (n). Chisquare. 100. 3.745. 100. -. 100. -. Pearson correlation coefficient -. Significance level (p). Remarks. 0.050. Statistically Significant. - 0.198. 0.048. Statistically Significant. 0.433. 0.000. Statistically Significant. Legends:. Qibla 1 Mahallah Ruqayyah 2 Mahallah Salahuddin AlAyyubi 3 Mahallah Bilal Not to Scale 4 Mahallah Asiah 5 Mahallah Halimatus Saa’diah 6 Mahallah Nusaibah 7 Mahallah Uthman 8 Mahallah Al-Faruq 9 Mahallah As-Siddiq 10 Mahallah Ali 11 Mahallah Zubair-Awwam 12 Mahallah Ameena 13 Mahallah Asma’ 14 Mahallah Hafsa 15 Mahallah Sumayyah 16 Mahallah Safiyyah A KAED D INSTED B KOE E AIKOL C KICT F KENMS. G KIRKHS. Figure 3: Distance between Origin (indicated in map by numbers) and Destination (indicated in map by alphabets) Source: Google Earth & Primary Survey, 2012 Note: KAED – Kulliyyah of Architecture and Environmental Design; KIRKHS – Kulliyyah of Islamic Revealed Knowledge and Human Science; KOE – Kulliyyah of Engineering; AIKOL – Ahmad Ibrahim Kulliyyah of Laws; KICT – Kulliyyah of Information and Communication Technology; KENMS – Kulliyyah of Economic and Management Sciences; Kulliyyah – Faculty; Mahallah - Hostel. © 2013 by MIP. 150.
(13) PLANNING MALAYSIA: Journal of the Malaysia Institute of Planners (2013). Not surprisingly, the relationship between “travel time to Kulliyyah by walking” and “frequency of using motorcars to Kulliyyah” showed a positive correlation [r(98) = 0.433, p = 0.000]. It showed that as travel time by walking to the Kulliyyah increases, the frequency of using motorcars to Kulliyyah also increases. Nearly 85% of the occasional motorcar users were experienced travel time by walking between 5 and 10 minutes, while, 15.4% of the respondents who use cars occasionally to Kulliyyah were experienced travel time by walking to the Kulliyah between 10 and 15 minutes. Figure 3 shows the covering distances from the Mahallahs to the Kulliyyahs. Table 2 shows the summary of the results of the relationship between trip-making characteristics and frequency of using motorcars on-campus. Factors influencing use of motorcars on-campus The findings showed that 61% of the respondents were relying on motorcars regularly to go to Kulliyyah from Mahallah. Only 39% of respondents were not fully dependent on motorcars to go to Kulliyyah from their Mahallahs because at times they depend on other available travel modes. Using motorcars regularly is defined as respondents being fully dependent on motorcar to go to Kulliyyah from their Mahallah at all time; and occasional use of motorcars to Kulliyyah is defined as respondents are not fully dependent on motorcars at all time and they keep their travel mode choice options open. Of the 39 respondents who were using motorcars occasionally, about 44% of them agreed that they would use motorcars when the day is not busy and when there is plenty of available parking spaces on-campus especially near to their Kulliyyahs. The number of classes that the students need to attend in a day also influences the occasional use of motorcars. It was found that, 33.3% of the 39 respondents would use motorcars when they have more than one class in a day, and 38.5% of the 39 respondents would use motorcars when they have only one class in a day. The remaining 28.2% of them were not influenced at all on the frequency of “attending number of classes” in a day. The level of agreement on the statement of factors influencing the use of motorcars by the respondents was analysed to determine the most likely influencing factors and the least likely influencing factors in using motorcars. The Relative Importance Index (RII) method was applied to rank the factors contributing towards the use of motorcars. Table 3 shows the ranking of each factor. Expectedly, the “comfortable use of motorcars” to perform activities on-campus was ranked as the most important contributing factor for the use of 151. © 2013 by MIP.
(14) Nelza Lynna Abdul Rahim & Abdul Azeez Kadar Hamsa Analysis of Factors Influencing Use of Motorcars in International Islamic University Malaysia. motorcars followed by “convenience” and “travel cost”. The availability of parking spaces at the Kulliyyah, safety of motorcars parked at the Kulliyyah and Mahallah were ranked as the least important contributing factors towards the use of motorcars as expressed by the respondents. Table 3: Factors Influencing the Use of Motorcars On-Campus (n = 100) Statements of Factors More Comfortable More Convenient Reasonable Travel Cost Available Parking at Mahallah More Time-Saving Poor Service of Public Transportation Safe to Travel by Car Available Parking at Kulliyyah Safe to Park Car in Kulliyyah Safe to Park Car in Mahallah. Frequency of Respondents (1)* 0 0 0. (2)* 0 0 1. (3)* 0 0 15. (4)* 21 30 45. (5)* 79 70 39. RII**. Rank. 0.958 0.940 0.844. 1 2 3. 0. 9. 24. 34. 33. 0.782. 4. 0 0. 11 7. 21 27. 38 41. 30 25. 0.774 0.768. 5 6. 4. 12. 36. 26. 22. 0.700. 7. 14. 26. 36. 20. 4. 0.548. 8. 24. 30. 24. 21. 1. 0.490. 9. 22. 33. 28. 14. 3. 0.486. 10. Source: Primary Calculation, 2012 *(5) Extremely Agreeable, (4) Very Agreeable, (3) Fairly Agreeable, (2) Not Very Agreeable, (1) Extremely Not Agreeable **R.I.I= Relative Importance Index. Willingness to shift from motorcars to sustainable travel modes The results showed that 86% of the total respondents were willing to change travel mode choice from motorcars to other travel modes which are more sustainable. Only 14% of the respondents were not willing to change travel mode from motorcars to other travel modes. The measures which could be considered for the change in the travel mode choice, among those who were willing to change travel mode, was also analysed. The reasons for not willing to change travel mode choice is also included in this section. The application of measures for a change in travel modes other than motorcars were analysed by ranking the preferences of the respondents using Relative Importance Index method. Table 4 shows the preferences of the. © 2013 by MIP. 152.
(15) PLANNING MALAYSIA: Journal of the Malaysia Institute of Planners (2013). respondents on the measures to induce a shift from using motorcars to other sustainable travel modes. Table 4 Preferences of the Respondents on the Measures to Shift from Motorcars to Sustainable Travel Modes (n=86) Frequency of Respondents. Statement of Measures Upgraded bus service Improved pedestrian walkway and bicycle path Limited parking space Incentives by the University Strict traffic regulations. RII**. Rank. 0.595. 1. 4. 0.549. 2. 5 13 18. 0.513 0.490 0.488. 3 4 5. (1)* 5. (2)* 7. (3)* 7. (4)* 11. (5)* 7. 15. 9. 1. 7. 3 10 6. 9 7 12. 17 15 10. 15 11 12. Source: Primary Calculation, 2012 *(5) Extremely Preferable, (4) Very Preferable, (3) Fairly Preferable, (2) Not Very Preferable, (1) Extremely Not Preferable **R.I.I= Relative Importance Index. The respondents had expressed that “upgrading existing bus services” was the most important and preferred measures that should be taken to allow a shift from using motorcars to other travel modes. This is followed by “improvement in the pedestrian walkway and bicycle path”, “limiting the number of existing parking spaces”, “incentives by the University” for using sustainable transportation modes and finally implementing “strict traffic regulations” to control the use of motorcars on-campus. The deterrent factors for not willing to make mode choice shift from motorcars to other sustainable travel modes, as expressed by the respondents, is given in table 5. The results showed that the “clear advantages of using motorcars” was the most important deterrents for not willing to make a shift from motorcars to other sustainable travel modes. This is followed by “lack of initiatives by the authorities” to allow a shift to other travel modes, “poor public transportation services”, “preference to drive alone with comfort and privacy” and “poor facilities for walking or bicycling” on-campus. Table 5 Deterrents for not willing to Shift from Motorcars to other Sustainable Travel Modes (n=14) Statements of Deterrents Prefer advantage of using motorcars Not used to using other travel modes Absence of motivation from university. Frequency of Respondents. RII**. Rank. 11. 0.957. 1. 6. 8. 0.914. 2. 7. 7. 0.900. 3. (1)*. (2)*. (3)*. (4)*. (5)*. 0. 0. 0. 3. 0. 0. 0. 0. 0. 0. 153. © 2013 by MIP.
(16) Nelza Lynna Abdul Rahim & Abdul Azeez Kadar Hamsa Analysis of Factors Influencing Use of Motorcars in International Islamic University Malaysia. Poor service of public transportation Prefer to drive alone Uneven topography for walking and cycling Plenty parking in campus Poor facilities for walking and cycling Having disability or illness. 0. 0. 0. 9. 5. 0.871. 4. 2. 2. 1. 5. 4. 0.700. 5. 0. 2. 7. 4. 1. 0.657. 6. 0. 4. 6. 3. 1. 0.614. 7. 0. 5. 7. 2. 0. 0.557. 8. 12. 0. 0. 0. 2. 0.314. 9. Source: Primary Survey, 2012 *(5) Most Likely, (4) Least Likely, (3) Likely, (2) Less Likely, (1) Least Likely **R.I.I= Relative Importance Index. Differences in the level of agreement on factors influencing use of motorcars between regular and occasional users Only “time-saving” factor was found statistically significant, (t-test value = 10.275; p = 0.000) among the factors influencing use of motorcars between regular and occasional users. The other factors were not significant statistically among the factors influencing use of motorcars between regular and occasional users. Due to limitation of space, table 6 shows t-test and significance value of only four factors. It can be concluded that the significant factor which contributes to the use of motorcars to the Kulliyyah from Mahallah is greatly influenced by the “time-saving” factor. The mean values between groups on the “time-saving” factor, where group of respondents who use car regularly has higher means of 4.43 compared to group of respondents who use car occasionally with lower means of 3.00. Furthermore, when comparing mean value of other factors, the regular users of motorcars were normally had higher preferences on the factors such as “safety of trip makers, “available parking at Mahallah” and “safety of cars parked at the Kulliyyah” which prompted them to use motorcars oncampus regularly. Table 6 T-Test on the Factors Influencing Use of Motorcars to Kulliyah between Regular and Occasional Users Time-Saving Parameters. Regular User (n=69). © 2013 by MIP. Safety of Trip Maker. Mean. Std. Devia tion. Mean. Std. Deviati on. 4.43. 0.590. 3.57. 1.040. 154. Available Parking at Mahallah Std. Mean Devia tion 4.02. 1.008. Safety of Car Parked at Kulliyyah Std. Mean Deviati on 3.49. 1.120.
(17) PLANNING MALAYSIA: Journal of the Malaysia Institute of Planners (2013). Occasional User (n=31) t-Test Statistics. 3.00. 0.795. t(98) = 10.275, p = 0.000. 3.38. 1.161. t(98) = 0.847, p = 0.399. 3.74. 0.880. t(98) = 1.385, p = 0.169. 3.38. 1.206. t(98) = 0.453, p = 0.651. Source: Primary Survey, 2012. RECOMMENDATIONS AND CONCLUSIONS In this research, the analysis of Pearson Chi-Square, Pearson Correlation Coefficient and T-Test were applied to determine the significant factors influencing use of motorcars on-campus among students. The significant factors influencing use of motorcars on-campus among students include: . . . Year of study 1st and 2nd year students were found more likely to use motorcars than 3rd year and higher year students Vehicle registration status Those students without vehicle stickers, indicating illegal use of motorcars in campus, were more likely to use motorcars on-campus than students having vehicle stickers. Travel time by walking from Mahallah to Kulliyyah A significant positive correlation between travel time by walking and use of motorcars was noted. Students with higher travel time by walking from Mahallah to Kulliyyah were more likely to use motorcars to the Kulliyyah. Experienced delay time to Kulliyyah A significant negative correlation was found between delay time and use of motorcars to Kulliyyah. It showed that lesser the delay time to Kulliyyah, the higher the dependency on the use of motorcars to Kulliyyah and vice versa.. This research also highlights that the travel time by motorcars was a significant factor that differentiates preference in using motorcars to Kulliyyah between regular and occasional users. It means that the frequency of using motorcars to Kulliyyah either regularly or occasionally depends on how students perceive the amount of time involved when making a trip by motorcars from Mahallah to Kulliyyah. This research also highlights that there is an opportunity, as expressed by the respondents, for shifting from motorcars to sustainable travel modes. Only 16% of the respondents were not willing to shift from motorcars to other 155. © 2013 by MIP.
(18) Nelza Lynna Abdul Rahim & Abdul Azeez Kadar Hamsa Analysis of Factors Influencing Use of Motorcars in International Islamic University Malaysia. sustainable travel modes. The reasons being due to the theory of utility maximisation where they prefer greater benefits from their trips, for example travel time, the fare, the level of comfort and ease of accessibility offered by motorcars (DzikanKottenhoff and Lindström Olsson, 2003). The other reasons cited include: not familiar to use other travel modes and absence of motivational initatives by the authority concerned to indulge in the mode shift. On the other hand, 86% of the respondents were willing to indulge in the mode shift from motorcars to other sustainable travel modes, if measures such as upgrading bus services on-campus and improving facilities and infrastructure for walking and cycling are implemented.. REFERENCES Adèr, H.J. (2008). Chapter 14: Phases and initial steps in data analysis. In H.J. Adèr & G.J. Mellenbergh (Eds.) (with contributions by D.J. Hand), Advising on Research Methods: A consultant's companion (pp. 333–356). Huizen, the Netherlands: Johannes van Kessel Publishing. Algers, S. Hugosson, B &Lindqvist Dillén,J. (1995). Swedish value of time study in 1994.Transek, Stockholm. Ben-Akiva, Walker, M., Bernardino, J., Gopinath, A.T., Morikawa, T. and Polydoropoulou (1999). An Integration of Choice and Latent Variable Models, In Mahmassani, H. (ed.) Perpetual Motion: Travel Behavior Research Opportunities and Application Challenges. Colburn, A. (2003). The Lingo of Learning: 88 Education Terms every Science Teacher Should Know. United States: National Science Teachers Association Press. Downs, A. (2004). Still Stuck in Traffic. Brookings Institution Press, Washington, D.C. Dzikan, K. & Olsson, L. (2003).Factors that Influence Choice of Travel Mode in Major Urban Area.Department of Infrastructure and Planning and division of Transportation and Logistics at the Royal Institute of Technology.ISSN 1651-0216. Farah Diyanah Ismail, Abdul Azeez Kadar Hamsa and Mansor Ibrahim (2012). Analysis of Factors Influencing the Stated Preference of Academic Employees towards Telecommuting in IIUM Campus, Gombak, Planning Malaysia – Journal of the Malaysian Institute of Planners, Vol. 10. pp. 4166. Forward, S. E. (1998b). Modes of Transport On Short Journeys: Attitudes and Behaviour of the Inhabitants of Gothenburg. Report 437, Swedish Road and Transport Research institute, Linköping; Sweden.. © 2013 by MIP. 156.
(19) PLANNING MALAYSIA: Journal of the Malaysia Institute of Planners (2013). Gilbert, R. & Tanguay, H. (2000).Brief Review of Some Relevant Worldwide Activity and Development of an Initial Long List of Indicators. Sustainable Transportation Performance Indicators (STPI) Project, Center for Sustainable Transportation (CST), Toronto. Goodwin, P. (1998). The End of Equilibrium, In Garling, T., Laitila, T. and Westin, K. (eds.) Theoretical Foundation of Travel Choice Modeling, Elsevier Science Ltd. UK. Goodwin, P. Hallett, S. Kenny, F. and Stokes, G. (1991).Transport: The new realism. TransportStudies Unit, University of Oxford, UK. Grue, B. & Hoelsaeter, A. (2000).Park-and-Ride and Bike-and-Ride: Factors that Influence the Access Mode Choice to Railway Stations in the Oslo Area. Report # TOI-1159, Oslo, Norway. Hjorthol, R. J. (1999).Women'sand Men'sPerceptionof TransportProperties AndSymbolic Value. SociologiskTidskrift, Vol. 7 No. 2. Hydén, C. & Nilsson, A. &Risser, R. (1998). WALCYNG - How to enhance WALking and CYcliNG instead of shorter car trips and to make these modes safer. Final Report.Department of Traffic Planning and Engineering, University of Lund, Sweden. Ingram, K.G. and Z. Liu.(1999). Determinants of Motorization and Road Provision.The World Bank, Washington D.C. Jensen, M. (1997) The Need to Drive a Car, paper for The Oslo Research Conference: Society, Environment, and Sustainability. Kottenhoff, K. (1999). Evaluation of Passenger Train Concepts. Methods and Results Of Measuring Travellers Preferences in Relation To Costs. KTH TRITA-IP FR 99-58. Stockholm. Laerd Statistics. www.laerdstatistics.com. Loncar-Lucassi, V. M. (1998). Railvs.bus?Softfactors ontravelertransportationchoices.KFB-Meddelande 1998:1, Stockholm. Louviere, J., D. Hensher and J. Swait (2000), Stated Choice Methods: Analysis and Applications, Cambridge University Press, New York. Meead Saberi Kalaee, Mohammad Reza Rezaeian, Mohammad Reza Ahadi, & Gholam Ali Shafabakhsh.(2009). Evaluating the Factors Affecting Student Travel Mode Choice.Retrieved from www.trforum.org/forum/.../2009_21_TravelModeChoice_paper.pdf. MugoFridah W. (2002).Sampling in Research.Retrieved from: http://www.indiana.edu/ ~educy520/sec5982/week_2/mugo02sampling.pdf. Norsyuhadah Norzalwi & Amiruddin Ismail. (2011). Public Approach Towards Sustainable Transportation in UKM's Campus. Australian Journal of Basic and Applied Sciences, 5(5): 1332-1337.. 157. © 2013 by MIP.
(20) Nelza Lynna Abdul Rahim & Abdul Azeez Kadar Hamsa Analysis of Factors Influencing Use of Motorcars in International Islamic University Malaysia. RAC.(1994). Car Dependence.ESRC Transport Studies Unit. UK: University of Oxford. Schaefer, K. and Sclar, E. (1980).Access for All: Transportation and Urban Growth. Columbia University Press, NewYork. University of Bradford. (2004).SMART MOVE Travel Plan 2004-2009. Retrieved from: http://www.brad.ac.uk/admin/ecoversity/travel/TravelPlan.pdf.Retrieved on April, 5, 2012. Webster, M. (1985).Webster`SNith New Collegiate Dictionary.Meriam Webster Inc. Yamane, Taro. (1967). Statistics, An Introductory Analysis. 2nd Ed. NY: Harper and Row.. © 2013 by MIP. 158.
(21)
Figure

+4


Related documents
Various research studies displayed the existence of a strong positive correlation between professors’ previous computer experiences and their attitudes regarding the
Automatic Dependent Surveillance-Broadcast (ADS-B) system system flight test: Supporting NASA’s Unmanned Aircraft Systems Integration in the National Air Space (UAS-NAS) Project
Off eastern Newfoundland, the depth-averaged ocean temperature ranged from a record low during 1991 (high NAO index in preceding winter), a near record high in 1996 (following
Základním úkolem této diplomové práce bylo navrhnout vestavěné zařízení pro řízení velkoplošného maticového autonomního LED displeje včetně návrhu koncepce
Generic classifi cation, due to its clarity, allows to improve management processes from the point of view of building internal organization and taking all kinds of on-going
Some proposed building a new freight station close to the port to form a competitive industrial complex, while others planned to transfer the passenger station into the heart of the
Increasing the number of lags in the covariance matrix does not alter parameter estimates statistically, but allows to obtain, in a few cases, significant effects for the
Bulletin THE CHAMBER OF COMMERCE AND INDUSTRY OF ROMANIA Internal Relations Division and ICC Romania – Business Information Office... of
