VOLUME 16 ISSUE 1 (2018), Page 281 – 293
HUMAN INTERDEPENDENCY FOR SUSTAINABLE WELL-BEING: STRUCTURAL INVARIANCE ACROSS SETTLEMENT AREAS
Aisyah Abu Bakar1, Mariana Mohamed Osman2, Syahriah Bachok3, Mizan Hitam4, & Alias Abdullah5
1,2,3,4,5
Kulliyyah of Architecture and Environmental Design, INTERNATIONAL ISLAMIC UNIVERSITY MALAYSIA
Abstract
This survey research examined the underlying structure of subjective sustainable well-being (SSWB) discovered in the relationships of (i) Human Interdependence with other Humans (HIH), (ii) Human Interdependence with the Environment (HIE), and (iii) subjective well-being (SWB). The objectives of the empirical analysis were (i) to assess the causal relationship between human interdependence and SWB which instituted the SSWB structural model, and (ii) to evaluate the settlement areas-invariant of the causal structure of SSWB. The data was collected from self-reported questionnaires administered to 4315 working Malaysians. The findings of the structural equation modelling supported the adequacy of SSWB. The results also found that settlement areas, in particular the urban, sub-urban and rural areas, appeared to moderate the structural relationships of SSWB.
INTRODUCTION
An increasing number of studies in the growing movement of positive psychology discovered new and potent determinants of subjective sustainable well-being [SSWB], called human interdependency. Human interdependence focuses on the change in one’s well-being that is reciprocal to the change in others’ well-being due to one’s contribution. In return, the contribution that one’s intentionally or unintentionally imparted to others positively influence one’s subjective well-being [SWB]. Two recognized contexts of human interdependency are (i) human interdependence with other humans [HIH] and (ii) human interdependence with the environment [HIE]. Based on extensive literature reviews, there were four HIH dimensions and four HIE dimensions (Table 1). The structural model of SSWB was represented in the causal structure between human interdependency and SWB. This research also intends to examine the differences in causal effects of human interdependency on SWB across urban, suburban and rural areas in Malaysia.
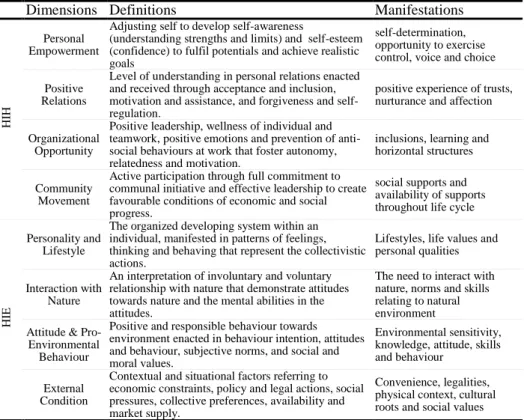
Table 1: HIH and HIE dimensions: Definitions and manifestations Dimensions Definitions Manifestations
HIH
Personal Empowerment
Adjusting self to develop self-awareness
(understanding strengths and limits) and self-esteem (confidence) to fulfil potentials and achieve realistic goals
self-determination, opportunity to exercise control, voice and choice Positive
Relations
Level of understanding in personal relations enacted and received through acceptance and inclusion, motivation and assistance, and forgiveness and self-regulation.
positive experience of trusts, nurturance and affection
Organizational Opportunity
Positive leadership, wellness of individual and teamwork, positive emotions and prevention of anti-social behaviours at work that foster autonomy, relatedness and motivation.
inclusions, learning and horizontal structures
Community Movement
Active participation through full commitment to communal initiative and effective leadership to create favourable conditions of economic and social progress.
social supports and availability of supports throughout life cycle
HIE
Personality and Lifestyle
The organized developing system within an individual, manifested in patterns of feelings, thinking and behaving that represent the collectivistic actions.
Lifestyles, life values and personal qualities
Interaction with Nature
An interpretation of involuntary and voluntary relationship with nature that demonstrate attitudes towards nature and the mental abilities in the attitudes.
The need to interact with nature, norms and skills relating to natural environment Attitude &
Pro-Environmental Behaviour
Positive and responsible behaviour towards environment enacted in behaviour intention, attitudes and behaviour, subjective norms, and social and moral values.
Environmental sensitivity, knowledge, attitude, skills and behaviour
External Condition
Contextual and situational factors referring to economic constraints, policy and legal actions, social pressures, collective preferences, availability and market supply.
Convenience, legalities, physical context, cultural roots and social values
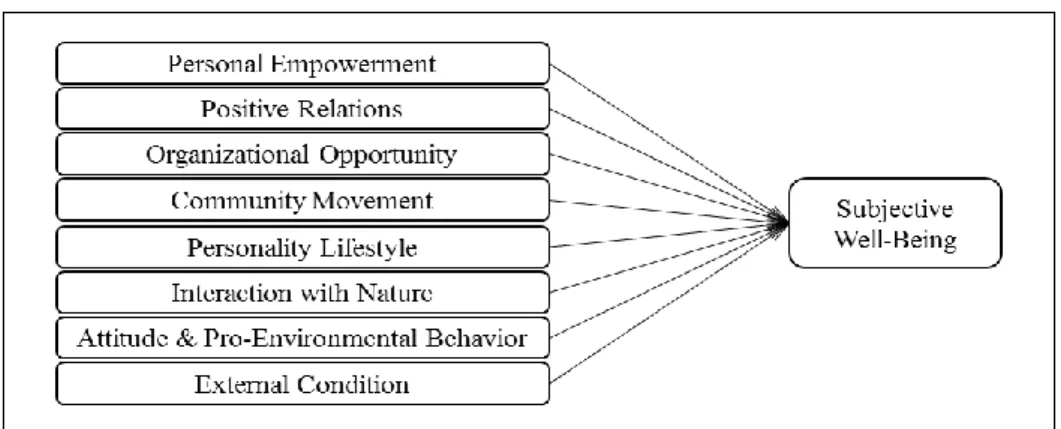
Figure 1: Theoretical framework of SSWB
Based on theoretical underpinnings, the research hypotheses were posed:
H1 SSWB was a multidimensional construct comprising of nine interrelated constructs H2 The measure of multidimensional SSWB is construct-valid
H3 Human interdependence has a direct and positive causal effect on SWB
H4 Settlement areas (urban, sub-urban and rural areas) significantly moderate the relationship between human interdependence and SWB
METHOD
The data collection method employed for the research was survey questionnaires. Structural Equation Modelling [SEM] was used to analyse the causal effects of HIH and HIE on SWB.
Sample
A survey questionnaire was conducted across Malaysia from December 2015 to February 2016, targeting at working Malaysians aged from 18 to 65 years old. Originally, the samples totalled to 4450. After data screening process, 135 samples were omitted. The minimum samples for the analysis procedures was satisfied, with final sample of 4315, providing a ratio over 40 cases per variable.
earned below RM 3,000, while the rest of the respondents earned between RM 3,000 to RM 7,000 (41.7%) and over RM 7,000 (18.7%).
Measures
The survey was a self-reported 100-item questionnaire measuring HIH, HIE and SWB. Respondents rate their level of HIH, HIE and SWB on 11-point Likert Scale measures. Twenty of the items measure the SWB. The SWB items were selected from the Satisfaction with Life Surveys [SWLS] (Pavot & Diener, 2008), the Flourishing Scale [FS] (Diener et al., 2009) and the Questionnaire for Eudaimonic Well-Being [QEWB] (Waterman et al., 2010). The remaining 80 items were primarily drawn from extensive literature review, and were used on previous studies concerning HIH (40 items), and HIE (40 items). As such the items had been empirically tested prior to being selected for the study. Every HIH and HIE dimensions were measured by 10 items. The dimensions were (i) personal empowerment (PE), (ii) positive relations (PR), (iii) organizational opportunity (OO), (iv) community movement (CM), (v) personality and lifestyle (PL), (vi) interaction with nature (IN), (vii) attitude and pro-environmental behaviour (AP), and (viii) external condition (EC). Table 2 displays examples of self-reported items from each dimension of HIH and HIE.
Table 2: Examples of self-reported items for each HIH and HIE Dimensions
Examples of Self-Reported Items
PE
‘I would still work hard to achieve the easy goals in life’, ‘I work hard to make sure that people are comfortable with me’, and ‘I tackled problems efficiently in unexpected conditions’.
PR
‘I am aware and eager to know how others are doing in their lives’, ‘I make sure others are engaged in decision making processes’, and ‘I am conscious when I make mistakes and quickly apologize’.
OO
‘I clearly understand the tasks and my role at work’, ‘Ideas and suggestions by my co-workers are valuable to me’, and ‘I willingly share my skills and knowledge with my co-workers’.
CM ‘I actively participate in the organized activities’, ‘I usually take a short time to adjust to new social environment’, and ‘I can influence the decision made by the community’ PL
‘Good relationships are important than personal achievement’, ‘I do not mind if I cannot afford to buy the things I like’, and ‘I always think about the destruction we are doing to the environment’.
IN
‘My health and well-being depends on the outdoor environment that I live in’, ‘I can see and hear what others usually miss in the natural environment’, and ‘I spend time planting at home’.
AP
‘I turn off taps when I brush my teeth’, ‘I separate rubbish at home (plastics, cans, papers, etc)’, and
‘I purchase products that are organically grown produce’.
EC
‘My family cherish pro-environmental behaviours’, ‘The price of environmental-friendly products are affordable’, and ‘The civic amenities functions favourably in maintaining conducive environment’.
ANALYSIS
Exploratory Factor Analysis
Principal Axis Factoring with Promax rotation were conducted to explore the underlying structure of the responses. Due to large sample size and number of items, multiple EFA procedures were undertaken to carefully examine the underlying factor structure of the 100 items. Factoring the optimum number of factors involved two-step attempts. In the first attempt, the EFA was generated separately for each dimension of HIH and HIE as well as SWB using force-factor extraction method. The EFA yielded three factors for each HIH and HIE dimensions and six factors for SWB. The second attempt generated an EFA solution for all 100 items. Thirty factors were extracted and items loaded on their strongest affiliated factors (loadings >.6) reflecting the first step. Scree test was generated and the scree plot supported the extracted nine second-order factors (eigenvalue > 2.0) and the extracted 30 first-order factors (eigenvalue >.6). The 30-factor solution achieved convergent validity (x̅ loadings > .7) and discriminant validity (inter-factor correlations < .7) at the EFA stage. The thirty factor structure solution achieved factorability requirements (2 (4950) = 389404.645, p =.001,
KMO Measure of Sampling Adequacy =.975). The R-matrix indicated for each item, there were no less than 10 items correlated at least .3, and none of the correlations were above .9, indicating reasonable factorability of all items and that items were not largely subjected to multicollinearity. The diagonals of the anti-image were over .5, justifying the inclusion of all 100 items in the EFA. The communalities were between .4 and .8. The total common variance shared was 75.67%. The EFA output showed that (i) there were common variances shared between items, (ii) none of the items were outliers, and (iii) statistically interpretable factors were extracted.
Confirmatory Factor Analysis
free parameters (covariate errors) based on modification indices was not subjected to the mentioned issues.
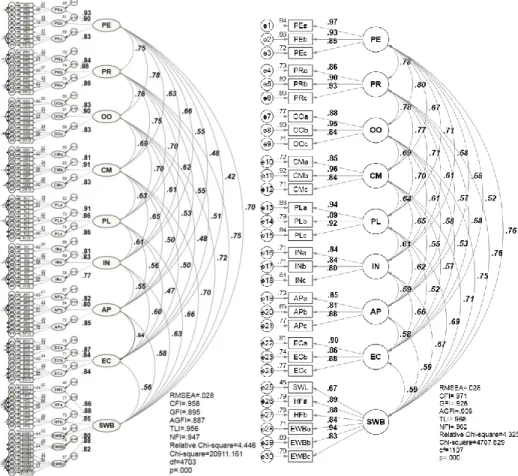
Figure 1: SSWB multidimensional measurement model (left),
The CFA confirmed that SSWB was a multidimensional construct comprising of 30 interrelated first-order constructs and nine interrelated second-order constructs. The measure of SSWB was also a construct-valid. There was no evident that the measurement model was incorrect (Figure 1, left). The factor solution was imputed using the regression imputation. In other words, the observed items were regressed into the 30 first-order constructs. Hence the 30 first-order latent constructs became the observed variables, explained by nine latent variables (Figure 1, right).
The imputed measurement model was assessed for invariance across urban (n = 1590), suburban (n = 1654), and rural (n = 1071) areas. The configural invariance (Figure 1) satisfied the model fit requirement, χ2 (1107) = 4787.829, p = 0.001; RMSEA = 0.028; GFI = 0.925; CFI = 0.971; TLI = 0.996; NFI = 0.962; relative chi-square = 4.325. The factor structure concerning (i) the factor patterns, (ii) the number of factors, and (iii) the specifications of free and fixed patterns of factor loadings were equivalent across settlement areas. The metric invariance was assessed using critical ratio of differences. Partial metric invariance was achieved across settlement areas. The result indicated that at least one item loading from every latent factor was invariant across settlement areas (CR < 1.96). The settlement areas-invariant tests evidenced sufficient measurement invariant to proceed to multi-group analysis in structural model
Structural Model
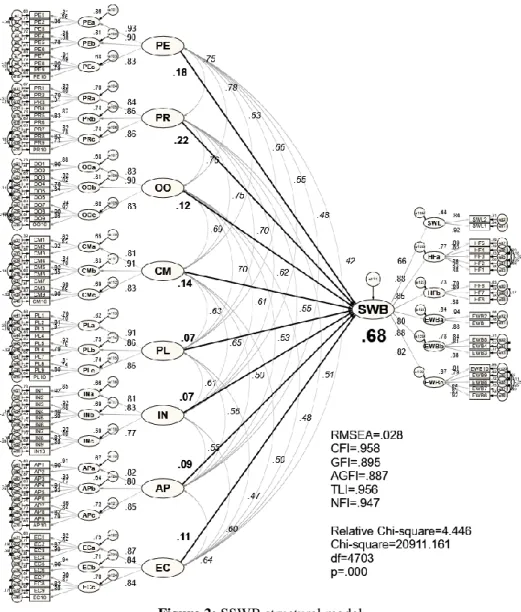
The SEM of HIH and HIE dimensions→SWB showed consistency between the hypothesized causal relationships and the data, (χ2 (4703) = 20911.161, p = 0.001; RMSEA = 0.028; GFI = 0.958; CFI = 0.958; TLI = 0.958; NFI = 0.947; relative chi-square = 4.446). The analysis revealed that collectively the eight the exogenous constructs (PE, PR, OO, CM, PL, IN, AP and EC) significantly explained 68% of the reported SWB (Figure 2). Post hoc power analysis was employed to determine if the model was strong enough to detect the significant effects. At 99% probability level, the observed statistical power was 0.99 (> 0.80), sufficient to claim that the exogenous constructs had statistically significant direct and positive effect on SWB. All parameter estimates of the hypothesized model were free from offending values. Additionally, all of the path coefficients of the causal structure were statistically significant at 0.001 level, and of practical importance. Table 3 displays the path coefficients.
Figure 2: SSWB structural model
Table 3: Causal effects
Path Estimate of Regression Weights S.E. C.R. P Result
Unstandardized Standardized
PE → SWB .141 .176 .018 7.913 .001 Significant
PR → SWB .202 .224 .025 8.161 .001 Significant
OO → SWB .109 .124 .022 5.004 .001 Significant
CM → SWB .141 .144 .021 6.710 .001 Significant
PL → SWB .063 .069 .018 3.516 .001 Significant
IN → SWB .056 .067 .016 3.455 .001 Significant
AP → SWB .064 .088 .013 4.955 .001 Significant
Since HIH and HIE were a multidimensional construct, the HIH and HIE dimensions should not be interpreted independent from each other as to positively influencing SWB. A respondent with high score in PR may not score as well in IN. Such respondent may perceive their level of PR as high, yet report poor level of IN. Therefore each dimension of HIH and HIE should be examined and interpreted both individually and collectively. Otherwise, important causal relationships may be overlooked.
Multi-Group Analysis for Moderation Effects
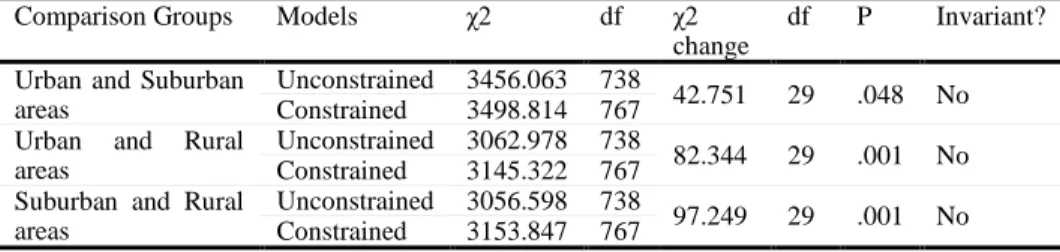
The multi-group moderation analysis using chi-square difference test was conducted on the causal model drawn from the imputed measurement model (Figure 1, right). The multi-group analysis yielded significant change in Chi-square values between unconstrained and constrained models, for all comparison groups (Table 4). The settlement areas was a significant moderator. Hence, the path coefficients varied significantly across settlement areas.
Table 4: Results for multi-group analysis using chi-square for difference tests
Comparison Groups Models χ2 df χ2
change
df P Invariant?
Urban and Suburban areas
Unconstrained 3456.063 738
42.751 29 .048 No Constrained 3498.814 767
Urban and Rural areas
Unconstrained 3062.978 738
82.344 29 .001 No Constrained 3145.322 767
Suburban and Rural areas
Unconstrained 3056.598 738
97.249 29 .001 No Constrained 3153.847 767
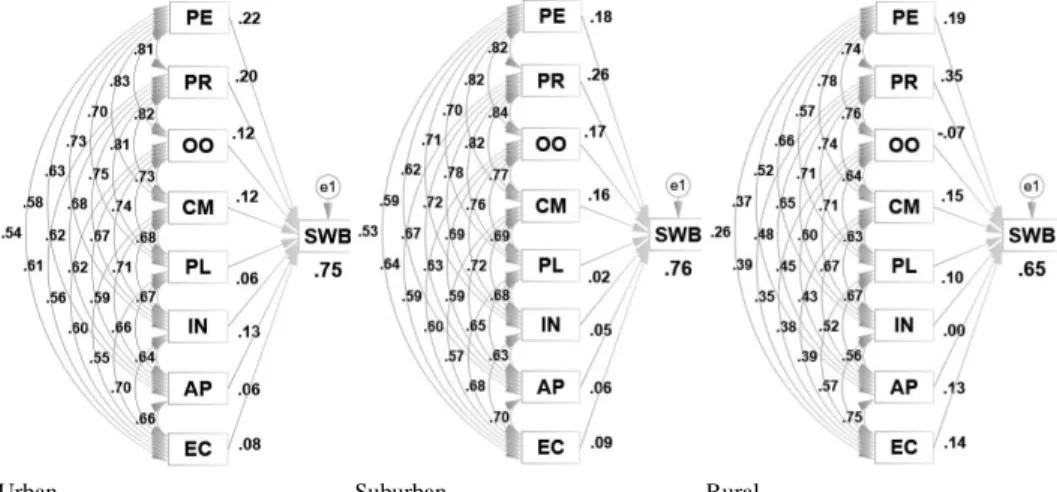
Urban Suburban Rural
Figure 3: Imputed structural model path by path comparisons across settlemet areas
Table 5: Path-by-path comparisons using critical ratio for differences
Paths Urban Suburban z-score Urban Rural z-score Suburban Rural z-score
Est. P Est. P Est. P Est. P Est. P Est. P
PE → SWB .176 .000 .142 .000 -1.235 .176 .000 .154 .000 -0.693 .142 .000 .154 .000 0.374
PR → SWB .180 .000 .233 .000 1.444 .180 .000 .324 .000 3.433**
* .233 .000 .324 .000 2.15**
OO → SWB .107 .000 .148 .000 1.262 .107 .000 -.060 .045
-4.409** *
.148 .000 -.060 .045 -5.519** *
CM → SWB .116 .000 .155 .000 1.223 .116 .000 .146 .000 0.805 .155 .000 .146 .000 -0.257
PL → SWB .053 .000 .021 .277 -1.172 .053 .008 .099 .000 1.293 .021 .277 .099 .000 2.255**
IN → SWB .111 .000 .046 .009
-2.508** .111 .000 .001 .968
-3.378** *
.046 .009 .001 .968 -1.410
AP → SWB .048 .000 .044 .000 -0.229 .048 .000 .094 .000 1.774 .044 .003 .094 .000 1.962**
EC → SWB .061 .000 .074 .000 0.596 .061 .000 .097 .000 1.453 .074 .000 .097 .000 0.941
Notes: *** p-value < 0.01; ** p-value < 0.05
(1) = 5.077, p = .024; z-score = 2.255), and (viii) AP → SWB (χ2 (1) = 3.845, p = .049; z-score = 1.962). The following points summarized the findings:
i. Settlement areas moderated the causal relationship between positive relationships and subjective well-being, such that for rural residents, the positive effect was stronger (β = .324) than urban residents (β = .180) and suburban residents (β = .233).
ii. Settlement areas moderated the causal relationship between organizational opportunity and subjective well-being, such that for rural residents, the effect was negative (β = -.060). However, the effect was positive for urban residents (β = .107) and suburban residents (β = .148).
iii. Settlement areas moderated the causal relationship between personality and lifestyle and subjective well-being, such that for rural residents, the positive effect was stronger (β = .099) than suburban residents (β = .021).
iv. Settlement areas moderated the causal relationship between interaction with nature and subjective well-being, such that for urban residents, the positive effect was stronger (β = .111) than suburban residents (β = .009) and rural residents (β = .001).
v.
Settlement areas moderated the causal relationship between attitude and pro-environmental behaviour and subjective well-being, such that for rural residents, the positive effect was stronger (β = .094) than suburban residents (β = .044).RESULTS ANDDISCUSSION
The underlying structure of SSWB were portrayed in the causal relationships between (i) human interdependency, represented by dimensions of HIH and HIE and (ii) SWB, represented by SWLS, FS and QEWB. Four hypotheses were posed prior to the statistical analysis. Table 6 summarized the findings.
Table 6: Summary of findings
Hypothesis Statements Results Remarks
H1
SSWB was a multidimensional construct comprising of nine interrelated constructs
(χ2 (4703) = 20911.161, p = 0.001; RMSEA = 0.028; GFI = 0.958; CFI = 0.958; TLI = 0.958; NFI = 0.947; relative chi-square = 4.446)
H1
Supported
H2
The measure of
multidimensional SSWB is construct-valid
Factor loadings >.7; CR >.7; H >.8; AVE >.5; AVE>MSV; Inter-construct r < .85).
H2
Supported
H3
Human interdependence has a direct and positive causal effect
on SWB
R2 =.68 (RMSEA =.028; CFI =.958; cmin/df =4.446); PE, β =.141, p <.05; PR, β =.202, p <.05; OO, β =.109, p <.05; CM, β =.141, p <.05; PL, β =.063, p <.05; IN, β =.056, p <.05; AP, β =.064, p <.05; EC, β =.082, p < .05.
H3
H4
Settlement areas
significantly moderate the relationship between human interdependence and SWB
Urban and Suburban, χ2(29) = 42.751, p < .05; Urban and Rural, χ2(29) = 82.344, p < .05; and Suburban and Rural, χ2(29) = 97.249, p < .05.
H4
Supported
The CFA evidenced that SSWB was a multidimensional construct comprising of nine interrelated second-order constructs, explained by 30 interrelated first-order constructs. The CFA also confirmed that the measure of multidimensional SSWB was construct-valid. SEM found that PE, PR, OO, CM, PL, IN, AP and EC had significant direct and positive causal effects on SWB. The HIH and HIE dimensions explained 68% of the reported SWB. Finally, it was discovered that settlement areas was a significant moderator to the SSWB model. The path coefficients varied significantly across settlement areas. Further assessments revealed that the strengths of the structural paths (i) PR → SWB, (ii) OO → SWB, (iii) PL → SWB, (iv) IN → SWB, and (v) AP → SWB significantly differed across urban, suburban and rural settlements.
From the urban and suburban residents’ viewpoints, the causal effects of (i) OO and (ii) IN on SWB were stronger in comparison to the rural residents. The results suggested that contributing in the working environment strongly improved the well-being of the urban and suburban residents. At the same time, the voluntary and involuntary contact with natural environment significantly and positively influenced the well-being of the urban and suburban residents. On the contrary, the causal effect of positive relationship on SWB for urban and suburban residents was significantly weak compared to rural residents. Urban and suburban residents had lower well-being improvement compared to the rural residents, through investing in personal relationships.
CONCLUSION
The discovery of human interdependence plays a big part in the architectural psychology as there exist a new set of criteria in understanding the dynamics of sustainability and SWB. This study expanded the existing body of knowledge on SSWB. The results substantiated the psychometric adequacy of the measure of SSWB. The underlying structure of SSWB were demonstrated through the causal relationships of human interdependency on subjective well-being. The study discovered that social and environmental context of human interdependence highly explained SWB. The study also found that the causal relationships of human interdependency and well-being vary across urban, suburban and rural settlements.
ACKNOWLEDGEMENT
This research was supported by Fundamental Research Grant Scheme (FRGS).
REFERENCES
Bakar, A. A., Osman, M. M., Bachok, S., Ibrahim, M., & Abdullah, A. (2015, November). Sustainable well-being: An empirical exploration on human interdependence with the environment. 6th International Conference on Sustainable Future for Human
Security. November 17-19, 2015, Bali, Indonesia.
Bakar, A. A., Osman, M. M., Bachok, S., Ibrahim, M. & Abdullah, A. (2016a, October). Sustainable Well-Being: An Empirical Exploration on Human Interdependence with other Humans. International Conference on Architecture and Built
Environment. October 2-6, 2016, Kuala Lumpur, Malaysia.
Bakar, A. A., Osman, M. M., Bachok, S., Ibrahim, M. & Abdullah, A. (2016b, October). Sustainable Well-Being: An Empirical Exploration on Human Interdependence with the Environment. International Conference on Architecture and Built
Environment. October 2-6, 2016, Kuala Lumpur, Malaysia.
Diener, E., Wirtz, D., Tov, W., Kim-Prieto, C., Choi, D., Oishi, S., & Biswas-Diener, R. (2009). New measures of well-being: Flourishing and positive and negative feelings. Social Indicators Research, 39, 247-266.
Pavot, W., & Diener, E. (2008). The satisfaction with life scale and the emerging construct of life satisfaction. The Journal of Positive Psychology, 3(2), 137-152. Waterman, A. S., Schwartz, S. J., Zamboanga, B. L., Ravert, R. D., Williams, M. K., Bede